时间序列预测的七种方法-python复现
Posted iuk11
tags:
篇首语:本文由小常识网(cha138.com)小编为大家整理,主要介绍了时间序列预测的七种方法-python复现相关的知识,希望对你有一定的参考价值。
前提:数据集为JetRail高铁的乘客数量,网上搜一下可以找到。数据集共18288行有效数据,第一列对应 ID ;第二列为Datatime,格式为日-月-年+时间,时间间隔为一小时;第三列为Count,表示该时段内乘客数量。
目录
测试数据是否正确读入
import pandas as pd #pands别名pd
df = pd.read_csv('train.csv') #读取csv文件
print(df.head(5)) #读取前5行数据
数据可视化
x
x
x轴表示时间,
y
y
y轴表示乘客数量。
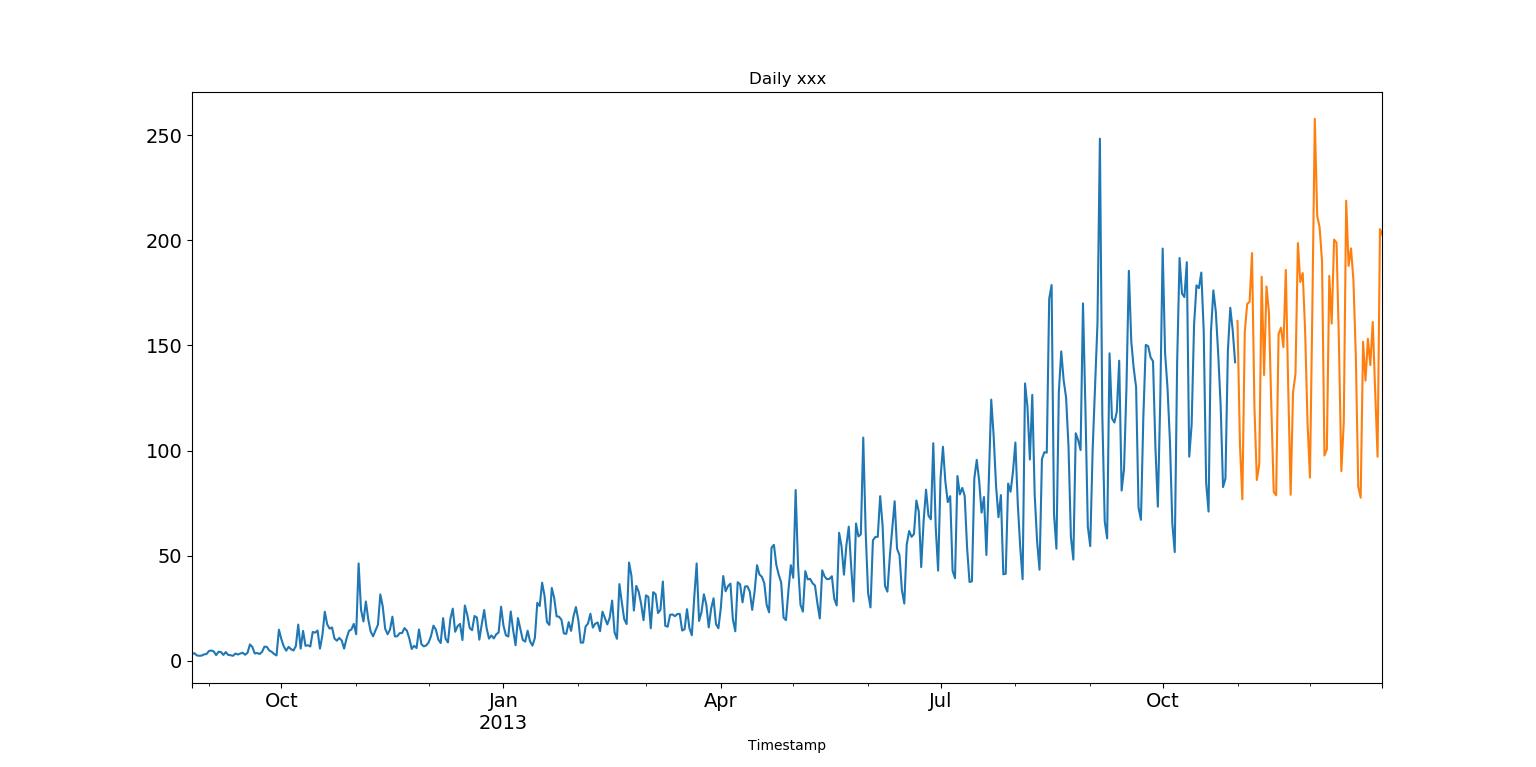
将数据拆分成两部分,[1,14]作为训练集,[15,16]作为测试集,测试集将与预测集进行均方根误差计算,检查预测的准确率。误差值越小,说明预测越准确。
df['Timestamp']=pd.to_datetime(df['Datetime'],format="%d-%m-%Y %H:%M")
代码解释:
arg–df['Datetime'],表示要转换为日期时间的对象
format,str,改变格式,解析时间的strftime
其它参数未用到,想了解可以查看pd.to_datetime()官方文档
import pandas as pd
import numpy as np
import matplotlib.pyplot as plt

df=pd.read_csv('train.csv',nrows=11856)
train=df[0:10392]#训练集
test=df[10392:]#测试集
df['Timestamp']=pd.to_datetime(df['Datetime'],format="%d-%m-%Y %H:%M")
df.index=df['Timestamp']  #在train文档中新增加一列Timestamp
df=df.resample('D').mean() #按天采样,计算均值

train['Timestamp']=pd.to_datetime(train['Datetime'],format="%d-%m-%Y %H:%M")
train.index=train['Timestamp']
train=train.resample('D').mean()

test['Timestamp']=pd.to_datetime(test['Datetime'],format="%d-%m-%Y %H:%M")
test.index=test['Timestamp']
test=test.resample('D').mean()

#数据可视化
train.Count.plot(figsize=(15,7),title='Daily xxx',fontsize=14)
test.Count.plot(figsize=(15,7),title='Daily xxx',fontsize=14)
plt.show()
(一)朴素法
应用情境:稳定性高的数据集。
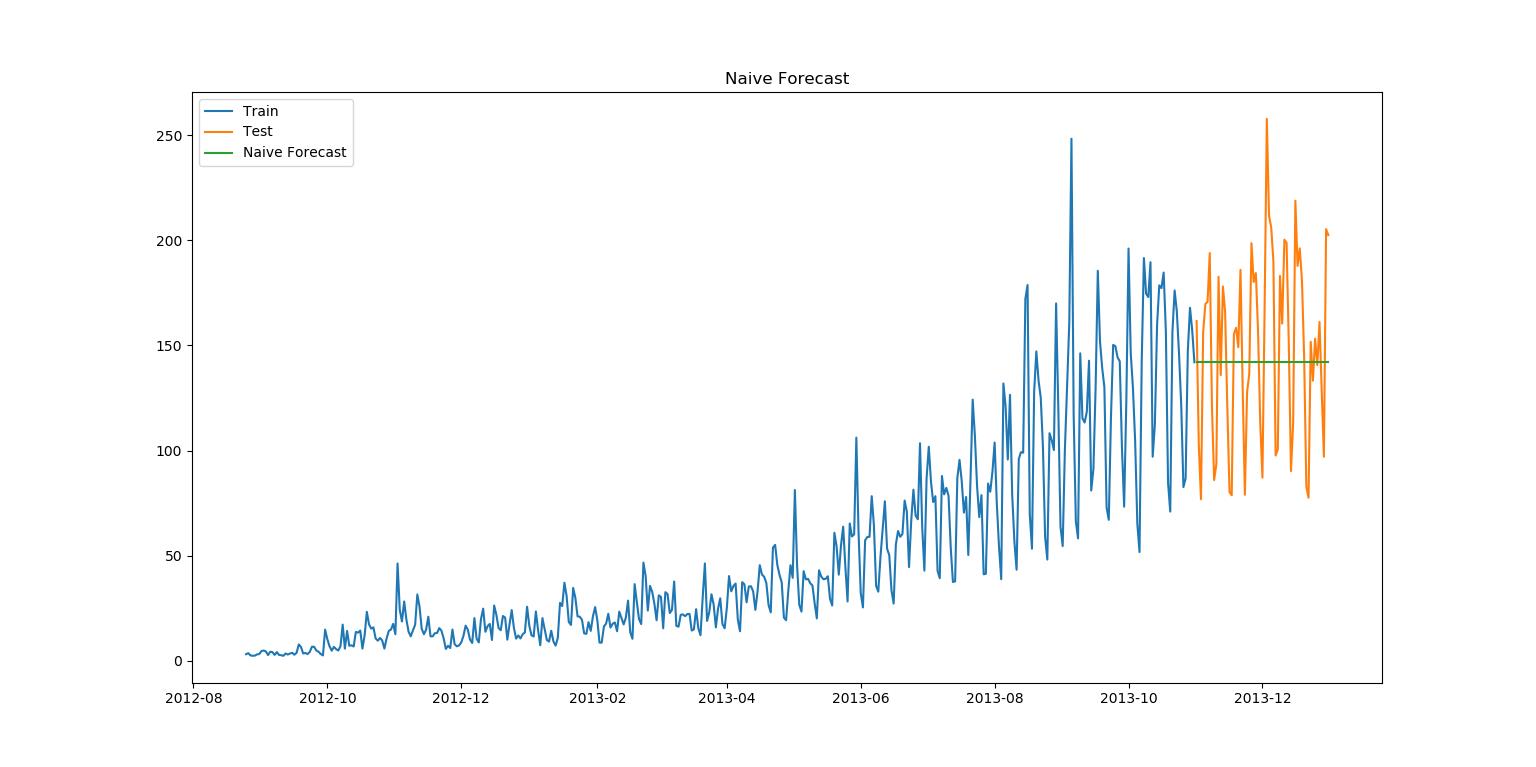
应用方法:以最后一个训练点为预测值的一条水平直线。
该数据集的均方根误差RMS为43.91640614391676。
plt.plot()函数说明
plt.plot(x, y, 'bs', label='xxx')
横轴为 x x x轴,纵轴为 y y y轴。 b s bs bs表示蓝色方块点。 l a b e l label label表示标题。
公式为:
y
t
+
1
^
=
y
t
\\hat{y_{t+1}} = y_t
yt+1^=yt
该代码需要连接上方数据预处理(拆分,改变格式)代码才能正常运行。
import matplotlib.pyplot as plt
from sklearn.metrics import mean_squared_error
from math import sqrt
#
dd=np.asarray(train['Count']) #将train中的Count列转化为array(数组)形式
y_hat=test.copy()
y_hat['naive']=dd[len(dd)-1] #预测数据均为test的最后一个数值
plt.figure(figsize=(12,8))
plt.plot(train.index,train['Count'],label='Train')
plt.plot(test.index,test['Count'],label='Test')
plt.plot(y_hat.index,y_hat['naive'],label='Naive Forecast')
plt.legend(loc='best')
plt.title("Naive Forecast")
plt.show()
#均方根误差计算
rms = sqrt(mean_squared_error(test['Count'], y_hat['naive']))
print(rms)
(二)简单平均法
应用情境:每个时间段内的平均值基本保持不变的数据集。
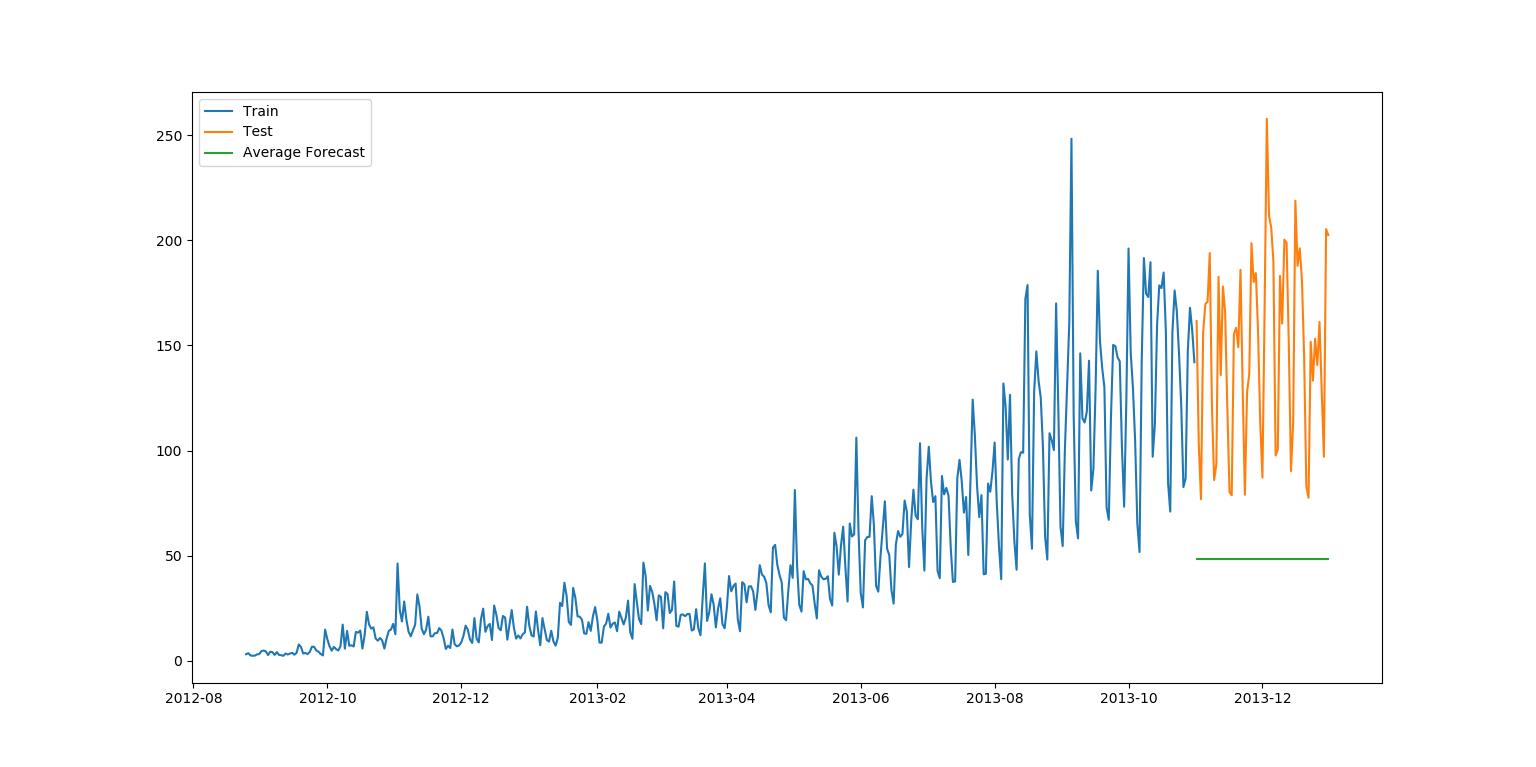
应用方法:预测的价格和过去天(已知数据的)平均值的价格一致。
该数据集的均方根误差RMS为109.88526527082863。
公式为:
y
^
x
+
1
=
1
x
∑
i
=
1
x
y
i
\\hat{y}_{x+1} = \\frac{1}{x}\\sum_{i=1}^{x}y_{i}
y^x+1=x1i=1∑xyi
该代码需要连接上方数据预处理(拆分,改变格式)代码才能正常运行。
y_hat_avg=test.copy()
y_hat_avg['avg_forecast']=train['Count'].mean() #取train中Count列的平均值
plt.figure(figsize=(12,8))
plt.plot(train['Count'],label='Train')
plt.plot(test['Count'],label='Test')
plt.plot(y_hat_avg['avg_forecast'],label='Average Forecast')
plt.legend(loc='best') #对性能图做出一些补充说明的问题
plt.show()

rms = sqrt(mean_squared_error(test['Count'], y_hat_avg['avg_forecast']))
print(rms)
(三)移动平均法
应用情境:最后一个时间段内的平均值基本保持不变(平稳)的数据集。
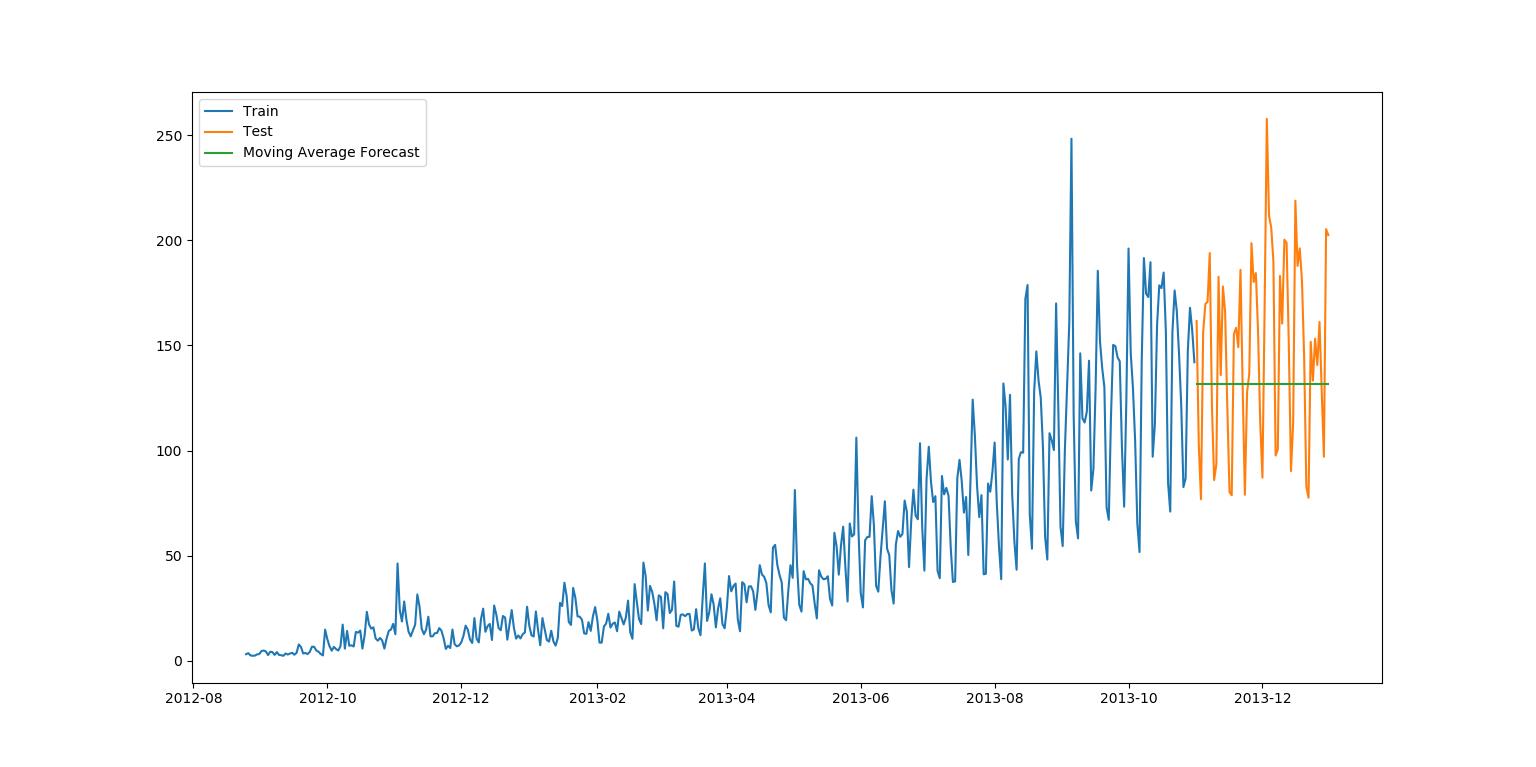
应用方法:预测的价格和最近时期的平均值的价格一致。
该数据集的均方根误差RMS为46.72840725106963。
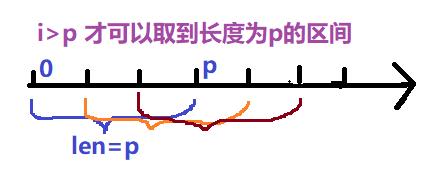
因为取最近时期的平均值,我们必须知道最近的时期是多少天(多长),引入滑动窗口的概念,我们规定最近时期长度为
p
p
p ,对于所有的
i
>
p
i>p
i>p:
y
^
l
=
1
p
(
y
i
−
1
+
y
i
−
2
+
y
i
−
3
+
…
+
y
i
−
p
)
\\hat{y}_{l} = \\frac{1}{p}(y_{i-1}+y_{i-2}+y_{i-3}+…+y_{i-p})
y^l=p1(yi−1+yi−2+yi−3+…+yi−p)
图示滑动窗口概念理解:
该代码需要连接上方数据预处理(拆分,改变格式)代码才能正常运行。
y_hat_avg = test.copy()
y_hat_avg['moving_avg_forecast']=train['Count'].rolling(60).mean().iloc[-1] #以p=60计算滚动平均值
plt.figure(figsize=(16,8))
plt.plot(train['Count'], label='Train')
plt.plot(test['Count'], label='Test')
plt.plot(y_hat_avg['moving_avg_forecast'], label='Moving Average Forecast')
plt.legend(loc='best')
plt.show()

rms = sqrt(mean_squared_error(test['Count'], y_hat_avg['moving_avg_forecast']))
print(rms)
(四)简单指数平滑法(SES)
应用情境:没有明显趋势或季节规律的预测数据。简单平均法和加权移动平均法的折中方法。
应用方法:预测的价值为每个时间段乘以该时间段的权重和,越接近当下(预测)的时间段赋予的权重越大。
该数据集的均方根误差RMS为43.357625225228155,α=0.6。(最终均方根误差可根据α的调节而降低)
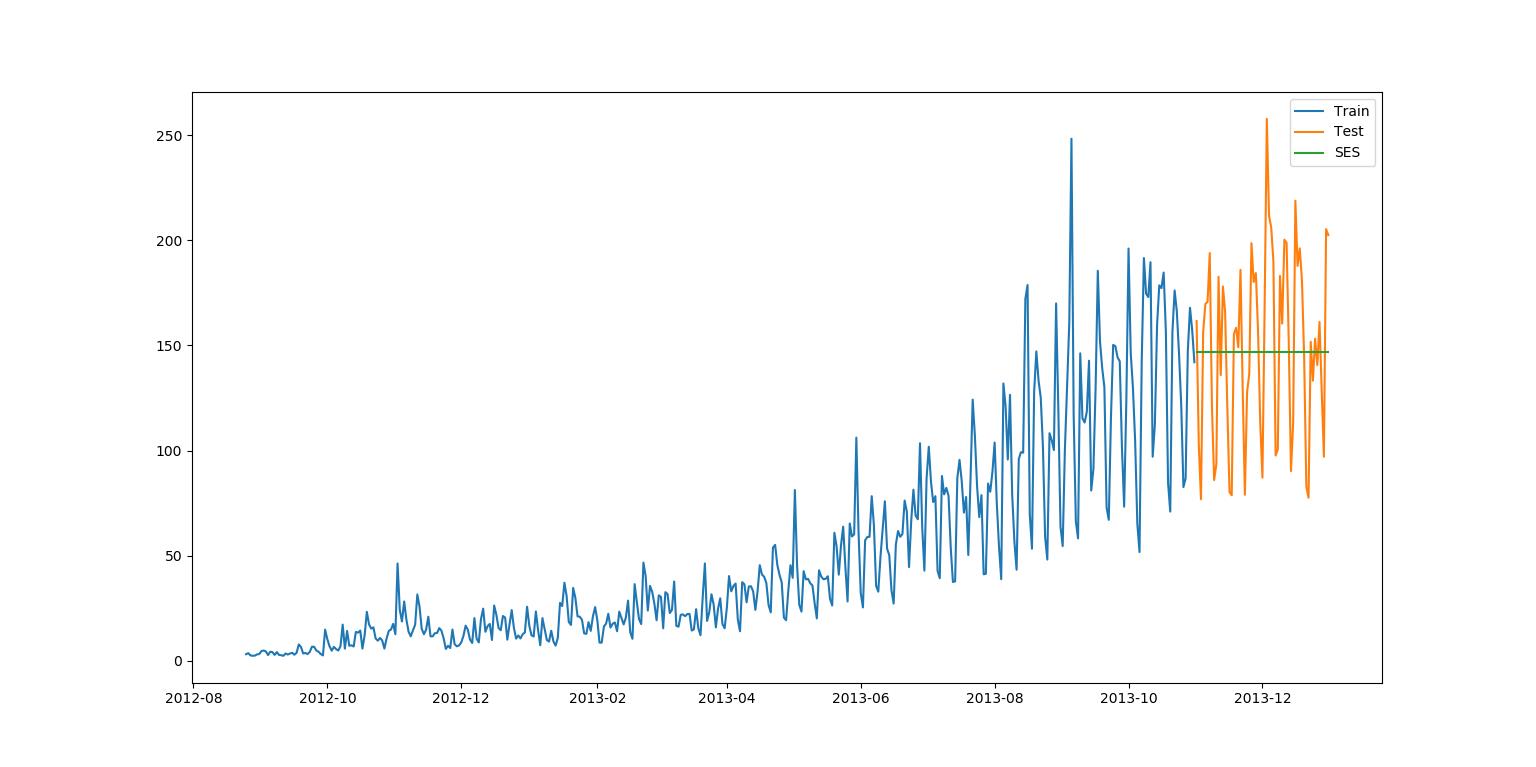
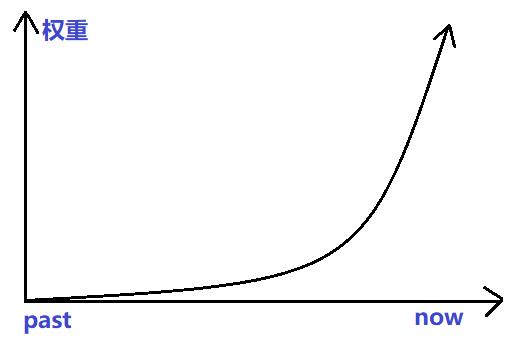
权重的赋予方式:从早到晚的每个时间段值的权重参数呈指数级下降。 y ^ T + 1 ∣ T = α y T + α ( 1 − α ) y T − 1 + α ( 1 − α ) 2 y T − 2 + … \\hat{y}_{T+1|T}=\\alpha y_T+\\alpha(1-\\alpha)y_{T-1}+\\alpha(1-\\alpha)^{2}y_{T-2}+… y^T+1∣T=αyT+α(1−α)yT−1+α(1−α)2yT−2+…其中 0≤α≤1 为平滑参数; y T + 1 y_{T+1} yT+1是 y 1 y_1 y1~ y t y_t yt的值的加权平均值;预测值 y ^ x \\hat{y}_x y^x为 α ⋅ y t \\alpha \\cdot y_t α⋅yt与 ( 1 − α ) ⋅ y ^ x (1-\\alpha) \\cdot \\hat{y}_x (1−α)⋅y^x的和。即上述公式也可以写成: y ^ t + 1 ∣ t = α y t + ( 1 − α ) y ^ t − 1 ∣ t \\hat{y}_{t+1|t}=\\alpha y_t+(1-\\alpha)\\hat{y}_{t-1|t} y^t+1∣t=αy