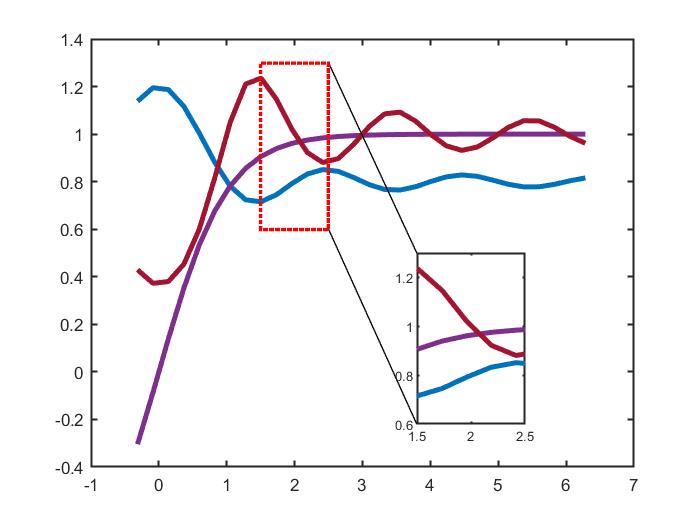
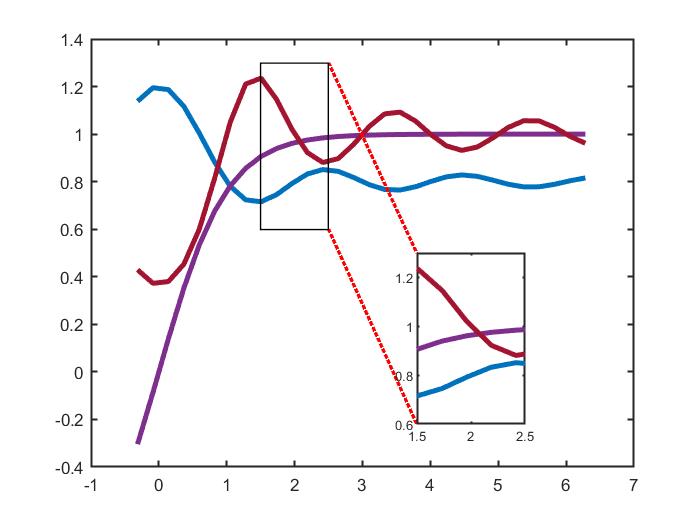
放大绘图轴自定义区域MATLAB 代码
Posted 这是一个很随便的名字
tags:
篇首语:本文由小常识网(cha138.com)小编为大家整理,主要介绍了放大绘图轴自定义区域MATLAB 代码相关的知识,希望对你有一定的参考价值。

用于放大绘图轴自定义区域的 MATLAB 代码。
主要特点
- 易于使用的 API
- 独立模块参数设置(轴、矩形、线)
- 可定制的连接线方向
如何使用
简单演示
% Magnification of the customized regions of the plot's axis.
clc
clear
close all

% data
x = linspace(-0.1*pi,2*pi, 30);
y = cell(1, 3);
y{1, 1} = 0.4*sinc(x)+0.8;
y{1, 2} = tanh(x);
y{1, 3} = exp(-sinc(x));

%% main axes
figure
color_ = [0, 114, 189; 126, 47, 142; 162, 20, 47]/255;
axes1 = axes('Units', 'normalized');
hold(axes1, 'on');
box(axes1,'on');
set(axes1, 'LineWidth', 1.2, 'TickDir', 'in');
for i = 1:3
    plot(x, y{1, i}, 'Parent', axes1, 'Color', color_(i, :), 'LineWidth', 3)
end
legend(axes1, 'line-1', 'line-2', 'line-3')

%% new axes
% parameters of axes
parameters = struct('axesPosition', [0.6, 0.1, 0.2, 0.4],...
                    'zoomZone', [1.5, 2.5; 0.6, 1.3],...
                    'lineDirection', [1, 2; 4, 3]);

%% plot
zp = BaseZoom();
zp.plot(parameters)
关于参数
轴位置
将axisPosition 指定为数据单位中形式为[xywh] 的四元素向量。x 和 y 元素确定位置,w 和 h 元素确定大小。该函数绘制到当前坐标区而不清除坐标区中的现有内容。

变焦区
zoomZone 是一个 2×2 矩阵,表示矩形框的坐标。第一行的x_start 和x_end 是缩放区域的x 坐标起点和终点,第二行的y_start 和y_end 是缩放区域的y 坐标起点和终点。
线路方向
缩放区域的矩形框通过连接线连接到子坐标系。矩形框和子坐标系的四个角分别为1、2、3、4。对应的四个角分别为右上、左上、左下、右下。下图显示了几种常见情况的方向设置:

以第一组为例:矩形框的右下角(4)连接子坐标系的左下角(3),矩形框的右上角(1)连接子坐标系的左下角(3)次坐标系左上角(2),所以方向参数为[1, 2; 4, 3]。
特性
可以在文件--“BaseZoom.m”中编辑轴、矩形、线的参数
    properties
        %
        axes1
        axes2
        rectangle
        XLimNew
        YLimNew
        mappingParams

        % parameters of inserted axes
        axes2Box = 'on'
        axes2BoxColor = 'none'
        axes2BoxLineWidth = 1.2
        axes2TickDirection = 'in'

        % parameters of inserted rectangle
        rectangleColor = 'k'
        rectangleFaceColor = 'none'
        rectangleFaceAlpha = 1
        rectangleLineStyle = '-'
        rectangleLineWidth = 0.8

        % parameters of inserted line
        boxLineStyle = ':'
        boxLineColor = 'k'
        boxLineWidth = 1
        boxLineMarker = 'none'
        boxLineMarkerSize = 6
    end
例如,将矩形框更改为宽度为 2 的红色虚线:
        % parameters of inserted rectangle
        rectangleColor = 'r'
        rectangleFaceColor = 'none'
        rectangleFaceAlpha = 1
        rectangleLineStyle = ':'
        rectangleLineWidth = 2
例如,更改子坐标系的框和缩放方向:
        % parameters of inserted axes
        axes2Box = 'off'
        axes2BoxColor = 'none'
        axes2BoxLineWidth = 1.2
axes2TickDirection = 'out' 
例如,将连接线更改为宽度为 2 的红色虚线:
        % parameters of inserted line
        boxLineStyle = ':'
        boxLineColor = 'r'
        boxLineWidth = 2
        boxLineMarker = 'none'
boxLineMarkerSize = 6 
获取完整代码:https://ai.52learn.online/code/111
以上是关于放大绘图轴自定义区域MATLAB 代码的主要内容,如果未能解决你的问题,请参考以下文章