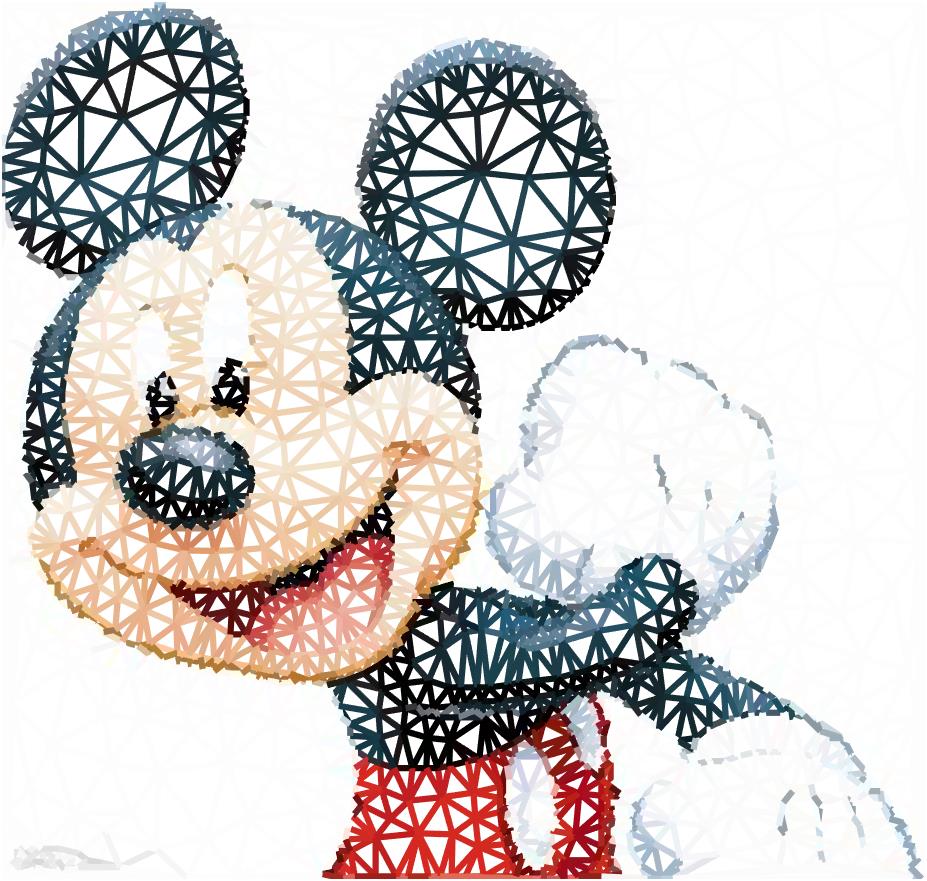
嘘!我有特殊的绕线画技巧,教你用MATLAB绘制另一种绕线画
Posted slandarer
tags:
篇首语:本文由小常识网(cha138.com)小编为大家整理,主要介绍了嘘!我有特殊的绕线画技巧,教你用MATLAB绘制另一种绕线画相关的知识,希望对你有一定的参考价值。
实际上该方法是将之前图片三角化的代码进行了一部分改写,能够适用于色块明显,背景色较浅的图像绕线(三角网格)风格生成(这说的不就几乎是卡通形象嘛)。
效果图:


图片三角化代码传送门
MATLAB 图片三角风格化(low poly)
注:除了三角化代码提到的参数外,本文代码多增加了一个lineWidth变量用以调整线条粗细。
完整代码
注:最后绘制线条的过程有点慢(一般十几秒左右),要有耐心嗷。
function lowPoly2()
oriPic=imread('test.jpg');
lineWidth=2.5;%线条粗细
% use sobel algorithm to detect image edges
if size(oriPic,3)==3
grayPic=rgb2gray(oriPic);
else
grayPic=oriPic;
end
sobelPic=sobelConv2_gray(grayPic);
% imshow(sobelPic)
edgePic=sobelPic;
edgePic(edgePic<max(max(edgePic)).*0.4)=0;
[edgeX,edgeY]=find(edgePic>0);
edgePntList=[edgeY,edgeX];
% set the triangle density
redge=min(size(sobelPic))/60;
rmax=min(size(sobelPic))/20;
rmin=min(size(sobelPic))/40;
% use poisson disc sampling to select points
edgePntList=poissonEdge(edgePntList,redge);
pntList=poissonDisk(sobelPic,[rmin,rmax],30,edgePntList);
% imshow(sobelPic)
% hold on
% scatter(pntList(:,1),pntList(:,2),3,'filled')
% construct the delone triangle
DT=delaunay(pntList(:,1),pntList(:,2));
%triplot(DT,pntList(:,1),pntList(:,2));
%% newPart==========================================================
Lset=[[DT(:,1),DT(:,2)];[DT(:,1),DT(:,3)];[DT(:,2),DT(:,3)]];
vset1=pntList(Lset(:,1),:);
vset2=pntList(Lset(:,2),:);
linecenter=round((vset1+vset2)./2);
tempList=linecenter(:,2)+(linecenter(:,1)-1)*size(oriPic,1);
if size(oriPic,3)==3
Rchannel=oriPic(:,:,1);
Gchannel=oriPic(:,:,2);
Bchannel=oriPic(:,:,3);
colorList(:,1)=Rchannel(tempList);
colorList(:,2)=Gchannel(tempList);
colorList(:,3)=Bchannel(tempList);
else
colorList(:,1)=oriPic(tempList);
colorList(:,2)=oriPic(tempList);
colorList(:,3)=oriPic(tempList);
end
[Rows,Cols,~]=size(oriPic);
ratio=[1260,560]./[Cols,Rows];
fig=figure('units','pixels',...
'position',[20 60 min(ratio)*(Cols+1) min(ratio)*(Rows+1)],...
'Color',[1 1 1]);
ax=axes('Units','pixels',...
'parent',fig,...
'Color',[1 1 1],...
'Position',[0 0 min(ratio)*(Cols+1) min(ratio)*(Rows+1)],...
'XLim',[0 Cols+1],...
'YLim',[0 Rows+1],...
'XColor','none',...
'YColor','none');
hold on
ax.YDir='reverse';
% pause(0.001)
for i=1:size(colorList,1)
plot([vset1(i,1),vset2(i,1)],[vset1(i,2),vset2(i,2)],'Color',colorList(i,:),'LineWidth',lineWidth)
end
%% oriPart==========================================================
% % calculate the pixel value at the center of gravity of the triangle
% vset1=pntList(DT(:,1),:);
% vset2=pntList(DT(:,2),:);
% vset3=pntList(DT(:,3),:);
% barycenter=round((vset1+vset2+vset3)./3);
% tempList=barycenter(:,2)+(barycenter(:,1)-1)*size(oriPic,1);
% if size(oriPic,3)==3
% Rchannel=oriPic(:,:,1);
% Gchannel=oriPic(:,:,2);
% Bchannel=oriPic(:,:,3);
% colorList(:,:,1)=Rchannel(tempList);
% colorList(:,:,2)=Gchannel(tempList);
% colorList(:,:,3)=Bchannel(tempList);
% else
% colorList(:,:,1)=oriPic(tempList);
% colorList(:,:,2)=oriPic(tempList);
% colorList(:,:,3)=oriPic(tempList);
% end
%
% % show picture
% z=zeros([size(pntList,1),1]);
% trisurf(DT,pntList(:,1),pntList(:,2),z,'CData',colorList,'EdgeColor','none')
% ax=gca;
% hold(ax,'on')
% set(ax,'XTick',[],'YTick',[],'XColor','none','YColor','none')
% axis equal
% set(ax,'YDir','reverse','View',[0,90])
%% Correlation Functions============================================
function resultSet=poissonEdge(edgeList,R)
preSet=edgeList;
resultSet=[0 0];
resultSet(1,:)=[];
times=0;
while times<150
tempPos=randi([1,size(preSet,1)],1);
selectedPnt=preSet(tempPos,:);
dis=sqrt(sum((edgeList-selectedPnt).^2,2));
candidate=find(dis>=R&dis<=2*R);
if length(candidate)>30
pntSet=edgeList(candidate(1:30),:);
else
pntSet=edgeList(candidate,:);
end
flag=0;
for j=1:size(pntSet,1)
pnt=pntSet(j,:);
if size(resultSet,1)==0
resultSet=[resultSet;pnt];
preSet=[preSet;pnt];
flag=1;
else
dis=sqrt(sum((resultSet-pnt).^2,2));
if all(dis>=R)
resultSet=[resultSet;pnt];
preSet=[preSet;pnt];
flag=1;
end
end
end
if flag==1
preSet(tempPos,:)=[];times=0;
else
times=times+1;
end
disp(['edge pnt num:',num2str(size(resultSet,1))]);
end
end
function resultSet=poissonDisk(grayPic,R,K,edgePntList)
[m,n]=size(grayPic);
preSet=edgePntList;
resultSet=[edgePntList;1,1;n,m;1,m;n,1];
grayPic=double(255-grayPic);
cmin=min(min(grayPic));
cmax=max(max(grayPic));
rMap=grayPic-cmin;
rMap=rMap./(cmax-cmin).*(R(2)-R(1))+R(1);
times=0;
while times<500
tempPos=randi([1,size(preSet,1)],1);
selectedPnt=preSet(tempPos,:);
r=rMap(round(selectedPnt(2)),round(selectedPnt(1)));
theta=rand(K,1).*2*pi;
radius=rand(K,1).*r+r;
x=radius.*cos(theta)+selectedPnt(1);
y=radius.*sin(theta)+selectedPnt(2);
flag=0;
for j=1:K
pnt=[x(j),y(j)];
if pnt(1)>=1&&pnt(2)>=1&&pnt(1)<=n&&pnt(2)<=m
if size(resultSet,1)==0
resultSet=[resultSet;pnt];
preSet=[preSet;pnt];
flag=1;
else
dis=sqrt(sum((resultSet-pnt).^2,2));
if all(dis>=r)
resultSet=[resultSet;pnt];
preSet=[preSet;pnt];
flag=如何使用MATLAB绘制绕线画?附带颜色渲染
七夕节快到了,教你用MATLAB绘制blingbling的大钻石