频繁GC导致OOM内存溢出的问题排查
Posted 阿拉的梦想
tags:
篇首语:本文由小常识网(cha138.com)小编为大家整理,主要介绍了频繁GC导致OOM内存溢出的问题排查相关的知识,希望对你有一定的参考价值。
频繁GC导致OOM内存溢出的问题排查
1.问题发现
日志中打印如下,发现频繁GC并导致OOM
[2021-08-25 15:14:33, 948] [ERROR] [] [] [DubboServerHandler-74.0.2.41:11306-thread-488]- org.apache.dubbo.rpc.filter.ExceptionFilter$ExceptionListener.onResponse(ExceptionFilter.java:86) - [ [DUBBO] Got unchecked and undeclared exception which called by 74.0.2.41. service: cn.demowalk.ocean.manage.client.service.AppResourceRefService, method: listAdd, exception: java.lang.OutOfMemoryError: GC overhead limit exceeded, dubbo version: 2.7.4.1, current host: 74.0.2.41]
 java.lang.OutOfMemoryError: GC overhead limit exceeded
	at java.lang.reflect.Method.getParameterTypes(Method.java:264) ~[?:1.8.0_201]
	at org.springframework.beans.BeanUtils.copyProperties(BeanUtils.java:677) ~[spring-beans-5.1.6.RELEASE.jar!/:5.1.6.RELEASE]
	at org.springframework.beans.BeanUtils.copyProperties(BeanUtils.java:602) ~[spring-beans-5.1.6.RELEASE.jar!/:5.1.6.RELEASE]
	at cn.demowalk.ocean.manage.data.dao.impl.postgres.ApiApplicationResourceRefDaoImpl.convertToDTO(ApiApplicationResourceRefDaoImpl.java:188) ~[ocean-service-manage-data-1.6.2-SNAPSHOT.jar!/:?]
	at cn.demowalk.ocean.manage.data.dao.impl.postgres.ApiApplicationResourceRefDaoImpl.lambda$queryApiApplicationResourceRef$0(ApiApplicationResourceRefDaoImpl.java:72) ~[ocean-service-manage-data-1.6.2-SNAPSHOT.jar!/:?]
	at cn.demowalk.ocean.manage.data.dao.impl.postgres.ApiApplicationResourceRefDaoImpl$$Lambda$757/828349953.apply(Unknown Source) ~[?:?]
	at java.util.stream.ReferencePipeline$3$1.accept(ReferencePipeline.java:193) ~[?:1.8.0_201]
	at java.util.ArrayList$ArrayListSpliterator.forEachRemaining(ArrayList.java:1382) ~[?:1.8.0_201]
	at java.util.stream.AbstractPipeline.copyInto(AbstractPipeline.java:481) ~[?:1.8.0_201]
	at java.util.stream.AbstractPipeline.wrapAndCopyInto(AbstractPipeline.java:471) ~[?:1.8.0_201]
	at java.util.stream.ReduceOps$ReduceOp.evaluateSequential(ReduceOps.java:708) ~[?:1.8.0_201]
	at java.util.stream.AbstractPipeline.evaluate(AbstractPipeline.java:234) ~[?:1.8.0_201]
	at java.util.stream.ReferencePipeline.collect(ReferencePipeline.java:499) ~[?:1.8.0_201]
	at cn.demowalk.ocean.manage.data.dao.impl.postgres.ApiApplicationResourceRefDaoImpl.queryApiApplicationResourceRef(ApiApplicationResourceRefDaoImpl.java:72) ~[ocean-service-manage-data-1.6.2-SNAPSHOT.jar!/:?]
	at cn.demowalk.ocean.manage.biz.ApiApplicationResourceRefManager.queryApiApplicationResourceRef(ApiApplicationResourceRefManager.java:41) ~[ocean-service-manage-biz-1.6.2-SNAPSHOT.jar!/:?]
	at cn.demowalk.ocean.manage.service.ApiApplicationResourceRefServiceImpl.getAppResourceRefs(ApiApplicationResourceRefServiceImpl.java:131) ~[ocean-service-manage-service-1.6.2-SNAPSHOT.jar!/:?]
	at cn.demowalk.ocean.manage.service.ApiApplicationResourceRefServiceImpl.reloadRedisApplicationIdRefCache(ApiApplicationResourceRefServiceImpl.java:137) ~[ocean-service-manage-service-1.6.2-SNAPSHOT.jar!/:?]
	at cn.demowalk.ocean.manage.service.ApiApplicationResourceRefServiceImpl.lambda$AppResourceRefService$10(ApiApplicationResourceRefServiceImpl.java:601) ~[ocean-service-manage-service-1.6.2-SNAPSHOT.jar!/:?]
	at cn.demowalk.ocean.manage.service.ApiApplicationResourceRefServiceImpl$$Lambda$756/1822742663.accept(Unknown Source) ~[?:?]
	at java.util.HashMap$KeySpliterator.forEachRemaining(HashMap.java:1556) ~[?:1.8.0_201]
	at java.util.stream.ReferencePipeline$Head.forEach(ReferencePipeline.java:580) ~[?:1.8.0_201]
	at cn.demowalk.ocean.manage.service.ApiApplicationResourceRefServiceImpl.AppResourceRefService(ApiApplicationResourceRefServiceImpl.java:600) ~[ocean-service-manage-service-1.6.2-SNAPSHOT.jar!/:?]
	at cn.demowalk.ocean.manage.service.ApiApplicationResourceRefServiceImpl$$FastClassBySpringCGLIB$$f7b67645.invoke(<generated>) ~[ocean-service-manage-service-1.6.2-SNAPSHOT.jar!/:?]
	at org.springframework.cglib.proxy.MethodProxy.invoke(MethodProxy.java:218) ~[spring-core-5.1.6.RELEASE.jar!/:5.1.6.RELEASE]
	at org.springframework.aop.framework.CglibAopProxy$CglibMethodInvocation.invokeJoinpoint(CglibAopProxy.java:749) ~[spring-aop-5.1.6.RELEASE.jar!/:5.1.6.RELEASE]
	at org.springframework.aop.framework.ReflectiveMethodInvocation.proceed(ReflectiveMethodInvocation.java:163) ~[spring-aop-5.1.6.RELEASE.jar!/:5.1.6.RELEASE]
	at cn.demowalk.ocean.common.config.proxy.OceanServiceProxy.invoke(OceanServiceProxy.java:170) ~[ocean-service-common-config-1.5.4.20210104-RELEASE.jar!/:?]
	at org.springframework.aop.framework.ReflectiveMethodInvocation.proceed(ReflectiveMethodInvocation.java:186) ~[spring-aop-5.1.6.RELEASE.jar!/:5.1.6.RELEASE]
	at org.springframework.aop.interceptor.ExposeInvocationInterceptor.invoke(ExposeInvocationInterceptor.java:93) ~[spring-aop-5.1.6.RELEASE.jar!/:5.1.6.RELEASE]
	at org.springframework.aop.framework.ReflectiveMethodInvocation.proceed(ReflectiveMethodInvocation.java:186) ~[spring-aop-5.1.6.RELEASE.jar!/:5.1.6.RELEASE]
	at org.springframework.aop.framework.CglibAopProxy$DynamicAdvisedInterceptor.intercept(CglibAopProxy.java:688) ~[spring-aop-5.1.6.RELEASE.jar!/:5.1.6.RELEASE]
	at cn.demowalk.ocean.manage.service.ApiApplicationResourceRefServiceImpl$$EnhancerBySpringCGLIB$$d06a391d.AppResourceRefService(<generated>) ~[ocean-service-manage-service-1.6.2-SNAPSHOT.jar!/:?]
日志中有业务查询代码,经过排查,并没确定原因。
2. 导出内存dump
- 用jps找出java程序的pid
jps - 用jmap导出dmup
jmap -dump:format=b,file=manage.dump pid
3.用mat分析dump
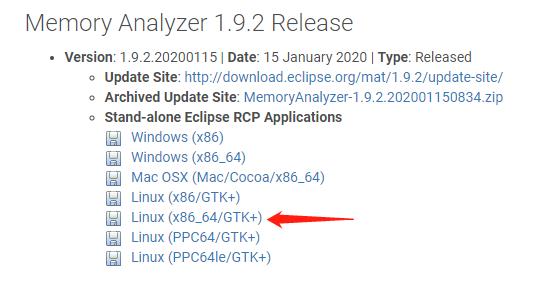
下载mat
http://www.eclipse.org/mat/previousReleases.php
最新版需要java11,此版本java1.8可用。建议linux版,放在服务器运行,因为dump日志太大,传输困难,且win内存一般不够。
配置mat
解压后的目录
configuration epl-v10.html features MemoryAnalyzer MemoryAnalyzer.ini notice.html p2 ParseHeapDump.sh plugins workspace
MemoryAnalyzer.ini --配置文件
workspace – 工作目录,dump文件可以放到这里
修改mat的内存配置:
vim MemoryAnalyzer.ini
将xmx设置为dump大小的2倍
运行mat
./ParseHeapDump.sh workspace/manage.dump org.eclipse.mat.api:suspects org.eclipse.mat.api:overview org.eclipse.mat.api:top_components
分析比较耗时,也比较耗内存,分析完毕后,workspace目录里会生成很多文件:
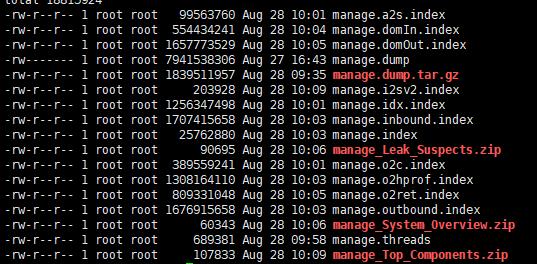
我们只需要三个zip包,导出到win,然后分别解压到文件夹
4. 分析
打开manage_Leak_Suspects/toc.html
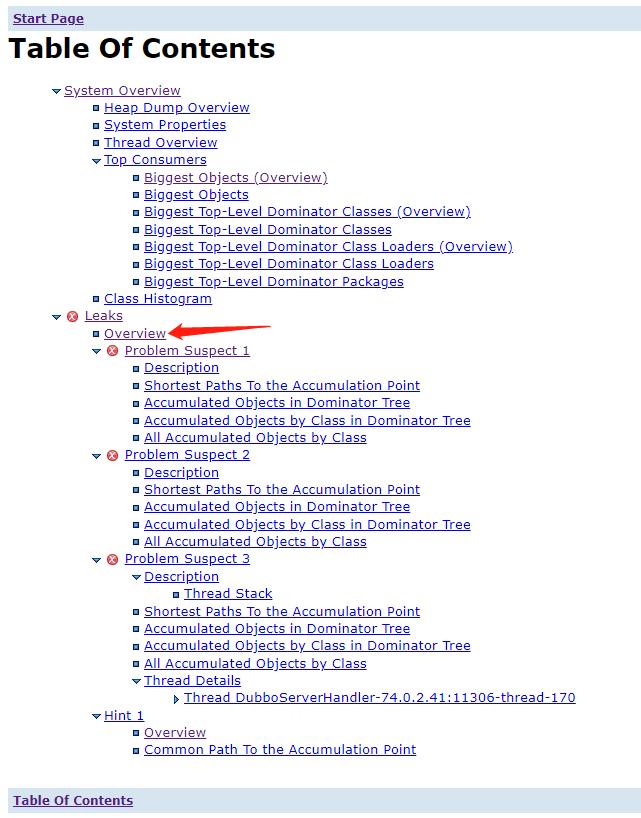
找到leaks(内存泄漏)的overview,发现有3个内存泄漏点。
第一个,PgResultSet,表示pgsql查询封装的对象,可以判断是有大数据量的pgsql查询导致的,但具体哪个查询,看不出来。
第二个,如同第一个。
第三个,看到是dubbo threadLocal相关的,但下面有个栈信息,see stacktrace,可以打开看看

打开see stacktrace,看到了cn包的业务代码信息:
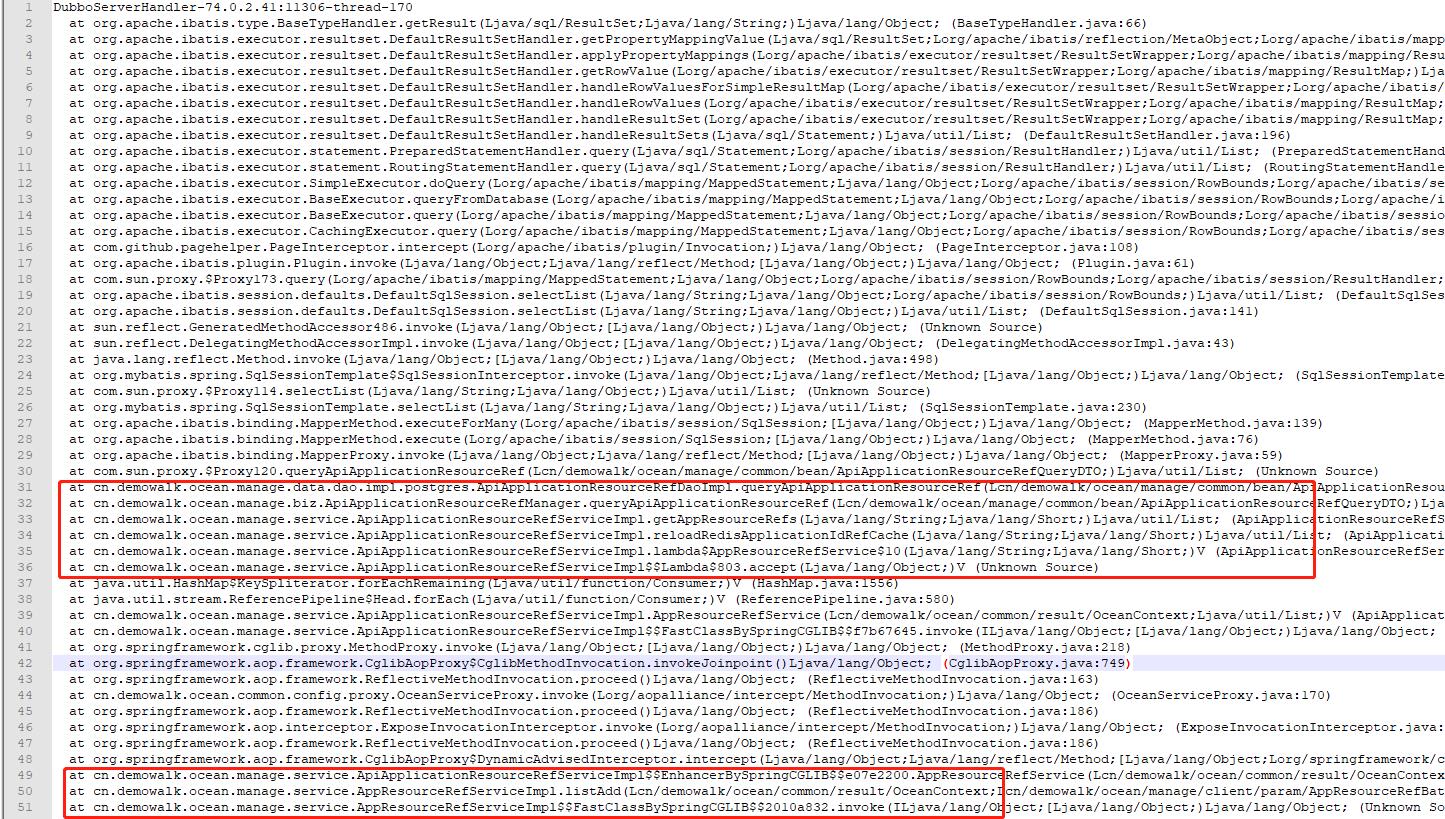
经过核对源码,发现此处进行了多层嵌套的for循环进行缓存加载,底层for循环进行了pgsql数据库操作,产生的每条数据,又set进redis。因为数据库量大,redis出现连接超时,导致整个操作耗时较大,内存无法及时回收。
更过分的是,其他线程从redis查询无果,会循环调用上面步骤进行缓存更新,第一次没更新完毕,第二次又来了。。。陷入僵局,内存无法及时回收,cpu也过高。
5. 解决方案
1.嵌套for循环,改为批量查询。
2.redis循环set 操作,改为pip管道方式的批量新增.
3. redis 循环get操作,改为管道批量查询。
4. 缓存为空时,使用synchronized+双重检查验证的方式进行更新,避免多个线程同时更新缓存。
以上是关于频繁GC导致OOM内存溢出的问题排查的主要内容,如果未能解决你的问题,请参考以下文章