孤立森林IsolationForest_异常检测
Posted hellobigorange
tags:
篇首语:本文由小常识网(cha138.com)小编为大家整理,主要介绍了孤立森林IsolationForest_异常检测相关的知识,希望对你有一定的参考价值。
1、孤立森林理论简介
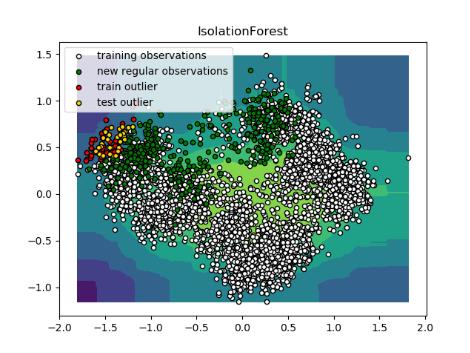
理解:最早被树分离出去(树的长度最短)的数据点,可能为异常点。
2、应用:
- 可以无监督学习,检测异常样本。
- 回归问题中,可以对输出进行异常检测,并去掉这些异常数据,从而提高预测准确率
3、注意:
不需要标准化,不需要PCA降维
4、关键参数
- max_samples=30 估计器的数量,(默认值= 100)
- random_state=rng, rng = np.random.RandomState(30)保证代码的可复现性,便于调试
- contamination=0.1 异常样本占总样本的比例为0.1
python实例
import requests
import matplotlib.pyplot as plt
from sklearn.ensemble import IsolationForest
import numpy as np
from sklearn import preprocessing
from sklearn.decomposition import PCA

BIGDATA_DOMAIN = 'http://bigdata-platapi.fnwintranet.com'
BIGDATA_USERKEY = "a95c34cf34deb5a2d0af84f3aea2a616_algorithm-engine-flask"
# "EMS.HZ",
EQUIP_MK_NAME = [
                 "EMS.Pa", "EMS.Pb", "EMS.Pc", "EMS.P", "EMS.S", "EMS.Q",
                 "EMS.Ua", "EMS.Ub", "EMS.Uc", "EMS.Uac", "EMS.Ubc", "EMS.Uab",
                 "EMS.Ia", "EMS.Ib", "EMS.Ic",
                 "EMS.COSa", "EMS.COSb", "EMS.COSc", "EMS.COS",
                 "EMS.CHDphAT", "EMS.CHDphBT", "EMS.CHDphCT",
                 "EMS.VHDphAT", "EMS.VHDphBT", "EMS.VHDphCT", "EMS.VdisPer", "EMS.VHDlineBC", "EMS.VHDlineAC",
                 "EMS.VHDlineAB",
                 "EMS.HZ",
                 "EMS.TphC", "EMS.TphA", "EMS.TphB", "EMS.TphN"
                 ]


def get_iv_data(startTime, endTime, equip_id, station_id, equip_mk, EQUIP_MK_NAME):
    tags = {
        "equipID": equip_id,
        "equipMK": equip_mk,
        "staId": station_id
    }

    d = {
        "dataSource": "EMS",
        "isClean": False,
        "listQueries": [
            {
                "aggregator": "first",
                "downsample": "1d-first-null",
                "explicitTags": True,
                "metric": i,
                "tags": tags
            } for i in EQUIP_MK_NAME],
        "startTime": startTime,
        "endTime": endTime,
        "userKey": BIGDATA_USERKEY
    }

    url = BIGDATA_DOMAIN + '/internal/bigdata/time_series/get_history'
    r = requests.post(url, json=d)
    return r.json()


import time
import pandas as pd


def iv_data_process(iv_data, EQUIP_MK_NAME):
    l_data = []  # 测点值Series列表
    l_name = []
    for i in range(len(iv_data['data'])):
        data = pd.Series(iv_data['data'][i]['dps'])
        name = iv_data['data'][i]['metric']
        l_data.append(data)
        l_name.append(name)
    data = pd.concat(l_data, axis=1)
    data.columns = l_name
    data.index = map(lambda x: time.strftime("%Y-%m-%d %H:%M:%S", time.localtime(int(x))), data.index)  # 将时间戳变为datetime
    data.sort_index(inplace=True)  # 按照index排序
    data = data.dropna()
    return data


def my_isolationForest(X_train, X_test):
    # fit the model
    rng = np.random.RandomState(30)
    clf = IsolationForest(max_samples=30,
                          random_state=rng, contamination=0)
    clf.fit(X_train)
    y_pred_train = clf.predict(X_train)
    y_pred_test = clf.predict(X_test)
    y_pred_test_decision_function = clf.decision_function(X_test)
    y_pred_train_decision_function = clf.decision_function(X_train)
    return y_pred_train, y_pred_test, clf, y_pred_test_decision_function, y_pred_train_decision_function


# "IsolationForest"
def plot_visualization(clf, title, X_train, X_test, EQUIP_MK_NAME):
    xx, yy = np.meshgrid(np.linspace(data[EQUIP_MK_NAME[0]].min(), data[EQUIP_MK_NAME[0]].max(), 100),
                         np.linspace(data[EQUIP_MK_NAME[1]].min(), data[EQUIP_MK_NAME[1]].max(), 100))
    Z = clf.decision_function(np.c_[xx.ravel(), yy.ravel()])
    Z = Z.reshape(xx.shape)
    plt.title(title)
    plt.contourf(xx, yy, Z, camp=plt.cm.Blues_r)
    b1 = plt.scatter(X_train[:, 0], X_train[:, 1], c='white',
                     s=20, edgecolor='k')
    b2 = plt.scatter(X_test[:, 0], X_test[:, 1], c='green',
                     s=20, edgecolor='k')
    for i in range(len(X_train)):
        if y_pred_train[i] == -1:
            b3 = plt.scatter(X_train[i, 0], X_train[i, 1], c='red',
                             s=20, edgecolor='k')
    for i in range(len(X_test)):
        if y_pred_test[i] == -1:
            b4 = plt.scatter(X_test[i, 0], X_test[i, 1], c='gold',
                             s=20, edgecolor='k')

    plt.axis('tight')
    plt.legend([b1, b2],
               ["training observations",
                "new regular observations", "train outlier", "test outlier"])
    plt.show()
    return Z, np.c_[xx.ravel(), yy.ravel()]


if __name__ == '__main__':
    param = {"equipID": "METE01",
             "equipMK": "METE",
             "staId": "PARK801_EMS01",
             "startTime": "2020-09-01 00:00:00",
             "endTime": "2021-08-20 23:59:00",
             }
    equipID = param['equipID']
    equipMK = param['equipMK']
    staId = param['staId']
    startTime = param['startTime']
    endTime = param['endTime']
    iv_data = get_iv_data(startTime, endTime, equipID, staId, equipMK, EQUIP_MK_NAME)
    data = iv_data_process(iv_data, EQUIP_MK_NAME)
    # data = normalize_data(data)
    # data = pca_process_data(data)
    # # 训练集和测试集
    X_train = data.loc[startTime:"2021-08-18 00:00:00"].values
    X_test = data.loc["2021-08-18 00:15:00":endTime].values

    y_pred_train, y_pred_test, clf, y_pred_test_decision_function, y_pred_train_decision_function = my_isolationForest(
        X_train, X_test)

    y_result = np.concatenate((y_pred_train.reshape(1, len(y_pred_train)), y_pred_test.reshape(1, len(y_pred_test))),
                              axis=1)
    y_result = pd.DataFrame(y_result.reshape(len(y_result[0]), 1), index=data.index)
    X_test_data = pd.merge(data, y_result, left_index=True, right_index=True, how='outer')

    # # 将输出结果和输入特征进行拼接

    # title = "IsolationForest"
    # Z, Z_feature = plot_visualization(clf, title, X_train, X_test, ['feature_1', 'feature_2'])

    # # 创建一个随机数序列,来查看异常检测的效果
    # X_test_random = np.random.randint(1, 100, [10, 2])  # 预测结果为[-1 -1 -1 -1 -1 -1 -1 -1 -1 -1]
    # Y_pred_random = clf.predict(X_test_random)

    # 拼接上决策得分
    y_score = np.concatenate((y_pred_train_decision_function.reshape(1, len(y_pred_train_decision_function)),
                              y_pred_test_decision_function.reshape(1, len(y_pred_test_decision_function))), axis=1)
    y_score = pd.DataFrame(y_score.reshape(len(y_score[0]), 1), index=data.index, columns=['score'])
    X_test_data = pd.merge(X_test_data, y_score, left_index=True, right_index=True, how='outer')
    plt.plot(X_test_data['score'])
    plt.show()


以上是关于孤立森林IsolationForest_异常检测的主要内容,如果未能解决你的问题,请参考以下文章
异常检测概念异常检测的思路孤立森林Isolation Forest局部异常因子LOFOneClassSVMEllipticEnvelop