使用KMeanCluster对多个区域进行聚类,并结合Matplotlib绘制中心点最大最小距离点
Posted 程序媛一枚~
tags:
篇首语:本文由小常识网(cha138.com)小编为大家整理,主要介绍了使用KMeanCluster对多个区域进行聚类,并结合Matplotlib绘制中心点最大最小距离点相关的知识,希望对你有一定的参考价值。
使用KMeanCluster对多个区域进行聚类,并结合Matplotlib绘制中心点、最大最小距离点
这篇博客将演示如何使用KMeansCluster对多个区域进行聚类,并结合Matplotlib绘制中心点、最大最小区域的点。
写这篇博客源于博友的提问:期望能解决疫情防控应急服务点选址问题。
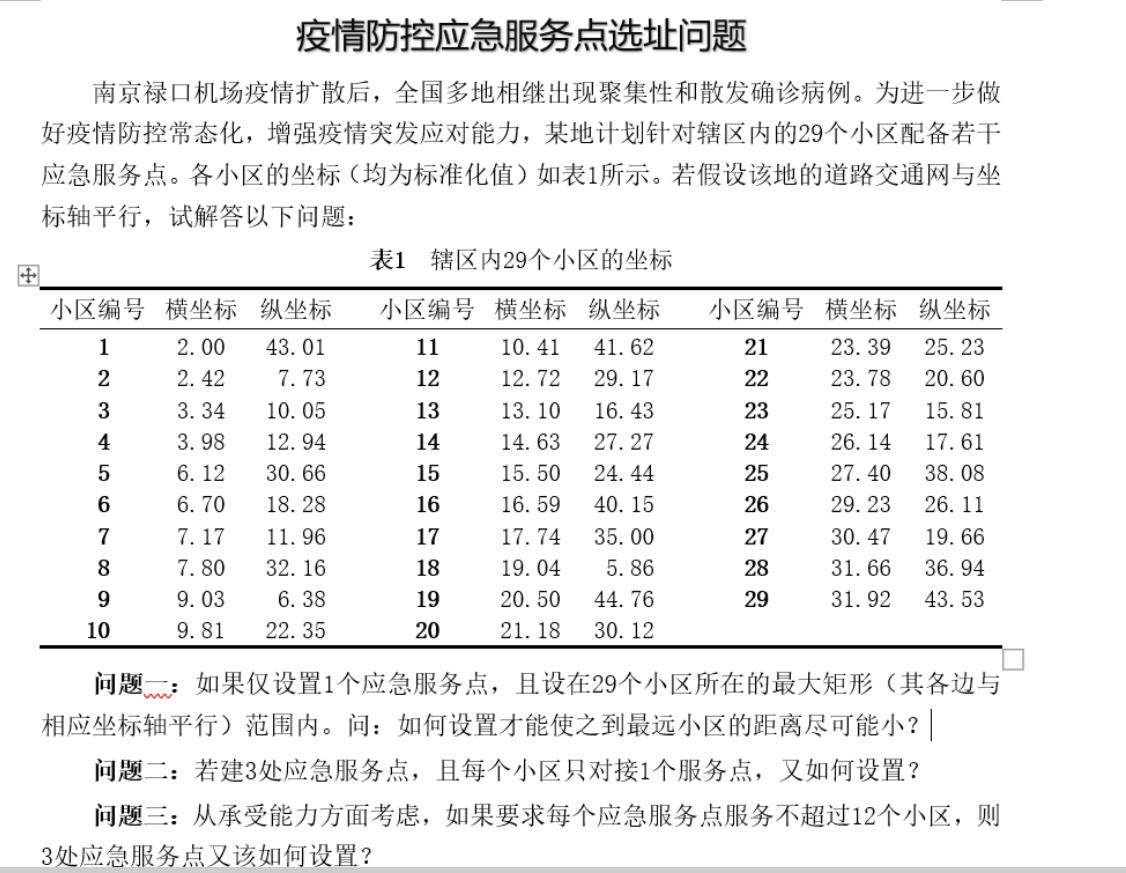
1. 效果图
聚类1效果图如下:
29个小区分别对应29个点,方形对应中心点,三角对应距离中心最近的小区,五角星对应距离中心最远的小区
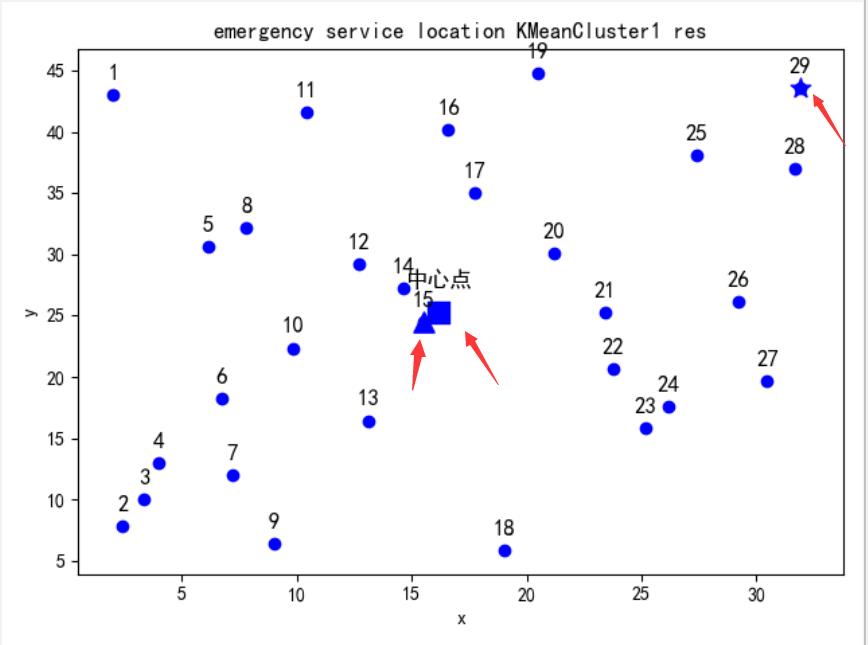
聚类2效果图如下:
可以看到29个小区聚类为 蓝色圆点、绿色圆点2类。
其中蓝色三角、蓝色方形、蓝色五角星分别对应蓝色聚类的最小、中心、最大小区。
其中绿色三角、绿色方形、绿色五角星分别对应绿色聚类的最小、中心、最大小区。
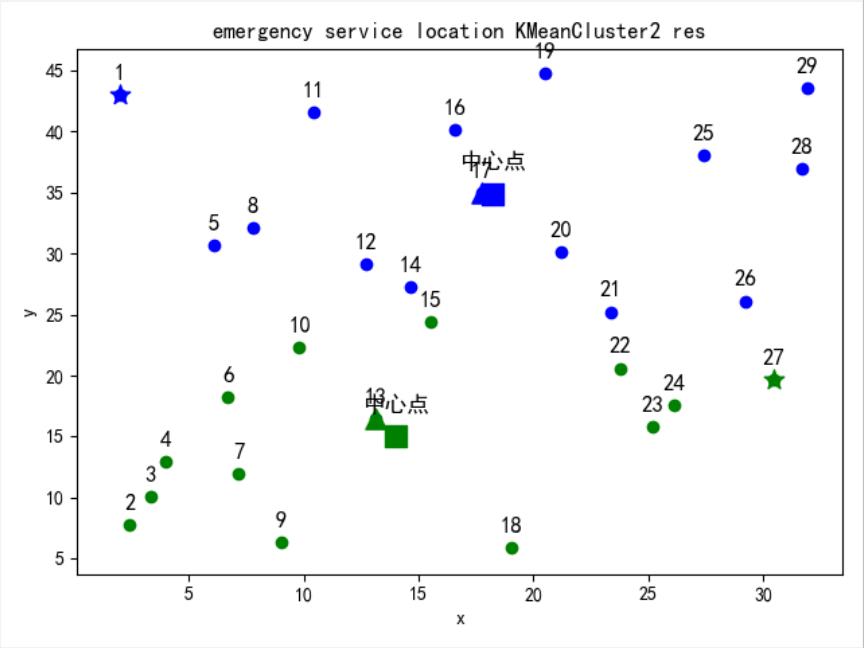
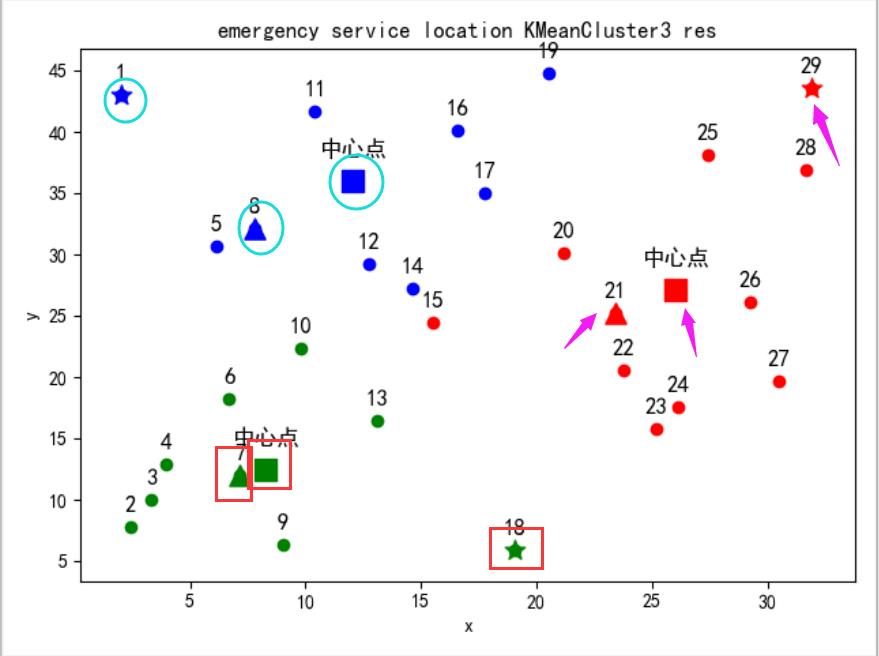
聚类3效果图如下:
可以看到29个小区聚类为 蓝色圆点、绿色圆点、红色圆点3类。
其中蓝色三角、蓝色方形、蓝色五角星分别对应蓝色聚类的最小、中心、最大小区。
其中绿色三角、绿色方形、绿色五角星分别对应绿色聚类的最小、中心、最大小区。
其中红色三角、红色方形、红色五角星分别对应红色聚类的最小、中心、最大小区。
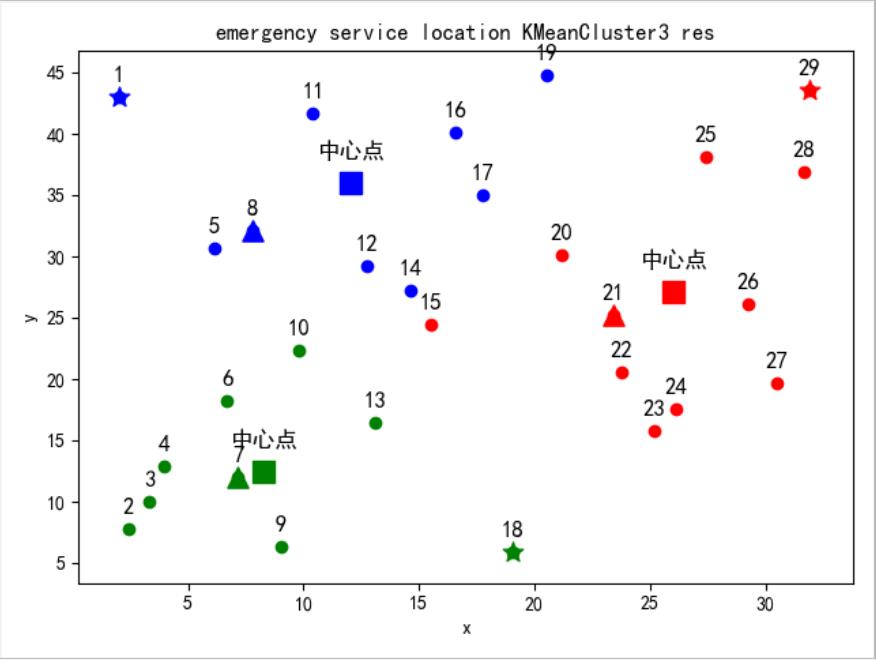
2. 源码
2.1 原始数据——xq.txt
1 2.00 43.01 11 10.41 41.62 21 23.39 25.23
2 2.42 7.78 12 12.72 29.17 22 23.78 20.60
3 3.34 10.05 13 13.10 16.43 23 25.17 15.81
4 3.98 12.94 14 14.63 27.27 24 26.14 17.61
5 6.12 30.66 15 15.50 24.44 25 27.40 38.08
6 6.70 18.28 16 16.59 40.15 26 29.23 26.11
7 7.17 11.96 17 17.74 35.00 27 30.47 19.66
8 7.80 32.16 18 19.04 5.86 28 31.66 36.94
9 9.03 6.38 19 20.50 44.76 29 31.92 43.53
10 9.81 22.35 20 21.18 30.12
2.2 源码
# 根据Kmeans聚类,并绘制中心点、最近点、最远点
import cv2
from pylab import *


# 读取原始数据
def get_points():
    with open("maps/xq.txt", "r") as f:  # 打开文件
        str = f.read()  # 读取文件
        str = str.replace("\\n", " ")
        strs = np.array(str.split(" "))
        data = np.array([float(x) for x in strs]).reshape(29, 3)

    # 根据第1列排序(保证小区是从1~29)
    data = data[data[:, 0].argsort()]
    return data


# 计算俩点之间的值(此处没有考虑地球🌏是球体)
def get_distance(pt1, pt2):
    return math.sqrt(math.pow(pt1[0] - pt2[0], 2) + math.pow(pt1[1] - pt2[1], 2))


# 获取最近、最远距离的小区(最近的小区绘制三角形,最远的小区绘制五角星)
# center:中心点
# data: 聚类数据
# color:颜色
def get_most_distance(center, data, color, flag=False):
    dis = []
    for i in data:
        dis.append(get_distance(center, [i[0], i[1]]))
    # print(dis)
    # print("min: ", min(dis), dis.index(min(dis)), data[dis.index(min(dis))])
    # print("max: ", max(dis), dis.index(max(dis)), data[dis.index(max(dis))])
    minIndex = dis.index(min(dis))
    maxIndex = dis.index(max(dis))
    # print(data[minIndex, 0], data[minIndex, 1])
    # print(data[maxIndex, 0], data[maxIndex, 1])
    plt.scatter(data[minIndex, 0], data[minIndex, 1], s=120, c=color, marker='^')
    plt.scatter(data[maxIndex, 0], data[maxIndex, 1], s=120, c=color, marker='*')
    if flag:
        return dis.index(min(dis)) + 1
    return dis.index(max(dis)) + 1


# 对原始数据进行聚类,聚成 n 类,默认只聚类1堆
def k_means_cluster(data, n=1):
    Z = data[:, 1:]  # 获取小区坐标数据,第一列是小区,第2列横坐标,第3列纵坐标
    # 转换为 np.float32
    Z = np.float32(Z)

    # 定义终止准则以及应用KMeans聚类
    criteria = (cv2.TERM_CRITERIA_EPS + cv2.TERM_CRITERIA_MAX_ITER, 10, 1.0)
    ret, label, centers = cv2.kmeans(Z, n, None, criteria, 10, cv2.KMEANS_RANDOM_CENTERS)
    print('Kmeanscluster (', n, ') —— center: ', centers)

    # 解决中文问题
    mpl.rcParams['font.sans-serif'] = ['SimHei']
    mpl.rcParams['axes.unicode_minus'] = False

    # ‘b’ blue 蓝色
    # ‘g’ green 绿色
    # ‘r’ red 红色
    # ‘c’ cyan 兰青色
    # ‘m’ magenta 紫色
    # ‘y’ yellow 黄色
    # ‘k’ black 黑色
    # ‘w’ white 白色
    # n类,构建n个颜色
    color_arr = np.array(['b', 'g', 'r', 'c', 'm', 'y', 'k', 'w'])
    colors = color_arr[:n]

    # 给每个点添加小区编码
    for x, y, zone in zip(data[:, 1], data[:, 2], data[:, 0]):  # zip函数将x,y,小区数据一一对应,配对组合
        plt.text(x, y + 1, '%s' % int(zone), ha='center', va='bottom', fontdict={'color': 'black',
                                                                                 'weight': 'bold',
                                                                                 'size': 12})  # 增加标签

    # 根据聚类label遍历数据,及绘制数据
    # 绘制分类点为圆形,中心点为方形,最小距离小区为三角,最大距离小区为五角星
    for i, (color, center) in enumerate(zip(colors, centers)):
        A = Z[label.ravel() == i]
        # print('cluster ', i, ' : ', len(A), ' ', A)
        print('cluster ', i, ' : ', len(A))
        # 绘制数据
        plt.scatter(A[:, 0], A[:, 1], c=color)

        # 绘制中心点及其上的中心点文本
        plt.scatter(center[0], center[1], s=120, c=color, marker='s')
        plt.text(x=center[0], y=center[1] + 2, s='中心点', ha='center', va='baseline', fontdict={'color': 'black',
                                                                                              'weight': 'bold',
                                                                                              'size': 12})  # 中心点上方文字
        # 获取距离最大小区、最小小区,并绘制最大值三角,最小值五角星
        get_most_distance(center, A, color, plt)

    plt.xlabel('x'), plt.ylabel('y')
    plt.title("emergency service location KMeanCluster" + str(n) + " res")
    plt.show()


data = get_points()
# 分别聚类1,2,3
k_means_cluster(data, 1)
k_means_cluster(data, 2)
k_means_cluster(data, 3)
参考
以上是关于使用KMeanCluster对多个区域进行聚类,并结合Matplotlib绘制中心点最大最小距离点的主要内容,如果未能解决你的问题,请参考以下文章