CV案例:应用Keras SSD进行物体检测
Posted ZSYL
tags:
篇首语:本文由小常识网(cha138.com)小编为大家整理,主要介绍了CV案例:应用Keras SSD进行物体检测相关的知识,希望对你有一定的参考价值。
案例:SSD进行物体检测
1. 案例效果
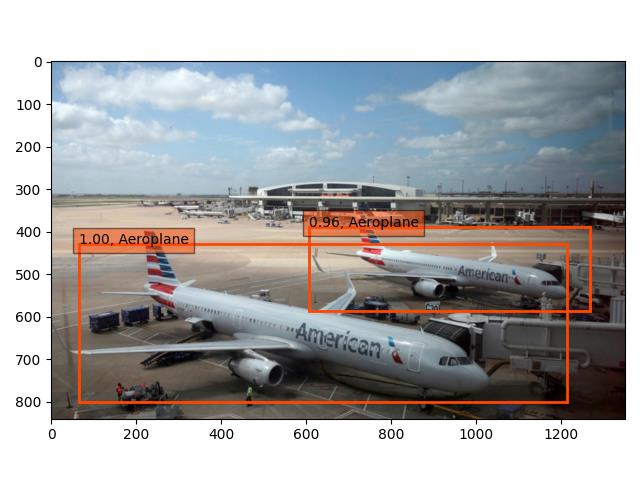
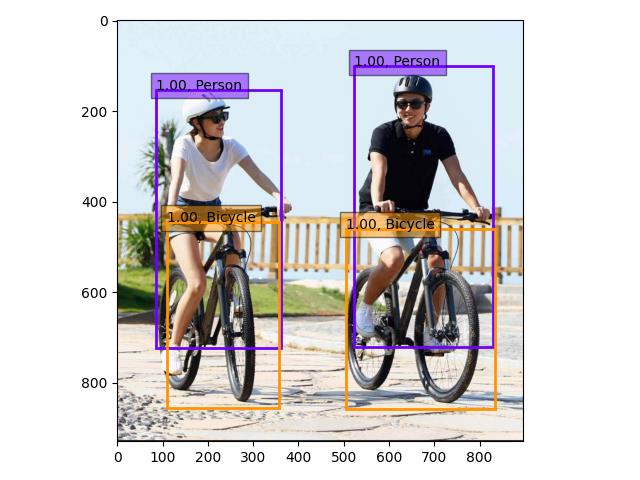
我们使用已经训练过的模型进行加载之后,总共基础训练时有动物、载具等等共20个物体类别的训练集。
以下是对没有训练过的图像的检测结果:


2. 案例需求
使用开源的SSD网络结构进行检测的是的代码编写,由于开源代码使用 keras 编写,没有tf.keras版本,需要下载 keras-1.2.2 包
pip install keras==1.2.2
- 使用SSD网络模型,输入图片数据,处理图片数据
- 得到预测的类别和预测的位置
- 在图片中显示出来
3. 步骤分析以及代码
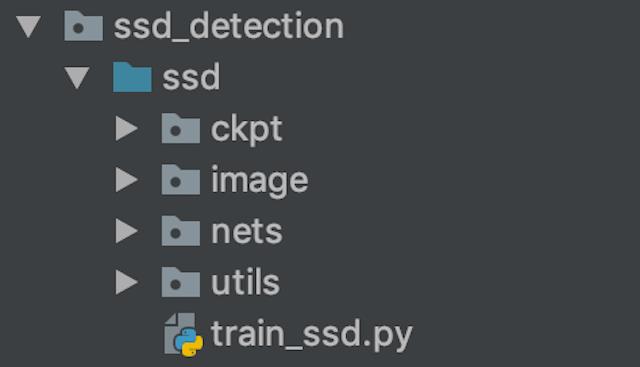
- 代码结构:
- ckpt:模型参数保存目录
- image:测试图片
- nets:模型网络路径
- utils:公共组件(模型工具,BBox处理)
- 定义好类别数量以及输出
class SSDTrain(object):

    def __init__(self):

        self.classes_name = ['Aeroplane', 'Bicycle', 'Bird', 'Boat', 'Bottle',
                               'Bus', 'Car', 'Cat', 'Chair', 'Cow', 'Diningtable',
                               'Dog', 'Horse', 'Motorbike', 'Person', 'Pottedplant',
                               'Sheep', 'Sofa', 'Train', 'Tvmonitor']

        self.classes_nums = len(self.classes_name) + 1
        self.input_shape = (300, 300, 3)
3.1 模型预测流程
-
SSD300模型输入以及加载参数
-
读取多个本地路径测试图片,preprocess_input以及保存图像像素值(显示需要)
-
模型预测结果,得到7308个priorbox
-
进行非最大抑制算法处理
-
SSD300模型输入以及加载参数
-
by_name:按照每一层名字进行填充参数
-
If `by_name` is True, weights are loaded into layers
only if they share the same name. This is useful
for fine-tuning or transfer-learning models where
some of the layers have changed.
-
model = SSD300(self.input_shape, num_classes=self.classes_nums)

model.load_weights('./ckpt/weights_SSD300.hdf5', by_name=True)
- 读取多个本地路径测试图片,preprocess_input以及保存图像像素值(显示需要)
需要使用
from keras.applications.imagenet_utils import preprocess_input
from keras.preprocessing.image import load_img, img_to_array

from scipy.misc import imread
import os

from nets.ssd_net import SSD300
from utils.ssd_utils import BBoxUtility
代码:
# 循环读取图片进行多个图片输出检测
feature = []
images = []
for pic_name in os.listdir("./image/"):
    img_path = os.path.join("./image/", pic_name)
    print(img_path)
    # 读取图片
    # 转换成数组
    # 模型输入
    img = load_img(img_path, target_size=(self.input_shape[0], self.input_shape[1]))
    img = img_to_array(img)
    feature.append(img)

    images.append(imread(img_path))
    # 处理图片数据,ndarray数组输入
    inputs = preprocess_input(np.array(feature))
- 模型预测结果,得到priorbox
# 预测
preds = model.predict(inputs, batch_size=1, verbose=1)
- 进行非最大抑制算法处理
# 定义BBox工具
bbox_util = BBoxUtility(self.classes_nums)
# 使用非最大抑制算法过滤
results = bbox_util.detection_out(preds)
print(results[0].shape, results[1].shape)
3.2 图片的检测结果显示
需要下载图像显示库
pip install matplotlib
-
对结果进行标记
- 对每张图片的中的物体的6个信息进行获取
-
1、先获取每张图片6列中的结果
for i, img in enumerate(images_data):

    # 通过i获取图片label, location, xmin, ymin, xmax, ymax
    pre_label = outputs[i][:, 0]
    pre_conf = outputs[i][:, 1]
    pre_xmin = outputs[i][:, 2]
    pre_ymin = outputs[i][:, 3]
    pre_xmax = outputs[i][:, 4]
    pre_ymax = outputs[i][:, 5]
    print("label:{}, probability:{}, xmin:{}, ymin:{}, xmax:{}, ymax:{}".
                  format(pre_label, pre_conf, pre_xmin, pre_ymin, pre_xmax, pre_ymax))
- 2、过滤预测框到指定类别的概率小的 prior box
top_indices = [i for i, conf in enumerate(pre_conf) if conf >= 0.6]
top_conf = pre_conf[top_indices]
top_label_indices = pre_label[top_indices].tolist()
top_xmin = pre_xmin[top_indices]
top_ymin = pre_ymin[top_indices]
top_xmax = pre_xmax[top_indices]
top_ymax = pre_ymax[top_indices]

# print("pre_label:{}, pre_loc:{}, pre_xmin:{}, pre_ymin:{},pre_xmax:{},pre_ymax:{}".
            #       format(tag_label, tag_loc, tag_xmin, tag_ymin, tag_xmax, tag_ymax))
对结果进行标记-完整代码:
def tag_picture(self, images, results):
     """
     对图片预测结果画图显示
     :param images:
     :param results:
     :return:
     """

     for i, img in enumerate(images):
         # 解析输出结果,每张图片的标签,置信度和位置
         pre_label = results[i][:, 0]
         pre_conf = results[i][:, 1]
         pre_xmin = results[i][:, 2]
         pre_ymin = results[i][:, 3]
         pre_xmax = results[i][:, 4]
         pre_ymax = results[i][:, 5]
         print("label:{}, probability:{}, xmin:{}, ymin:{}, xmax:{}, ymax:{}".
               format(pre_label, pre_conf, pre_xmin, pre_ymin, pre_xmax, pre_ymax))

         # 过滤置信度低的结果
         top_indices = [i for i, conf in enumerate(pre_conf) if conf >= 0.6]
         top_conf = pre_conf[top_indices]
         top_label_indices = pre_label[top_indices].tolist()
         top_xmin = pre_xmin[top_indices]
         top_ymin = pre_ymin[top_indices]
         top_xmax = pre_xmax[top_indices]
         top_ymax = pre_ymax[top_indices]

         # 定义21中颜色,显示图片
         # currentAxis增加图中文本显示和标记显示
         colors = plt.cm.hsv(np.linspace(0, 1, 21)).tolist()
         plt.imshow(img / 255.)
         currentAxis = plt.gca()

         for i in range(top_conf.shape[0]):
             xmin = int(round(top_xmin[i] * img.shape[1]))
             ymin = int(round(top_ymin[i] * img.shape[0]))
             xmax = int(round(top_xmax[i] * img.shape[1]))
             ymax = int(round(top_ymax[i] * img.shape[0]))

             # 获取该图片预测概率,名称,定义显示颜色
             score = top_conf[i]
             label = int(top_label_indices[i])
             label_name = self.classes_name[label - 1]
             display_txt = '{:0.2f}, {}'.format(score, label_name)
             coords = (xmin, ymin), xmax - xmin + 1, ymax - ymin + 1
             color = colors[label]
             # 显示方框
             currentAxis.add_patch(plt.Rectangle(*coords, fill=False, edgecolor=color, linewidth=2))
             # 左上角显示概率以及名称
             currentAxis.text(xmin, ymin, display_txt, bbox={'facecolor': color, 'alpha': 0.5})

         plt.show()
4. 完整代码
"""SSD物体检测案例"""
from computerVision.nets.ssd_net import SSD300
from computerVision.utils.ssd_utils import BBoxUtility
from tensorflow.python.keras.preprocessing.image import load_img, img_to_array
from tensorflow.python.keras.applications.imagenet_utils import preprocess_input
import matplotlib.pyplot as plt
from imageio import imread
import numpy as np
import os
"""
- 定义好类别数量以及输出
- 模型预测流程
  - SSD300模型输入以及加载参数
  - 读取多个本地路径测试图片,preprocess_input以及保存图像像素值(显示需要)
  - 模型预测结果,得到7308个priorbox
  - 进行非最大抑制算法处理
- 图片的预测结果显示
"""

class SSDTest(object):
    def __init__(self):
        # 定义识别类别
        self.classes_name = ['Aeroplane', 'Bicycle', 'Bird', 'Boat', 'Bottle',
                             'Bus', 'Car', 'Cat', 'Chair', 'Cow', 'Diningtable',
                             'Dog', 'Horse', 'Motorbike', 'Person', 'Pottedplant',
                             'Sheep', 'Sofa', 'Train', 'Tvmonitor']

        # 定义模型的输入参数 + 1 背景
        self.classes_nums = len(self.classes_name) + 1
        self.input_shape = (300, 300, 3)

    def test(self):
        """
        对于输入图片进行预测物体位置
        :return:
        """
        # - SSD300模型输入以及加载参数
        model = SSD300(self.input_shape, num_classes=self.classes_nums)
        model.load_weights('./ckpt/weights_SSD300.hdf5', by_name=True)  # 按照名字加载参数
        # 模型特征
        feature = []
        images_data = []
        # - 读取多个本地路径测试图片,preprocess_input以及保存图像像素值(显示需要)
        for path in os.listdir('./images'):
            img_path = os.path.join('./images/', path)
            # 1. 输入到SSD网络中,数组
            image = load_img(img_path, target_size=(self.input_shape[0], self.input_shape[1]))
            image = img_to_array(image)

            feature.append(image)
            # 2. 读取图片二进制数据,matplotlib显示使用
            images_data.append(imread(img_path))

        # - 模型预测结果,得到7308个priorbox
        # 图片特征处理
        inputs = preprocess_input(np.asarray(feature))
        # print(inputs)
        predict = model.predict(inputs)
        # (2, 7308, 33) 2代表图片数量,7308代表每个图片预测的default boxes数量,33: 4(位置)+ 21(预测概率) + 8(其他default boxes参数)
        print(predict.shape)

        # - 进行非最大抑制算法处理NMS 21类别
        bb = BBoxUtility(self.classes_nums)
        res = bb.detection_out(predict)  # 将图片解析格式
        # (200, 6) (200, 6)
        print(res[0].shape, res[1].shape)
        # 200个候选框,每个候选框位置,类别

        return res, images_data

    def tag_picture(self, images_data, outputs):
        """
        显示预测结果到图片中
        :return:
        """
        # 1. 获取每张图片的预测结果中的值
        for i, img in enumerate(images_data):
            # 获取res当中对应的记过label,location,xmin,ymin,xmax,ymax
            pre_label = outputs[i][:, 0]
            pre_conf = outputs[i][:, 1]
            pre_xmin = outputs[i][:, 2]
            pre_ymin = outputs[i][:, 3]
            pre_xmax = outputs[i][:, 4]
            pre_ymax = outputs[i][:, 5]

            # print('pre_label:{}, pre_conf:{}, pre_xmin:{}, pre_ymin:{}, pre_xmax:{}, pre_ymax:{}'.
            #       format(pre_label, pre_conf, pre_xmin, pre_ymin, pre_xmax, pre_ymax))

            # 由于检测出的物体还是很多,所以进行显示过滤(%90)
            top_indices = [i for i, conf in enumerate(pre_conf) if conf > 0.6]
            top_conf = pre_conf[top_indices]
            top_label_indices = pre_label[top_indices].tolist()
            top_xmin = pre_xmin[top_indices]
            top_ymin = pre_ymin[top_indices]
            top_xmax = pre_xmax[top_indices]
            top_ymax = pre_ymax[top_indices]

            print('after filter top_label_indices:{}, top_conf:{}, top_xmin:{}, top_ymin:{}, top_xmax:{}, top_ymax:{}'.
              format(top_label_indices, top_conf, top_xmin, top_ymin, top_xmax, top_ymax))

            # matplotlib画图显示结果
            # 定义21中颜色,显示图片
            # currentAxis增加图中文本显示和标记显示
            colors = plt.cm.hsv(np.linspace(0, 1, 21)).tolist()
            plt.imshow(img / 255.)
            currentAxis = plt.gca()

            for i in range(top_conf.shape[0]):
                xmin = int(round(top_xmin[i] * img.shape[1]))
                ymin = int(round(top_ymin[i] * img.shape[0]))
                xmax = int(round(top_xmax[i] * img.shape[1]))
                ymax = int(round(top_ymax[i] * img.shape[0]))

                # 获取图片预测概率,名称,定义显示颜色
                score = top_conf[i]
                label = int(top_label_indices[i])
                label_name = self.classes_name[label - 1]
                diplay_test = '{:0.2f}, {}'.format(score, label_name)
                coords = (xmin, ymin), xmax - xmin + 1, ymax - ymin + 1
                color = colors[label]
                # 显示方框
                currentAxis.add_patch(plt.Rectangle(*coords, fill=False, edgecolor=color, linewidth=2))
                # 左上角显示概率以及名称
                currentAxis.text(xmin, ymin, diplay_test, bbox={'facecolor': color, 'alpha': 0.5})

            plt.show()

        return None


if __name__ == '__main__':
    ssd = SSDTest()

    outputs, images_data = ssd.test()

    # 图片的预测结果显示
    ssd.tag_picture(images_data, outputs)
加油!
感谢!
努力!
以上是关于CV案例:应用Keras SSD进行物体检测的主要内容,如果未能解决你的问题,请参考以下文章