收藏第一课第二周作业-学会计算分类各种指标-超详细教程
Posted Tina姐
tags:
篇首语:本文由小常识网(cha138.com)小编为大家整理,主要介绍了收藏第一课第二周作业-学会计算分类各种指标-超详细教程相关的知识,希望对你有一定的参考价值。
本次作业文件:
在第一课/第一课大作业/week2metric
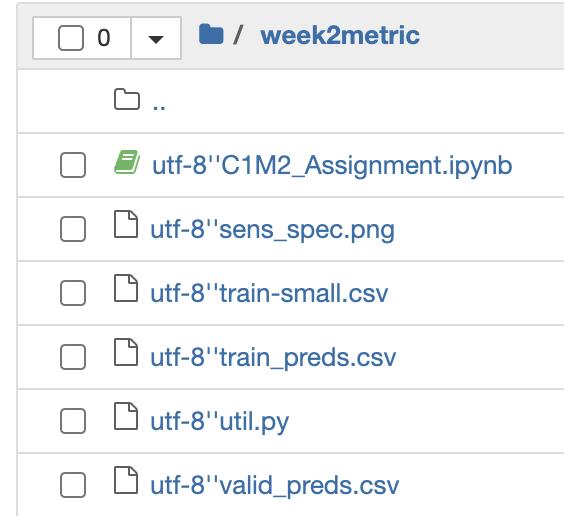
这节课不需要对模型进行预测,所有的预测结果已经在csv文件中给出。
作为提醒,我们的数据集包含14种不同情况的X射线,可通过X射线诊断。我们将使用我们在这一周中学习的分类指标来评估我们模型的表现。
作业目录
- Packages
- Overview
- Metrics
3.1 True Positives, False Positives, True Negatives, and False Negatives
3.2 Accuracy
3.3 Prevalence
3.4 Sensitivity and Specificity
3.5 PPV and NPV
3.6 ROC Curve - Confidence Intervals 置信区间
- Precision-Recall Curve
- F1 Score
- Calibration(校准)
注意: 在作业文件中,可以直接跳转到你感兴趣的章节。
你将学会一下内容:
- Accuracy
- Prevalence
- Specificity & Sensitivity
- PPV and NPV
- ROC curve and AUCROC (c-statistic)
- Confidence Intervals
1.3 从csv获得预测结果和真实标签
预测结果和真实标签存储在两个名为train_preds.CSV和valid_preds.CSV的CSV文件中。
train_results = pd.read_csv("train_preds.csv")
valid_results = pd.read_csv("valid_preds.csv")
可以查看一下csv文件的信息,使用 valid_results.info()
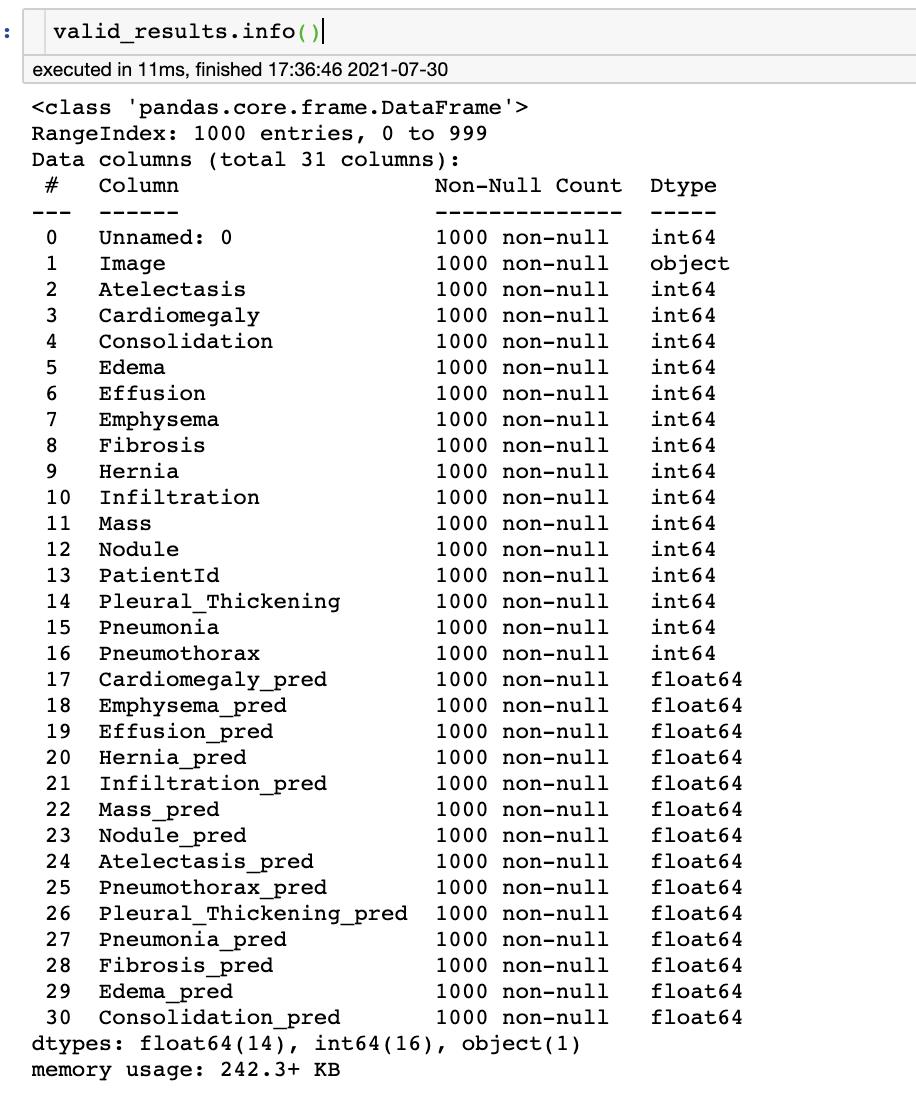
可以看到 该 csv 有 1000 行 31 列,以及每一列的名字和数据类型。
如 2-16列一共是14种疾病的真实标签值,17-30列是对应的预测值
因此,我们就可以获得这些示例的 标签 y 和 预测值 pred
y = valid_results[class_labels].values
pred = valid_results[pred_labels].values
1.4.1 真阳性、假阳性、真阴性和假阴性
从模型预测计算的最基本的统计数据是真阳性、真阴性、假阳性和假阴性。
顾名思义
真阳性(TP):模型将示例分类为阳性,实际标签也为阳性。
假阳性 (FP):模型将示例分类为正例,但实际标签为负例。
真阴性(TN):模型将示例分类为负,实际标签也为负。
假阴性(FN):模型将示例分类为阴性,但标签实际上是阳性。
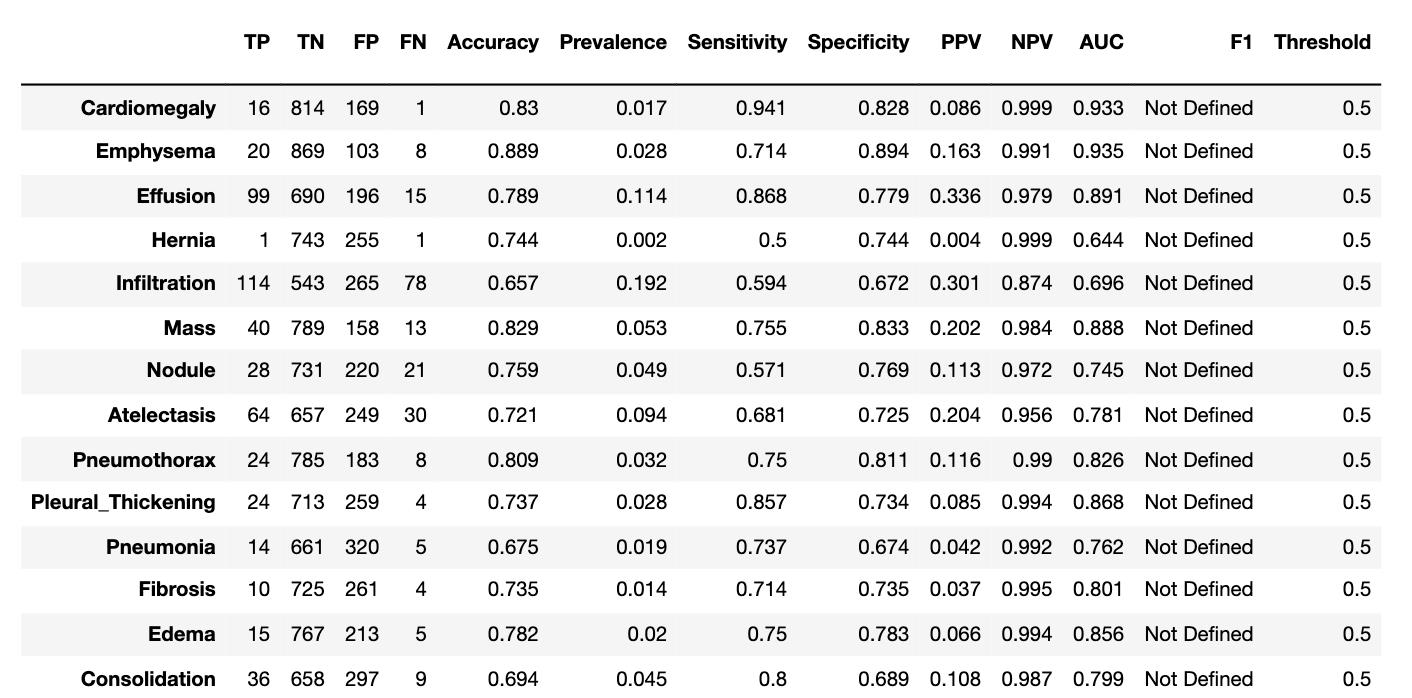
我们将计算给定数据中 TP、FP、TN 和 FN 的数量。我们所有的指标都可以建立在这四个统计数据之上。
回想一下,该模型输出 0-1 之间的实数。我们需要将它们转换为 0 或 1。我们将使用阈值 t h th th 来做到这一点.
- 模型的输出结果 > t h th th, 则 预测结果 pred = 1
- 模型的输出结果 < t h th th, 则 预测结果 pred = 0
我们所有的指标(最后的 AUC 除外)都将取决于此阈值的选择,阈值默认为0.5。
使用下面的函数分别计算 TP、FP、TN 和 FN
def true_positives(y, pred, th=0.5):
    TP = 0
    # get thresholded predictions
    thresholded_preds = pred >= th
    # compute TP
    TP = np.sum((y == 1) & (thresholded_preds == 1))
    return TP
def true_negatives(y, pred, th=0.5):
    TN = 0
    # get thresholded predictions
    thresholded_preds = pred >= th
    # compute TN
    TN = np.sum((y == 0) & (thresholded_preds == 0))
    return TN
def false_positives(y, pred, th=0.5):
    FP = 0
    # get thresholded predictions
    thresholded_preds = pred >= th
    # compute FP
    FP = np.sum((y == 0) & (thresholded_preds == 1))
    return FP
def false_negatives(y, pred, th=0.5):
    FN = 0
    # get thresholded predictions
    thresholded_preds = pred >= th
    # compute FN
    FN = np.sum((y == 1) & (thresholded_preds == 0))
    return FN
通过如下图可直观理解 TP、FP、TN 和 FN
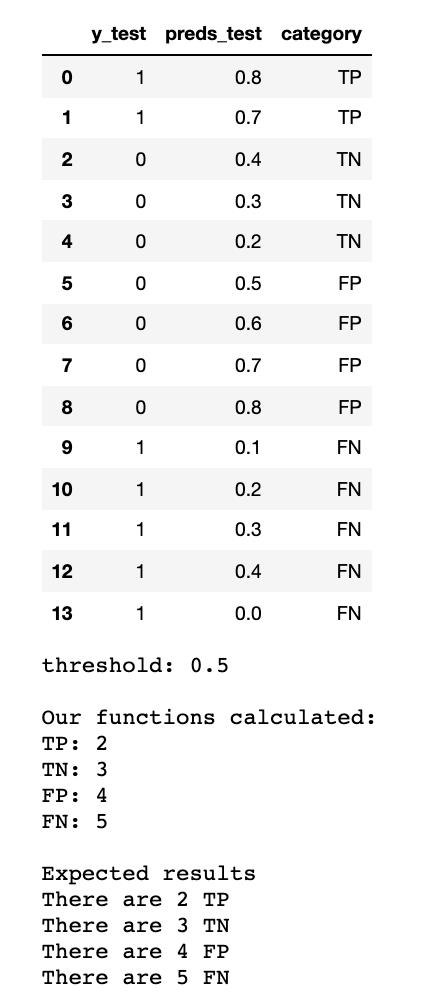
比如图上第一个值,preds_test=0.8 > 阈值0.5,则预测值为1。y_test=1,说明为TP。
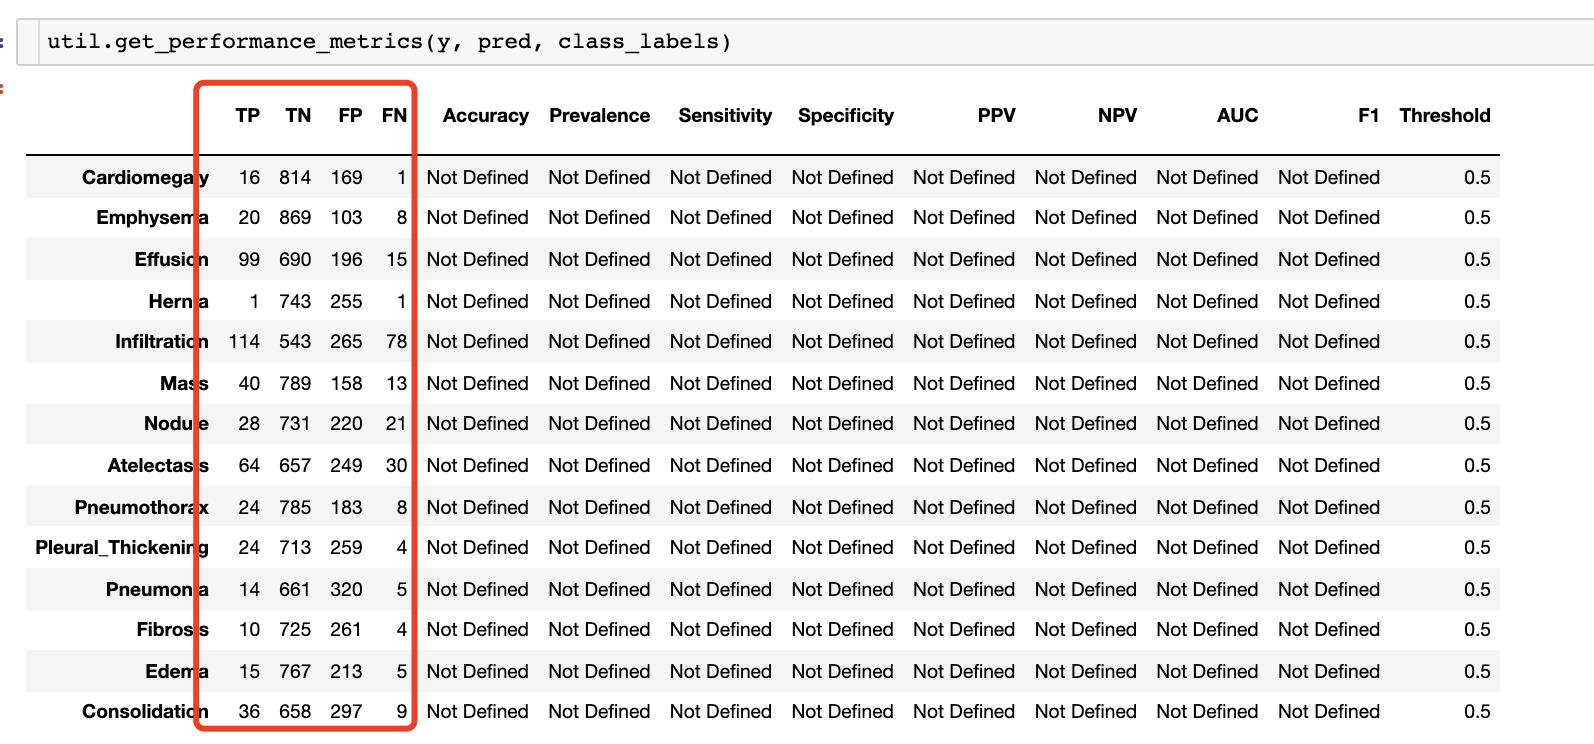
接下来为每个类计算 TP、FP、TN 和 FN。在 utils.py 中已经给出功能函数。直接调用即可
util.get_performance_metrics(y, pred, class_labels)
1.4.2 计算 Accuracy
使用 TP、FP、TN 和 FN来表示 accuracy
a
c
c
u
r
a
c
y
=
true positives
+
true negatives
true positives
+
true negatives
+
false positives
+
false negatives
accuracy = \\frac{\\text{true positives} + \\text{true negatives}}{\\text{true positives} + \\text{true negatives} + \\text{false positives} + \\text{false negatives}}
accuracy=true positives+true negatives+false positives+false negativestrue positives+true negatives
用代码表示为
def get_accuracy(y, pred, th=0.5):
    TP = true_positives(y,pred,th)
    FP = false_positives(y,pred,th)
    TN = true_negatives(y,pred,th)
    FN = false_negatives(y,pred,th)
    # Compute accuracy using TP, FP, TN, FN
    accuracy = (TP + TN) / (TP + TN + FP + FN)
    return accuracy
1.4.3 Prevalence 患病率
另一个重要的概念是患病率(流行度)
- 在医学背景下,患病率是人口中患有疾病(或病症等)的人的比例。
- 在机器学习术语中,这是阳性的比例。流行度的表达式为:
p r e v a l e n c e = 1 N ∑ i y i prevalence = \\frac{1}{N} \\sum_{i} y_i prevalence=N1i∑yi
N:样本总数
def get_prevalence(y):
    prevalence = 0.0
    prevalence = np.mean(y)
    return prevalence
举例测试一下
# Test
y_test = np.array([1, 0, 0, 1, 1, 0, 0, 0, 0, 1])
print(f"computed prevalence: {get_prevalence(y_test)}")
computed prevalence: 4 / 10 = 0.4 4 / 10 = 0.4 4/10=0.4
1.4.4 Sensitivity and Specificity
敏感性和特异性是用于衡量分类的两个最重要的指标。
- 敏感性是判断如果案例实际是阳性,我们预测为阳性的概率。
- 特异性是给定病例实际上是阴性的情况下模型输出阴性的概率。
s e n s i t i v i t y = true positives true positives + false negatives sensitivity = \\frac{\\text{true positives}}{\\text{true positives} + \\text{false negatives}} sensitivity=true positives+false negativestrue positives
s p e c i f i c i t y = true negatives true negatives + false positives specificity = \\frac{\\text{true negatives}}{\\text{true negatives} + \\text{false positives}} specificity=true negatives+false positivestrue negatives
def get_sensitivity(y, pred, th=0.5):
    TP = true_positives(y,pred,th)
    FN = false_negatives(y,pred,th)
    # use TP and FN to compute sensitivity
    sensitivity = TP/(TP+FN)
    return sensitivity

def get_specificity(y, pred, th=0.5):
    TN = true_negatives(y,pred,th)
    FP = false_positives(y,pred,th)
    # use TN and FP to compute specificity
    specificity = TN/(TN+FP)
 return specificity
1.4.5 PPV and NPV
然而在诊断上,敏感性和特异性没有帮助。
例如,敏感性告诉我们,假设该人已经患有这种疾病,我们的测试输出阳性的概率。但是,我们实际中,事先并不知道患者是否是阳性。
如果我们的测试结果为阳性,那有多大的概率这个病人确实是阳性呢。这就要用阳性预测值 (PPV) 和阴性预测值 (NPV)。
- 阳性预测值 (PPV) 是筛查试验阳性的受试者确实患有该疾病的概率。
- 阴性预测值 (NPV) 是筛查试验阴性的受试者确实没有患病的概率。
P P V = true positives true positives + false positives PPV = \\frac{\\text{true positives}}{\\text{true positives} + \\text{false positives}} PPV=true positives+false positivestrue positives
N P V = true negatives true negatives + false negatives NPV = \\frac{\\text{true negatives}}{\\text{true negatives} + \\text{false negatives}} NPV=true negatives+false negativestrue negatives
def get_ppv(y, pred, th=0.5):
    TP = true_positives(y,pred,th)
    FP = false_positives(y,pred,th)
    # use TP and FP to compute PPV
    PPV =  TP/(TP+FP)
    return PPV

def get_npv(y, pred, th=0.5):
    TN = true_negatives(y,pred,th)
    FN = false_negatives(y,pred,th)
    # use TN and FN to compute NPV
    NPV = TN/(TN+FN)
    return NPV
1.4.6 ROC Curve and AUC
到目前为止,我们一直在假设我们的模型对0.5及以上的预测应该被视为阳性,否则应该被视为阴性。
然而,这是一个相当随意的选择。
接收者操作特征 (ROC) 曲线是通过在各种阈值设置下绘制真阳性率 (TPR) 与假阳性率 (FPR) 来创建的。
理想点在左上角,真阳性率为1,假阳性率为0。曲线上的各个点都是通过逐渐改变阈值产生的。
通过代码调用
util.get_curve(y, pred, class_labels)
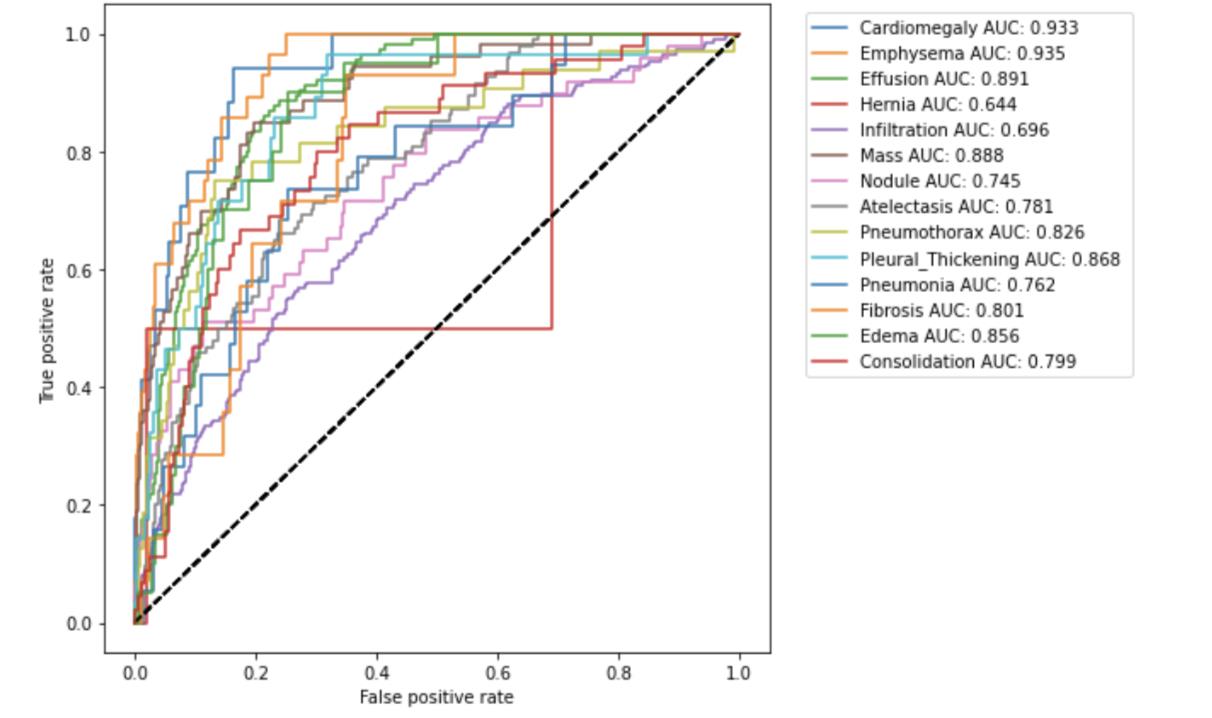
ROC 曲线下的面积也称为 AUROC 或 C 统计量,是拟合优度的度量。
让我们使用sklearn度量函数roc_auc_score计算AUC。
from sklearn.metrics import roc_auc_score
auc = roc_auc_score(y[:, 0], pred[:, 0])
计算第一个疾病的 A U C = 0.933 AUC=0.933 AUC=0.933
如果作业代码以上都顺利跑通的话,可以得到如下列表
1.5 置信区间
置信区间在之前的解说中,已经讲过它的含义,可以翻看之前的文章。
代码文件中也给出了相对正规的定义。这里,我使用大白话来做一个说明。
假设我们要求每个疾病的平均AUC, 以及估计它的总体样本的AUC 置信区间范围。用式子表述疾病 心脏增大(Cardiomegaly) 的均值和置信区间(CI 5%-95%) = 0.93 ( 0.90 − 0.96 ) 0.93 (0.90-0.96) 0.93(0.90−0.96)
我们需要做如下几步
- 做分层采样 n 次:
我们从数据集中(这里我们一直使用的是验证集)采样 1000 个样本,根据流行率来采样正负样本。一共采样 100次。
并且计算每次采样的样本的 mean auc, 存储在 statistics变量里, 因此,statistics的大小为 [classes, 100].
def bootstrap_auc(y, pred, classes, bootstraps = 100, fold_size = 1000):
    statistics = np.zeros((len(classes), bootstraps))

    for c in range(len(classes)):
        df = pd.DataFrame(columns=['y', 'pred'])
        df.loc[:, 'y'] = y[:, c]
        df.loc[:, 'pred'] = pred[:, c]
        # get positive examples for stratified sampling
        df_pos = df[df.y == 1]
        df_neg = df[df.y == 0]
        prevalence = len(df_pos) / len(df)
        for i in range(bootstraps):
            # stratified sampling of positive and negative examples
            pos_sample = df_pos.sample(n = int(fold_size * prevalence), replace=True)
            neg_sample = df_neg.sample(n = int(fold_size * (1-prevalence)), replace=True)

            y_sample = np.concatenate([pos_sample.y.values, neg_sample.y.values])
            pred_sample = np.concatenate([pos_sample.pred.values, neg_sample.pred.values])
            score = roc_auc_score(y_sample, pred_sample)
            statistics[c][i] = score
    return statistics

statistics = bootstrap_auc(y, pred, class_labels)
比如,第一个疾病的100次 AUC 为

- 根据 statistics 计算每个类别的均值和置信区间
- 均值:就是求这100次的平均值
- 置信区间 假设我们要求的置信区间范围是 5%-95%
可以使用函数np.quantile()
def print_confidence_intervals(class_labels, statistics):
    df = pd.DataFrame(columns=["Mean AUC (CI 5%-95%)"])
    for i in range(len(class_labels)):
        mean = statistics.mean(axis=1)[i]
        max_ = np.quantile(statistics, .95, axis=1)[i]
        min_ = np.quantile(statistics, .05, axis=1)[i]
        df.loc[class_labels[i]] = ["%.2f (%.2f-%.2f)" % (mean, min_, max_)]
    return df
print_confidence_intervals这个函数在 utils.py里
所有疾病的 AUC 结果如下
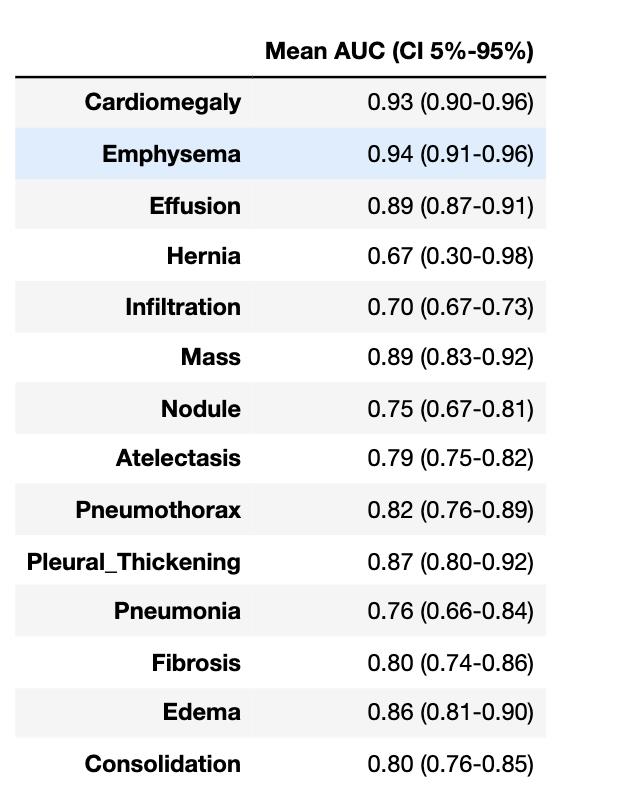
从表中可以看到,有些类别的置信区间很宽。
例如,疝气(Hernia)区间为 0.30-0.98,这表明我们不能确定它比偶然(0.5)好。
置信区间越大,越代表模型对其预测的不确定性
1.6 Precision-Recall Curve
当类别非常不平衡时,Precision-Recall(精确度-召回率) 是衡量预测成功与否的有用指标。
在信息检索中
- 精度是衡量结果相关性的指标,相当于我们之前定义的 PPV。
- 召回率衡量返回了多少真正相关的结果,这相当于我们之前定义的敏感度。
精确率-召回率曲线 (PRC) 显示了不同阈值下精确率和召回率之间的权衡。
曲线下方的高面积代表高召回率和高精度,其中高精度与低假阳性率相关,高召回率与低假阴性率相关。
两者的高分表明分类器正在返回准确的结果(高精度),以及返回大部分阳性结果(高召回率)。
PRC 可用 sklearn.metrics.precision_recall_curve 求得
def get_curve(gt, pred, target_names, curve='roc'):
for i in range(len(target_names)):
if curve == 'roc':
curve_function = roc_curve
auc_roc = roc_auc_score(gt[:, i], pred[:, i])
label = target_names[i] + " AUC: %.3f " % auc_roc
xlabel = "False positive rate"
ylabel = "True positive rate"
a, b, _ = curve_function(gt[:, i], pred[:, i])
plt.figure(1, figsize=(7, 7))
plt.plot([0, 1], [0, 1], 'k--')
plt.plot(a, b, label=label)
plt.xlabel(xlabel)
plt.ylabel(ylabel)
plt.legend(loc='upper center', bbox_to_anchor=(1.3, 1),
fancybox=True, ncol=1)
elif curve == 'prc':
precision, recall, _ = precision_recall_curve(gt[:, i], pred[:, i])
average_precision = average_precision_score(gt[:, i]