车牌识别基于matlab形态学车牌识别含Matlab源码 1155期
Posted 紫极神光
tags:
篇首语:本文由小常识网(cha138.com)小编为大家整理,主要介绍了车牌识别基于matlab形态学车牌识别含Matlab源码 1155期相关的知识,希望对你有一定的参考价值。
一、简介
基于matlab形态学车牌识别(附课程报告)
二、源代码
clear ;
close all;

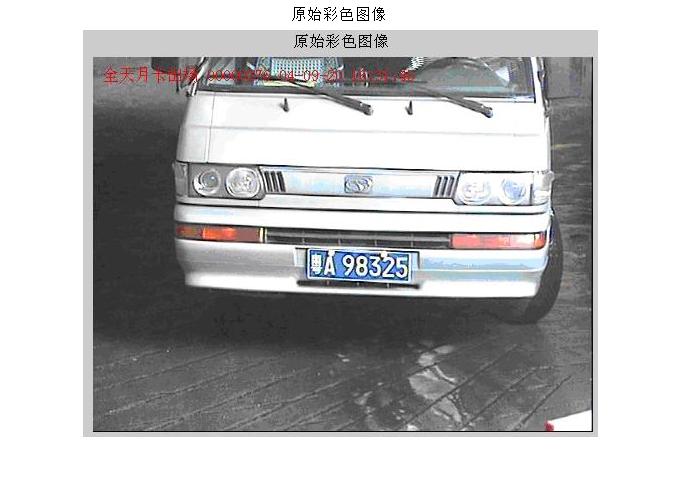
%Step1 获取图像   装入待处理彩色图像并显示原始图像
Scolor = imread('3.jpg');%imread函数读取图像文件
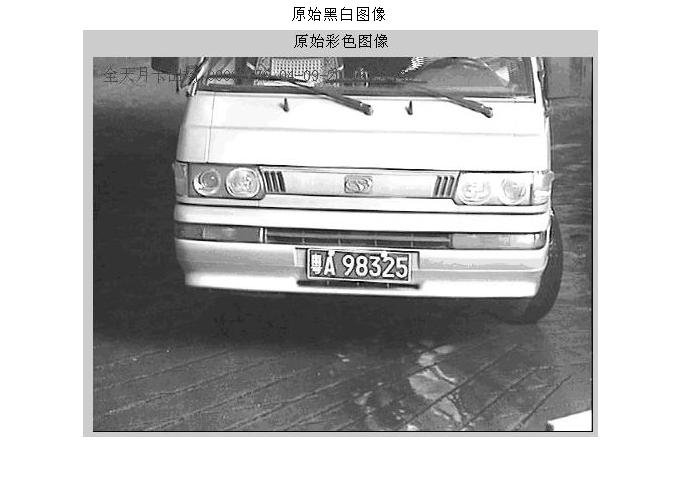
%将彩色图像转换为黑白并显示
Sgray = rgb2gray(Scolor);%rgb2gray转换成灰度图
figure,imshow(Scolor),title('原始彩色图像');%figure命令同时显示两幅图像
figure,imshow(Sgray),title('原始黑白图像');
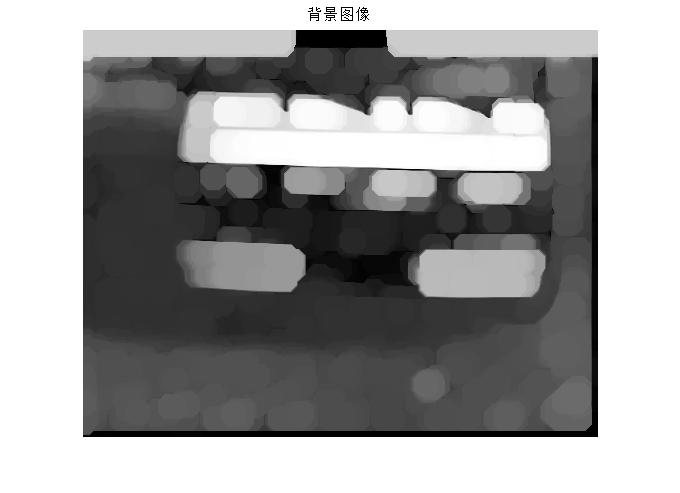
%Step2 图像预处理   对Sgray 原始黑白图像进行开操作得到图像背景
s=strel('disk',13);%strei函数
Bgray=imopen(Sgray,s);%打开sgray s图像
figure,imshow(Bgray);title('背景图像');%输出背景图像
%用原始图像与背景图像作减法,增强图像
Egray=imsubtract(Sgray,Bgray);%两幅图相减
figure,imshow(Egray);title('增强黑白图像');%输出黑白图像
%Step3 取得最佳阈值,将图像二值化
fmax1=double(max(max(Egray)));%egray的最大值并输出双精度型
fmin1=double(min(min(Egray)));%egray的最小值并输出双精度型
level=(fmax1-(fmax1-fmin1)/3)/255;%获得最佳阈值
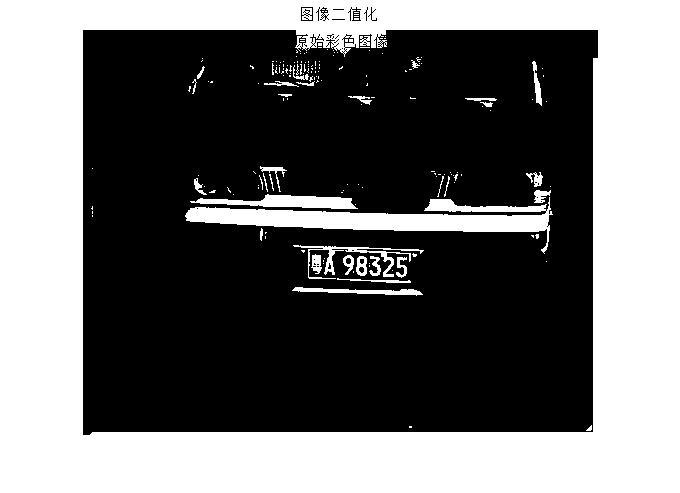
bw22=im2bw(Egray,level);%转换图像为二进制图像
bw2=double(bw22);
%Step4 对得到二值图像作开闭操作进行滤波
figure,imshow(bw2);title('图像二值化');%得到二值图像
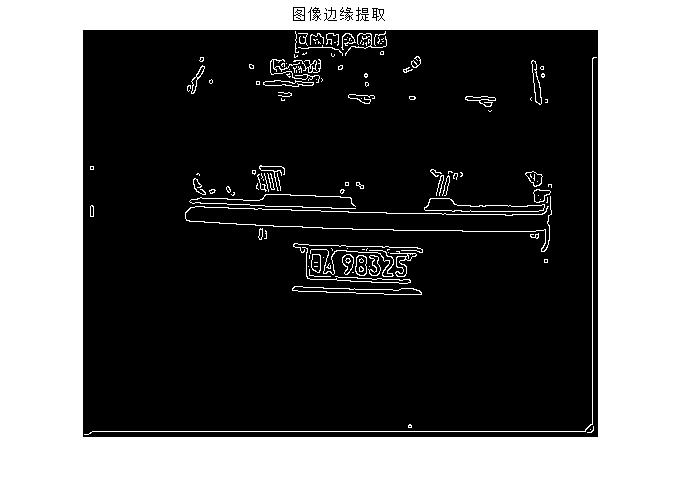
grd=edge(bw2,'canny')%用canny算子识别强度图像中的边界
figure,imshow(grd);title('图像边缘提取');%输出图像边缘
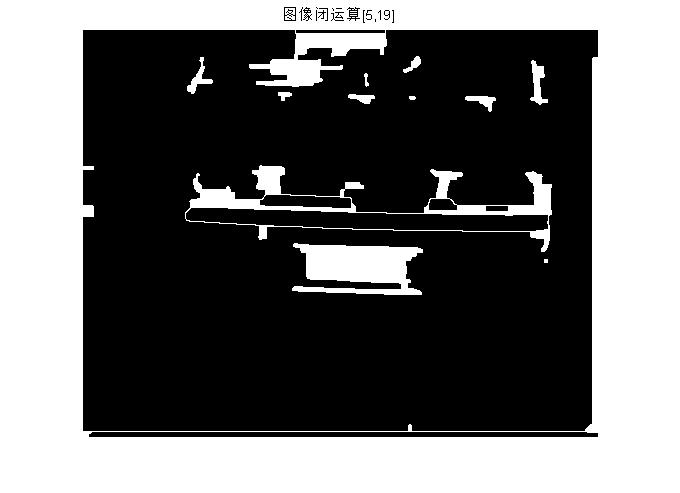
bg1=imclose(grd,strel('rectangle',[5,19]));%取矩形框的闭运算
figure,imshow(bg1);title('图像闭运算[5,19]');%输出闭运算的图像
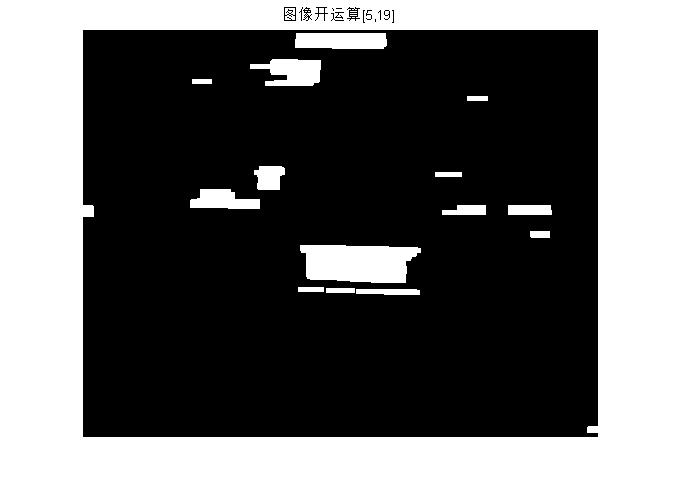
bg3=imopen(bg1,strel('rectangle',[5,19]));%取矩形框的开运算
figure,imshow(bg3);title('图像开运算[5,19]');%输出开运算的图像
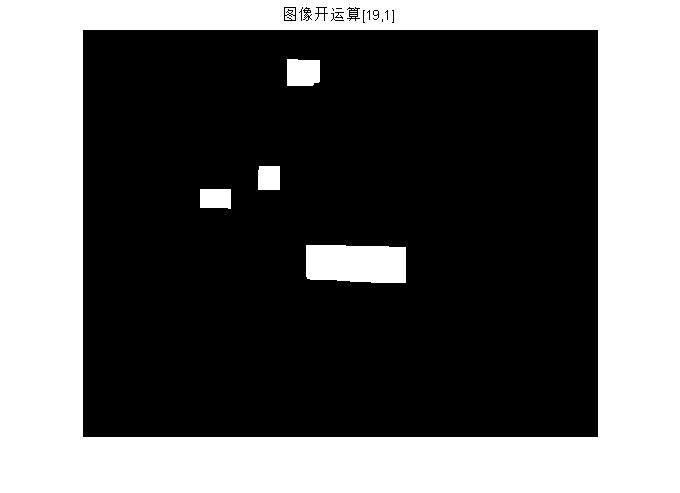
bg2=imopen(bg3,strel('rectangle',[19,1]));%取矩形框的开运算
figure,imshow(bg2);title('图像开运算[19,1]');%输出开运算的图像
%Step5 对二值图像进行区域提取,并计算区域特征参数。进行区域特征参数比较,提取车牌区域
[L,num] = bwlabel(bg2,8);%标注二进制图像中已连接的部分
Feastats = regionprops(L,'basic');%计算图像区域的特征尺寸
Area=[Feastats.Area];%区域面积
BoundingBox=[Feastats.BoundingBox];%[x y width height]车牌的框架大小
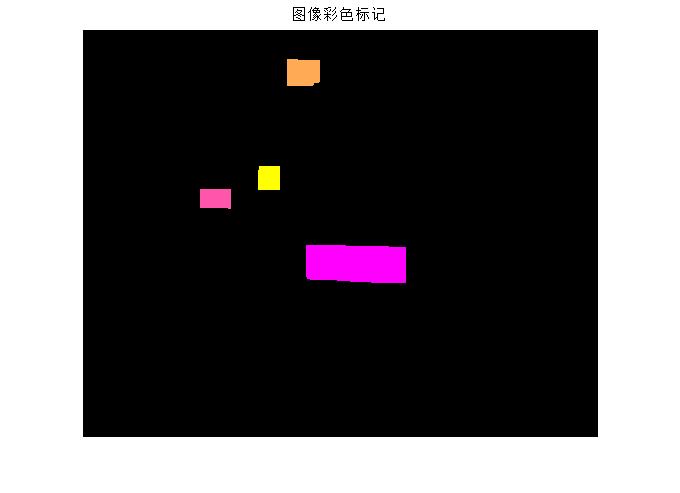
RGB = label2rgb(L, 'spring', 'k', 'shuffle'); %标志图像向RGB图像转换
figure,imshow(RGB);title('图像彩色标记');%输出框架的彩色图像
lx=0;
for l=1:num
    width=BoundingBox((l-1)*4+3);%框架宽度的计算
    hight=BoundingBox((l-1)*4+4);%框架高度的计算
    if (width>98 & width<160 & hight>25 & hight<50)%框架的宽度和高度的范围
        lx=lx+1;
        Getok(lx)=l;
    end
end
for k= 1:lx
    l=Getok(k);
    startcol=BoundingBox((l-1)*4+1)-2;%开始列
    startrow=BoundingBox((l-1)*4+2)-2;%开始行
    width=BoundingBox((l-1)*4+3)+8;%车牌宽
    hight=BoundingBox((l-1)*4+4)+2;%车牌高
    rato=width/hight;%计算车牌长宽比
    if rato>2 & rato<4
        break;
    end
end
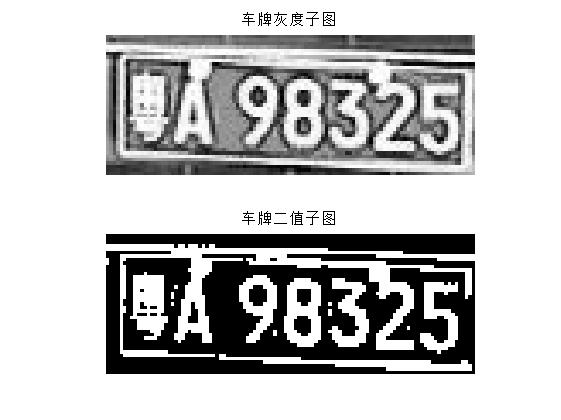
sbw1=bw2(startrow:startrow+hight,startcol:startcol+width-1); %获取车牌二值子图
subcol1=Sgray(startrow:startrow+hight,startcol:startcol+width-1);%获取车牌灰度子图
figure,subplot(2,1,1),imshow(subcol1);title('车牌灰度子图');%输出灰度图像
subplot(2,1,2),imshow(sbw1);title('车牌二值子图');%输出车牌的二值图
%Step6 计算车牌水平投影,并对水平投影进行峰谷分析
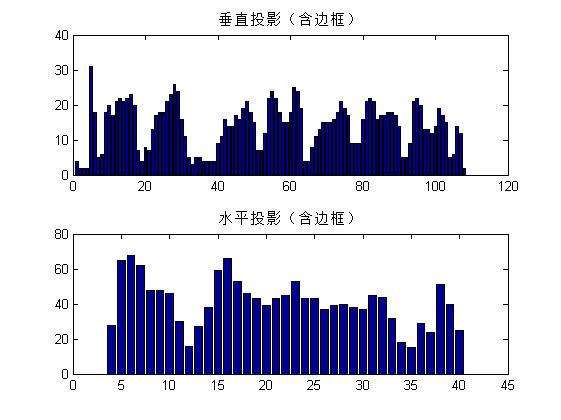
histcol1=sum(sbw1);      %计算垂直投影
histrow=sum(sbw1');      %计算水平投影
figure,subplot(2,1,1),bar(histcol1);title('垂直投影(含边框)');%输出垂直投影
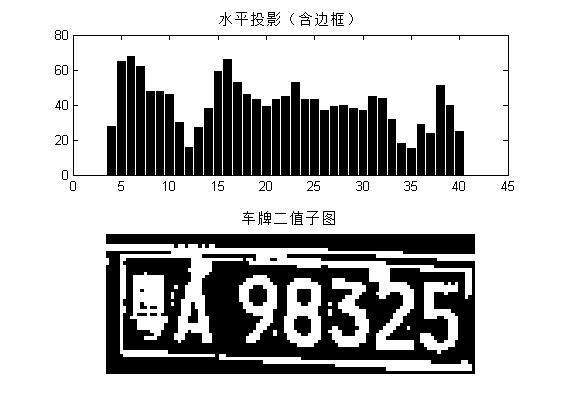
subplot(2,1,2),bar(histrow);     title('水平投影(含边框)');%输出水平投影
figure,subplot(2,1,1),bar(histrow);     title('水平投影(含边框)');%输出水平投影
subplot(2,1,2),imshow(sbw1);title('车牌二值子图');%输出二值图
%对水平投影进行峰谷分析
meanrow=mean(histrow);%求水平投影的平均值
minrow=min(histrow);%求水平投影的最小值
levelrow=(meanrow+minrow)/2;%求水平投影的平均值
count1=0;
l=1;
for k=1:hight
    if histrow(k)<=levelrow
        count1=count1+1;
    else
        if count1>=1
            markrow(l)=k;%上升点
            markrow1(l)=count1;%谷宽度(下降点至下一个上升点)
            l=l+1;
        end
        count1=0;
    end
end
markrow2=diff(markrow);%峰距离(上升点至下一个上升点)
[m1,n1]=size(markrow2);
n1=n1+1;
markrow(l)=hight;
markrow1(l)=count1;
markrow2(n1)=markrow(l)-markrow(l-1);
l=0;
for k=1:n1
    markrow3(k)=markrow(k+1)-markrow1(k+1);%下降点
    markrow4(k)=markrow3(k)-markrow(k);%峰宽度(上升点至下降点)
    markrow5(k)=markrow3(k)-double(uint16(markrow4(k)/2));%峰中心位置
end
%Step7 计算车牌旋转角度
%(1)在上升点至下降点找第一个为1的点
[m2,n2]=size(sbw1);%sbw1的图像大小
[m1,n1]=size(markrow4);%markrow4的大小
maxw=max(markrow4);%最大宽度为字符
if markrow4(1) ~= maxw%检测上边
    ysite=1;
    k1=1;
    for l=1:n2
    for k=1:markrow3(ysite)%从顶边至第一个峰下降点扫描
        if sbw1(k,l)==1
            xdata(k1)=l;
            ydata(k1)=k;
            k1=k1+1;
            break;
        end
    end
    end
else  %检测下边
    ysite=n1;
    if markrow4(n1) ==0
        if markrow4(n1-1) ==maxw
           ysite= 0; %无下边
       else
           ysite= n1-1;
       end
    end
    if ysite ~=0
        k1=1;
        for l=1:n2
            k=m2;
            while k>=markrow(ysite) %从底边至最后一个峰的上升点扫描
                if sbw1(k,l)==1
                    xdata(k1)=l;
                    ydata(k1)=k;
                    k1=k1+1;
                    break;
                end
                k=k-1;
            end
        end
    end
end
%(2)线性拟合,计算与x夹角
fresult = fit(xdata',ydata','poly1');   %poly1    Y = p1*x+p2
p1=fresult.p1;
angle=atan(fresult.p1)*180/pi; %弧度换为度,360/2pi,  pi=3.14
%(3)旋转车牌图象
subcol = imrotate(subcol1,angle,'bilinear','crop'); %旋转车牌图象
sbw = imrotate(sbw1,angle,'bilinear','crop');%旋转图像
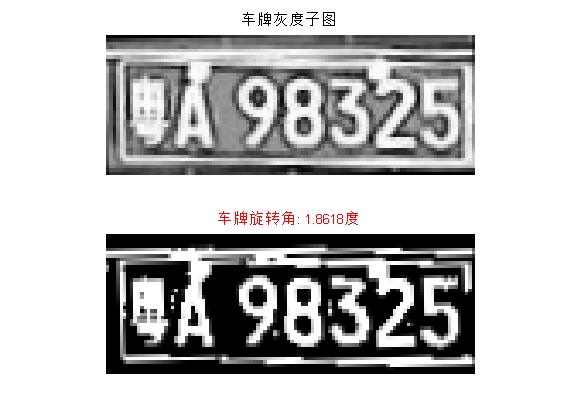
figure,subplot(2,1,1),imshow(subcol);title('车牌灰度子图');%输出车牌旋转后的灰度图像标题显示车牌灰度子图
subplot(2,1,2),imshow(sbw);title('');%输出车牌旋转后的灰度图像
title(['车牌旋转角: ',num2str(angle),'度'] ,'Color','r');%显示车牌的旋转角度
%Step8 旋转车牌后重新计算车牌水平投影,去掉车牌水平边框,获取字符高度
histcol1=sum(sbw); %计算垂直投影
histrow=sum(sbw'); %计算水平投影
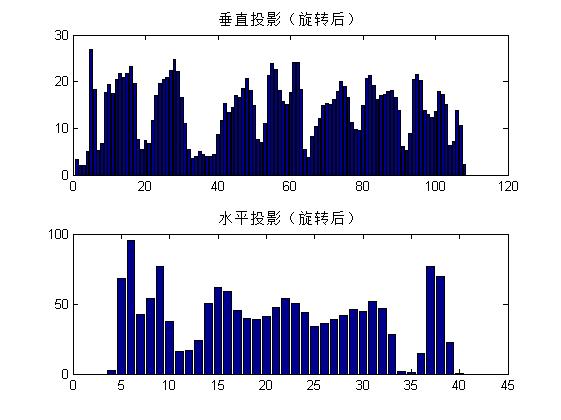
figure,subplot(2,1,1),bar(histcol1);title('垂直投影(旋转后)');
subplot(2,1,2),bar(histrow);     title('水平投影(旋转后)');
figure,subplot(2,1,1),bar(histrow);     title('水平投影(旋转后)');
subplot(2,1,2),imshow(sbw);title('车牌二值子图(旋转后)');
%去水平(上下)边框,获取字符高度
maxhight=max(markrow2);
findc=find(markrow2==maxhight);
rowtop=markrow(findc);
rowbot=markrow(findc+1)-markrow1(findc+1);
sbw2=sbw(rowtop:rowbot,:);  %子图为(rowbot-rowtop+1)行
maxhight=rowbot-rowtop+1;   %字符高度(rowbot-rowtop+1)
%Step9 计算车牌垂直投影,去掉车牌垂直边框,获取车牌及字符平均宽度
histcol=sum(sbw2);  %计算垂直投影
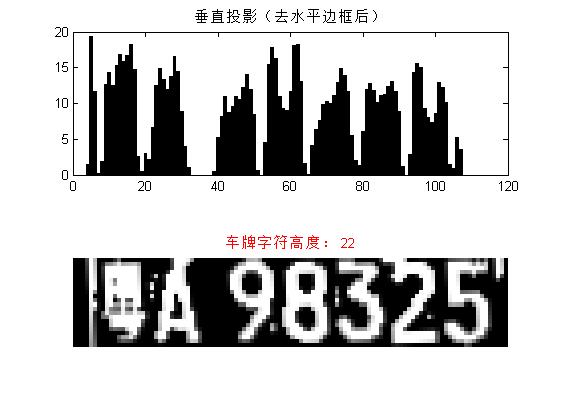
figure,subplot(2,1,1),bar(histcol);title('垂直投影(去水平边框后)');%输出车牌的垂直投影图像
subplot(2,1,2),imshow(sbw2); %输出垂直投影图像
title(['车牌字符高度: ',int2str(maxhight)],'Color','r');%输出车牌字符高度
%对垂直投影进行峰谷分析
meancol=mean(histcol);%求垂直投影的平均值
mincol=min(histcol);%求垂直投影的平均值
levelcol=(meancol+mincol)/4;%求垂直投影的1/4
count1=0;
l=1;
for k=1:width
    if histcol(k)<=levelcol
        count1=count1+1;
    else
        if count1>=1
            markcol(l)=k; %字符上升点
            markcol1(l)=count1; %谷宽度(下降点至下一个上升点)
            l=l+1;
        end
        count1=0;
    end
end
三、运行结果



四、备注
版本:2014a
以上是关于车牌识别基于matlab形态学车牌识别含Matlab源码 1155期的主要内容,如果未能解决你的问题,请参考以下文章