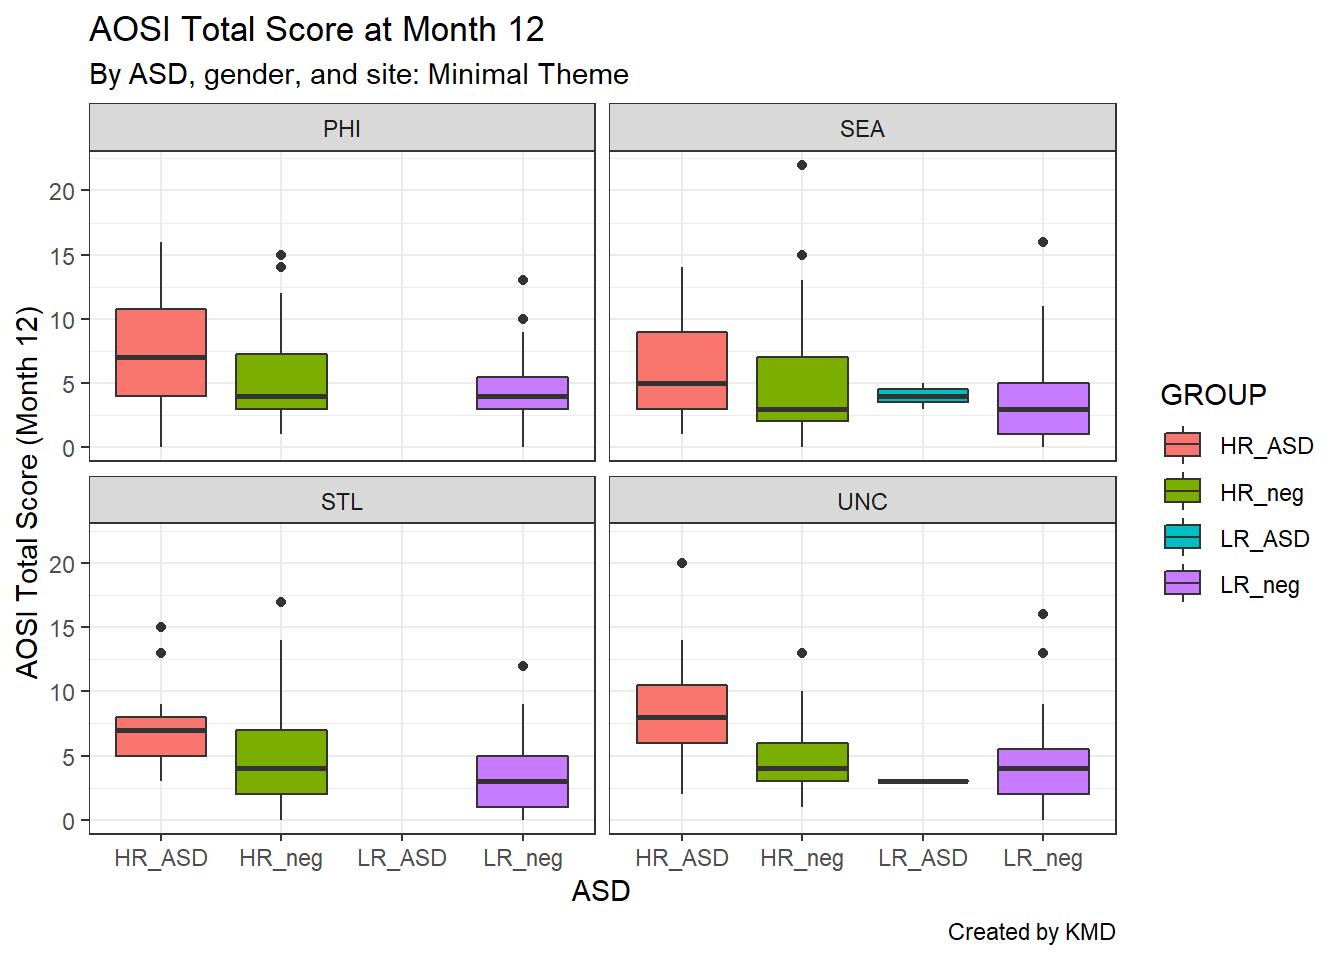
R可视化删除ggplot2图中的网格线(Gridlines)
Posted Data+Science+Insight
tags:
篇首语:本文由小常识网(cha138.com)小编为大家整理,主要介绍了R可视化删除ggplot2图中的网格线(Gridlines)相关的知识,希望对你有一定的参考价值。
R可视化删除ggplot2图中的网格线(Gridlines)

#删除ggplot2中网格线最容易的方式使用theme_classic()函数;
ggplot(df, aes(x=x, y=y)) +
  geom_point() +
  theme_classic()
#另外我们也可以使用如下语法去除特定部分的网格;
ggplot(df, aes(x=x, y=y)) +
  geom_point() +
  theme_bw() +
  theme(axis.line = element_line(color=\'black\'),
    plot.background = element_blank(),
    panel.grid.major = element_blank(),
    panel.grid.minor = element_blank(),
panel.border = element_blank())使用theme_classic()函数去除网格
#
library(ggplot2)

#define data
df <- data.frame(x=c(1, 2, 3, 4, 5, 6),
                 y=c(6, 8, 14, 19, 29, 31))

#create ggplot with no g
以上是关于R可视化删除ggplot2图中的网格线(Gridlines)的主要内容,如果未能解决你的问题,请参考以下文章