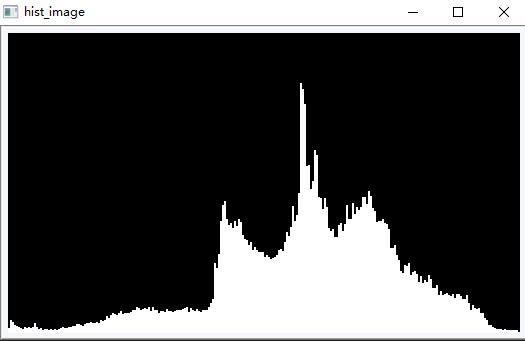
画出直方图
Posted 夜_归_人
tags:
篇首语:本文由小常识网(cha138.com)小编为大家整理,主要介绍了画出直方图相关的知识,希望对你有一定的参考价值。
 1 // 画出直方图分布
 2 void saveHistogram(CvHistogram* hist)
 3 {
 4     if(!hist) return;
 5     if(hist->mat.dim->size<=0) return;
 6     int scale = 2;
 7     int hist_height = 300;
 8     IplImage* hist_image = cvCreateImage(cvSize(hist->mat.dim->size*scale,hist_height),8,3);
 9     cvZero(hist_image);
10
11     float max_value = 0;
12     cvGetMinMaxHistValue(hist, 0,&max_value,0,0);
13     for(int i=0;i<hist->mat.dim->size;i++)
14     {
15         float bin_val = cvQueryHistValue_1D(hist,i);
16         int intensity = cvRound(bin_val*(hist_height-50)/max_value);
17         // cvRectangle  cvLine
18         cvRectangle(
19             hist_image,
20             cvPoint(i*scale,hist_height-1),
21             cvPoint((i+1)*scale - 1, hist_height - intensity),
22             CV_RGB(255,255,255));
23     }
24     cvNamedWindow("hist_image");
25     cvShowImage("hist_image",hist_image);
26     cvWaitKey(0);
27 }
28
29
30 // 直方图获取与显示
31 CvHistogram* Histogram_Image(IplImage *image)
32 {
33     int hist_size=256;
34     float range[]={0,255};
35     float * ranges[]={range};
36     IplImage * gray_plane = cvCreateImage(cvGetSize(image),8,1);
37     cvCvtColor(image,gray_plane,CV_BGR2GRAY);
38     CvHistogram* gray_hist = cvCreateHist(1,&hist_size,CV_HIST_ARRAY,ranges,1);
39     cvCalcHist(&gray_plane,gray_hist,0,0);
40     return gray_hist;
41 }


2021-06-04
以上是关于画出直方图的主要内容,如果未能解决你的问题,请参考以下文章