Python中Matplotlib的点线形状及颜色(绘制散点图)
Posted 程序员超时空
tags:
篇首语:本文由小常识网(cha138.com)小编为大家整理,主要介绍了Python中Matplotlib的点线形状及颜色(绘制散点图)相关的知识,希望对你有一定的参考价值。
我们在Python中经常使用会用到matplotlib画图,有些曲线和点的形状、颜色信息长时间不用就忘了,整理一下便于查找。
安装matplotlib后可以查看官方说明(太长不贴出来了)
from matplotlib import pyplot as plt
help(plt.plot)
常用颜色:
\'b\'          蓝色
\'g\'          绿色
\'r\'          红色
\'c\'          青色
\'m\'          品红
\'y\'          黄色
\'k\'          黑色
\'w\'          白色
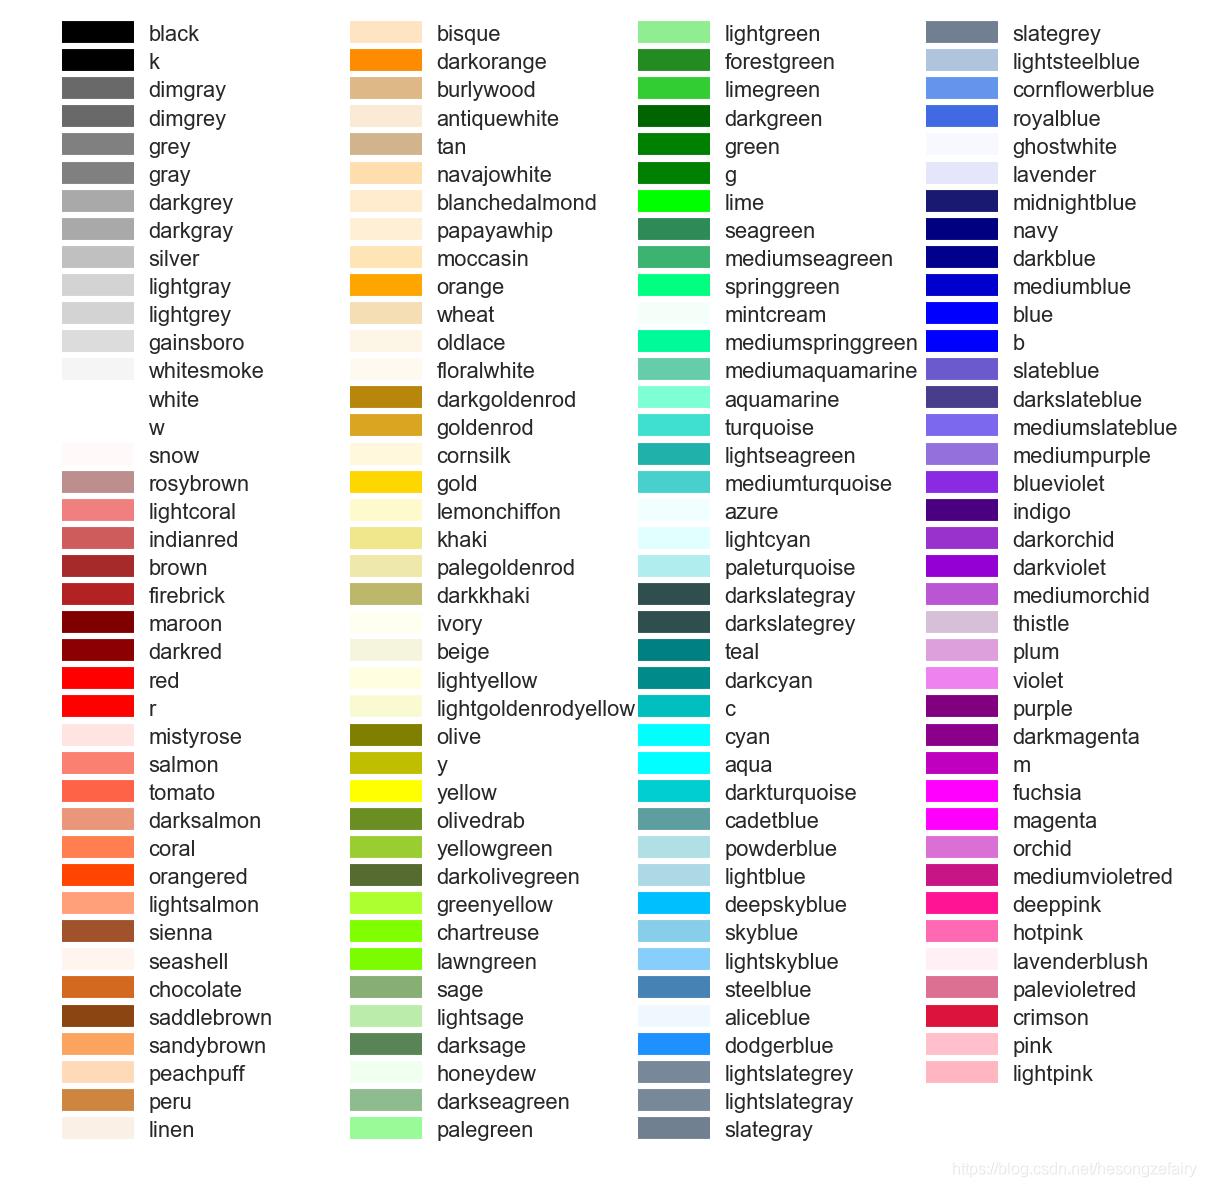
更多颜色:
plt.plot(x, y, marker=\'+\', color=\'coral\')

常用标记点形状:
‘.’:点(point marker)
‘,’:像素点(pixel marker)
‘o’:圆形(circle marker)
‘v’:朝下三角形(triangle_down marker)
‘^’:朝上三角形(triangle_up marker)
 开发者涨薪指南
 48位大咖的思考法则、工作方式、逻辑体系
以上是关于Python中Matplotlib的点线形状及颜色(绘制散点图)的主要内容,如果未能解决你的问题,请参考以下文章