es集群问题排查常用命令参数解析
Posted 一夜暴富--gogogo
tags:
篇首语:本文由小常识网(cha138.com)小编为大家整理,主要介绍了es集群问题排查常用命令参数解析相关的知识,希望对你有一定的参考价值。
一、常用命令
#1.集群健康状态
[wlsadmin@elastic-01~]$ curl -XGET "http://10.219.27.00:7116/_cluster/health?pretty"

cluster name":"cluster"
"status": "yellow",   #集群状态
"timed out" : false,
"number of nodes": 3,  #集群的节点数
"number_of data nodes": 3, #数据节点数
"active_primary_shards" : 8036,  #集群中所有活跃的主分片数
"active shards": 16082, #集群中所有活跃的分片数
"relocating shards": 0, #当前节点迁往其他节点的分片数量,通常为0,当有节点加入或者退出时该值会增加。
"initializing shards": 0, #正在初始化的分片
"unassigned shards": 10,  #未分配的分片数,通常为0,当有某个节点的副本分片丢失该值就会增加。
"delayed unassigned shards": 0,
"number of pending tasks": 0, 是指主节点创建索引并分配shards等任务,如果该指标数值一直未减小代表集群存在不稳定因素
"number of in flight fetch" :0,
"task max waiting in queue millis": 0,
"active shards percent as number" :99.93785732040766  #集群分片健康度,活跃分片数占总分片数比例。


说明:pending task只能由主节点来进行处理,这些任务包括创建索引并将shards分配给节点。

#2.集群状态信息
[wlsadmin@elastic-01~]$ curl -XGET "http://10.219.27.00:7116/_cluster/stats?pretty"

    "_nodes":
    "total":3,
    "successful":3,
    "failed":0
    ,
   "cluster name":"cluster"
   "timestamp": 1650958054278,
   "status": "yellow",
   "indices":
     "count”:1612,  #索引总数
     "shards":
       "total”:16082,  #分片总数
       "primaries”:8036, #主分片数量
       "replication”: 1.001244400199104
       "index":
         "shards":
            "min": 2,
            "max”:15,
            "avg”: 9.97642679900744
            ,
            "docs”:
          "count”: 6917866009,  #文档总数
          "deleted": 16940
          ,
          "store":
           "size in bytes”:7722541162072  #数据总存储容量
           "throttle time in millis": 0
           ,
           "fielddata”:
           "memory_size_in_bytes": 2400,
           "evictions”:0,
     "segments”:
      "count”:182641, #段总数
      "memory in bytes”: 22809369464,
       "terms memory in bytes": 20058152621
      "stored fields memory in bytes”:2091992312
      "term vectors memory in bytes”: 0,
      "norms memory in bytes":197683328,
      "points memory in bytes”: 170072327,
        "doc values memory in bytes”: 291468876,
        "index writer memory in bytes”:87483620
        "version map memory in bytes":346399,
        "fixed_bit_set memory_in_bytes”: 5536,
       "max unsafe auto id timestamp”:1650945037930
       "file_sizes”:


       ,
   "nodes":
   "count”:"total”:3,  #总节点数
   "data”:3,  #数据节点数
   "coordinating_only”: 0,
   "master”: 3,
   "ingest”:3,
   "versions”:["5.6.16"],
    "fs":
    "total in bytes”: 11249073020928,  #文件系统使用总容量
    "free in bytes”: 2432532422656,  #文件系统剩余总容量
     "available in bytes”: 1942384254976,
     "spins":"true"
     ...


#3.查看索引信息
[wlsadmin@elastic-01~]$ curl -XGET "http://10.219.27.00:7116/_cat/indices"
green open .kibana-event-log-7.8.0-000001 93qZ6-tUT1GJa9w-beZtqQ 1 1      5 0  51.5kb  25.7kb
green open .kibana-event-log-7.8.0-000002 aVeWX45vRqK5bi5ANvz3EA 1 1      0 0    416b    208b
green open .apm-custom-link               qMdSK3MAQxa4Ip37SPkaaw 1 1      0 0    416b    208b

#4.查看节点信息
[wlsadmin@elastic-01~]$ curl -XGET "http://10.219.27.00:7116/_cat/nodes?pretty"
XX.XX.XX.XX 16 64 0 0.06 0.04 0.05 dilmrt * node-1   #主节点
XX.XX.XX.XX 11 64 0 0.00 0.01 0.05 dilmrt - node-2
XX.XX.XX.XX  9 67 0 0.00 0.01 0.05 dilmrt - node-3

#5.查看索引级别,找到红色的索引
GET /_cluster/health?level=shards
"apache-logs8xxxx”:
"status" : "green",
"number_of_shards": 1,
"nusber_of_replicas":1.
"active_primary_shards":1,
"active_shards":2,
"relocating_shards”:0,
"initializing.shards”: 0
"unassignedshards”:0,
"mytest”:
"status" : "red",   #状态为红色的索引
"number_of_shards" :3.
"number_of_replicas":0.
"active_primary_shards": 0,
"active_shards" : 0,
"relocating shards": 0.
"initializing shards": 0.
"unassigned_shards”:3,

#6.查看变红原因(explanation变红原因)
GET /_cluster/allocation/explain
"node_decision" : "no",
"weight_ranking":3,"deciders”:[

   "decider":"filter",
   "decision":"NO",
   "explanation”:"""node does not match index setting Lindex.routing.allocation.require] filters [box type: "hott"]""
二、案例分析
2.1集群变红
症状:集群变红
分析:通过Allocation Explain API 发现创建索引失败,因为无法找到标记了相应box type的节点
解决:删除索引,集群变绿,重新创建索引,并且指定正确的routing box type,索引创建成功集群保持绿色状态
1.查看索引级别,找到红色的索引
GET /_cluster/health?level=shards
"apache-logs8xxxx”:
"status" : "green",
"number_of_shards": 1,
"nusber_of_replicas":1.
"active_primary_shards":1,
"active_shards":2,
"relocating_shards”:0,
"initializing.shards”: 0
"unassignedshards”:0,
"mytest”:
"status" : "red",   #状态为红色的索引
"number_of_shards" :3.
"number_of_replicas":0.
"active_primary_shards": 0,
"active_shards" : 0,
"relocating shards": 0.
"initializing shards": 0.
"unassigned_shards”:3,

2.查看变红原因(explanation变红原因)
GET /_cluster/allocation/explain
"node_decision" : "no",
"weight_ranking":3,"deciders”:[

   "decider":"filter",
   "decision":"NO",   #因为box-type不符合规则,删除不正确的索引重新创建
   "explanation”:"""node does not match index setting Lindex.routing.allocation.require] filters [box type: "hott"]""

3.删除错误的索引
curl -XDELETE localhost:9200/index_name #索引名字
DELETE  mytest

4.重新创建新索引
PUT mytest

"settings":
"number_of_shards":3,
"number_of_replicas":0
"index.routing.allocation.require.box_type":"hot"
2.2集群变黄
症状:集群变黄
分析:通过Allocation Explain API 发现无法在相同的节点上创建副本(副本分片无法正常分配)
解决:将索引的副本数设置为0,或者通过增加节点解决
1.创建索引使集群变黄
PUT mytest

    "settings":
        "nameber_of_shards":2, #分片2
        "namber_of_replicas":1, #副本1
        "index.routing.allocation.requice.box_type":'hot' #指定hot节点创建


2.查看集群健康状态为黄色
GET _cluster/health

3.查看集群黄色原因(因为集群只有一个hot节点,不能再相同的节点上创建副本)
GET /_cluster/allocation/explain
"explanation": "the shard cannot be allocated to the same node on which a copy of the shard already exists[[mytest][1],node[1-wAVO-FT0GLAdRk8-N-GQ],[P], s[STARTED],a[id=_PLt4SS1SyGvxncvU3HN-w]]"

4.解决方法
方法1:增加数据节点,使得有副本分配空间;
方法2:修改索引的setting使replicos为0
PUT mytest/_settings

    "namber_of_replicas":0

创建后集群恢复绿色状态
2.3集群磁盘空间达到阈值
问题:es节点磁盘占用较高,达到阈值,集群状态成red
此时直接删除索引磁盘空间是不会释放的,可以通过调整阈值,将集群状态变为yellow
通过api动态修改:transient 临时更改,persistent是永久更改

临时修改:重启es后失效

curl -H "Content-Type: application/json" -XPUT 10.203.118.32:9200/_cluster/settings -d '"transient":  "cluster.routing.allocation.disk.watermark.low": "92%", "cluster.routing.allocation.disk.watermark.high": "95%", "cluster.info.update.interval": "1m"'

永久修改:

curl -H "Content-Type: application/json" -XPUT 10.203.118.32:9200/_cluster/settings -d '"persistent":  "cluster.routing.allocation.disk.watermark.low": "90%", "cluster.routing.allocation.disk.watermark.high": "95%", "cluster.info.update.interval": "1m"  ’


在删除索引可达到空间释放的作用
修改es配置文件,需要重启es

cluster.routing.allocation.disk.watermark.low
Controls the low watermark for disk usage. It defaults to 85%, meaning that Elasticsearch will not allocate shards to nodes that have more than 85% disk used. It can also be set to an absolute byte value (like 500mb) to prevent Elasticsearch from allocating shards if less than the specified amount of space is available. This setting has no effect on the primary shards of newly-created indices or, specifically, any shards that have never previously been allocated.
cluster.routing.allocation.disk.watermark.high
Controls the high watermark. It defaults to 90%, meaning that Elasticsearch will attempt to relocate shards away from a node whose disk usage is above 90%. It can also be set to an absolute byte value (similarly to the low watermark) to relocate shards away from a node if it has less than the specified amount of free space. This setting affects the allocation of all shards, whether previously allocated or not.
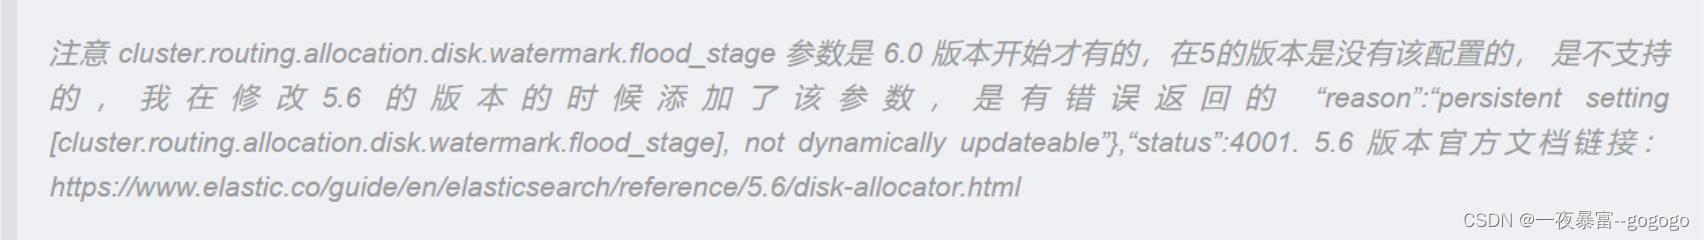
cluster.routing.allocation.disk.watermark.flood_stage
Controls the flood stage watermark. It defaults to 95%, meaning that Elasticsearch enforces a read-only index block (index.blocks.read_only_allow_delete) on every index that has one or more shards allocated on the node that has at least one disk exceeding the flood stage. This is a last resort to prevent nodes from running out of disk space. The index block must be released manually once there is enough disk space available to allow indexing operations to continue.
es 集群的默认配置是当集群中的某个节点磁盘达到使用率为 85% 的时候,就不会在该节点进行创建副本,当磁盘使用率达到 90% 的时候,尝试将该节点的副本重分配到其他节点。
当磁盘使用率达到95% 的时候,当前节点的所有索引将被设置为只读索引。
三、es集群认证忘记账户密码
3.1ES集群在基于xpack安全认证方式下,密码丢失该如何快速重置密码?
ES集群在基于xpack安全认证方式下,密码丢失该如何快速重置密码?
保持当前ES服务正常,配置文件不做任何修改选择集群内正常可用的某个节点做本地操作。
创建基本本地认证的临时超级管理员admin。设置密码admin,权限为superuser。

/midware/elasticsearch/bin/elasticsearch-users useradd  admin -p admin -r superuser


利用刚才创建的临时用户更改超级用户elastic密码为elasticcurl -u  admin -XPUT 'http://10.203.118.37:9200/_xpack/security/user/elastic/_password?pretty' -H 'Content-Type: application/json' -d ''password':'elastic''
删除临时超级用户,ES集群无痕处理/midware/elasticsearch/bin/elasticsearch-users userdel  admin
使用更改后账户密码登录即可
以上是关于es集群问题排查常用命令参数解析的主要内容,如果未能解决你的问题,请参考以下文章