Python可视化31|matplotlib-图添加文本(text)及注释(annotate)
Posted qq_21478261
tags:
篇首语:本文由小常识网(cha138.com)小编为大家整理,主要介绍了Python可视化31|matplotlib-图添加文本(text)及注释(annotate)相关的知识,希望对你有一定的参考价值。
本文详细介绍如何给一张图添加注释文字、指引箭头。
本文速览
- 不同axes之间注释箭头连接文本
- 之前介绍的venn图中个性化添加注释文本框

目录
1、添加文本(matplotlib.pyplot.text)
2、添加注释(matplotlib.pyplot.annotate)
1、添加文本(matplotlib.pyplot.text)
语法:matplotlib.pyplot.text(x, y, s, fontdict=None, **kwargs)
-
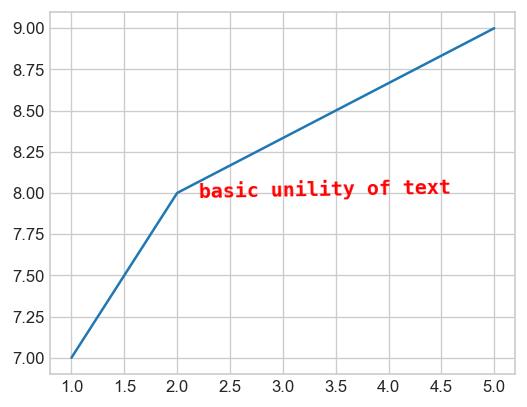
文本基本参数设置
import matplotlib.pyplot as plt
plt.style.use('seaborn-whitegrid')
plt.figure(figsize=(5,4),dpi=120)
plt.plot([1,2,5],[7,8,9])
plt.text(x=2.2,#文本x轴坐标
         y=8, #文本y轴坐标
         s='basic unility of text', #文本内容
         rotation=1,#文字旋转
         ha='left',#x=2.2是文字的左端位置,可选'center', 'right', 'left'
         va='baseline',#y=8是文字的低端位置,可选'center', 'top', 'bottom', 'baseline', 'center_baseline'
         fontdict=dict(fontsize=12, color='r',
                       family='monospace',#字体,可选'serif', 'sans-serif', 'cursive', 'fantasy', 'monospace'
                       weight='bold',#磅值,可选'light', 'normal', 'medium', 'semibold', 'bold', 'heavy', 'black'

                      )#字体属性设置
        )
-
给文本加上背景框
import matplotlib.pyplot as plt
plt.figure(figsize=(5,4),dpi=120)
plt.plot([1,2,5],[7,8,9])
text = plt.text(x=2.2,#文本x轴坐标
         y=8, #文本y轴坐标
         s='basic unility of text', #文本内容

         fontdict=dict(fontsize=12, color='r',family='monospace',),#字体属性字典

         #添加文字背景色
         bbox='facecolor': '#74C476', #填充色
              'edgecolor':'b',#外框色
               'alpha': 0.5, #框透明度
               'pad': 8,#本文与框周围距离


        )

text.set_color('b')#修改文字颜色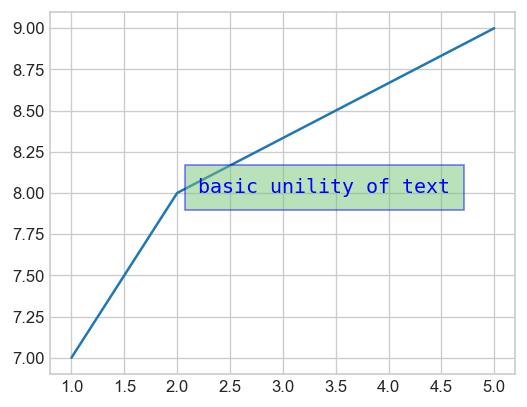
-
背景文本框形状
形状种类
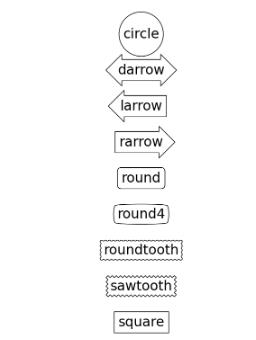
形状参数
Circle	circle	pad=0.3
DArrow	darrow	pad=0.3
LArrow	larrow	pad=0.3
RArrow	rarrow	pad=0.3
Round	round	pad=0.3,rounding_size=None
Round4	round4	pad=0.3,rounding_size=None
Roundtooth	roundtooth	pad=0.3,tooth_size=None
Sawtooth	sawtooth	pad=0.3,tooth_size=None
Square	square	pad=0.3
举个栗子
plt.figure(figsize=(5,4),dpi=120)
plt.plot([1,2,5],[7,8,9])
plt.text(x=2.2,#文本x轴坐标
         y=8, #文本y轴坐标
         s='basic unility of text', #文本内容

         fontdict=dict(fontsize=12, color='r',family='monospace',),#字体属性字典

         #添加文字背景色
         bbox='facecolor': '#74C476', #填充色
              'edgecolor':'b',#外框色
               'alpha': 0.5, #框透明度
               'pad': 0.8,#本文与框周围距离
               'boxstyle':'sawtooth'


        )
plt.show()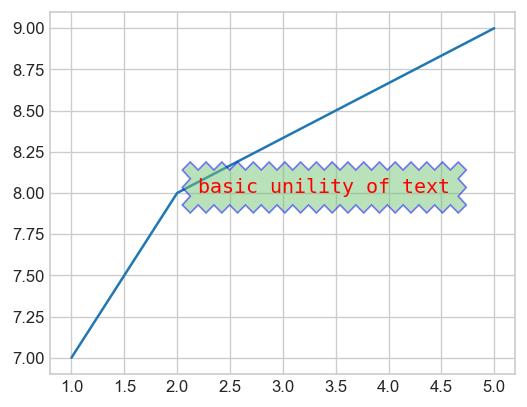
2、添加注释(matplotlib.pyplot.annotate)
语法:matplotlib.pyplot.annotate(text, xy, *args, **kwargs)
matplotlib.pyplot.annotate结合matplotlib.pyplot.text添加注释内容。
-
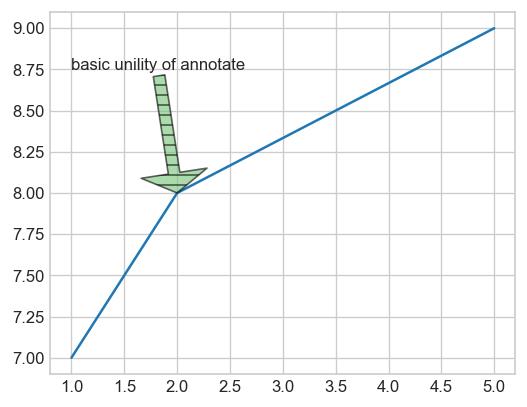
基本参数设置
plt.figure(figsize=(5,4),dpi=120)
plt.plot([1,2,5],[7,8,9])

plt.annotate('basic unility of annotate',
             xy=(2, 8),#箭头末端位置

             xytext=(1.0, 8.75),#文本起始位置

             #箭头属性设置
            arrowprops=dict(facecolor='#74C476',
                            shrink=1,#箭头的收缩比
                            alpha=0.6,
                            width=7,#箭身宽
                            headwidth=40,#箭头宽
                            hatch='--',#填充形状
                            frac=0.8,#身与头比
                            #其它参考matplotlib.patches.Polygon中任何参数
                           ),
            )
-
修改箭头形状
可选箭头形状

形状参数
箭头名称 详细参数
-	None
->	head_length=0.4,head_width=0.2
-[	widthB=1.0,lengthB=0.2,angleB=None
|-|	widthA=1.0,widthB=1.0
-|>	head_length=0.4,head_width=0.2
<-	head_length=0.4,head_width=0.2
<->	head_length=0.4,head_width=0.2
<|-	head_length=0.4,head_width=0.2
<|-|>	head_length=0.4,head_width=0.2
fancy	head_length=0.4,head_width=0.4,tail_width=0.4
simple	head_length=0.5,head_width=0.5,tail_width=0.2
wedge	tail_width=0.3,shrink_factor=0.5
举个栗子
plt.figure(figsize=(5,4),dpi=120)
plt.plot([1,2,5],[7,8,9])

plt.annotate('basic unility of annotate',
             xy=(2, 8),
             xytext=(1.0, 8.75),
             arrowprops=dict(facecolor='#74C476',
                            alpha=0.6,
                            arrowstyle='-|>',#箭头类型修改
                             color='r'
                           ),
)-
箭头弯曲
plt.figure(figsize=(5,4),dpi=120)
plt.plot([1,2,5],[7,8,9])

plt.annotate('basic unility of annotate',
             xy=(2, 8),
             xytext=(1.0, 8.75),
             arrowprops=dict(facecolor='#74C476',
                             alpha=0.6,
                             arrowstyle='-|>',
                             connectionstyle='arc3,rad=0.5',#有多个参数可选
                             color='r',
                            ),
            )
plt.show()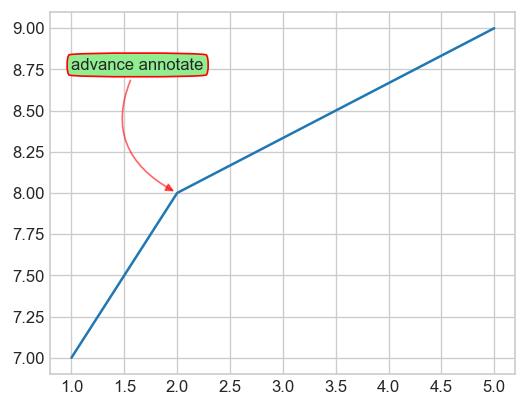
-
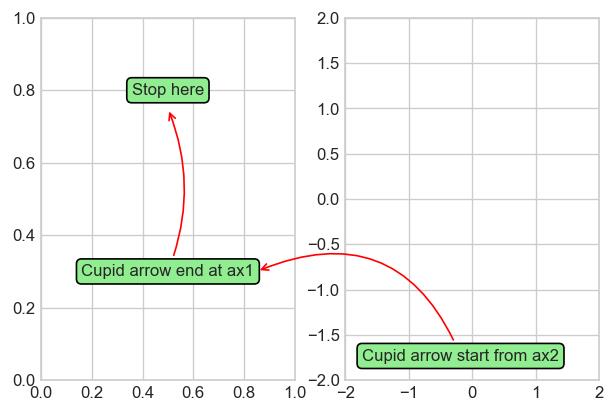
跨子图注释
from matplotlib.text import OffsetFrom
fig, (ax1, ax2) = plt.subplots(1, 2,dpi=120)

bbox_args = dict(boxstyle="round", fc="lightgreen")
arrow_args = dict(arrowstyle="->",color='r')

ax1.annotate('Cupid arrow end at ax1', xy=(.5, .75),
                   xytext=(.5, .3),
                   ha="center", va="center",
                   bbox=bbox_args,
                   arrowprops=dict(patchB=an1.get_bbox_patch(),
                                   connectionstyle="arc3,rad=0.2",
                                   **arrow_args))

ax1.annotate('Stop here', xy=(.5, .7),
                   xytext=(.5, .8),
                   ha="center", va="center",
                   bbox=bbox_args,
                   )

ax2.annotate('Cupid arrow start from ax2',
             xy=(0.85, 0.3), xycoords=ax1.transData,#跨子图设置
             xytext=(10, 10),
             textcoords=OffsetFrom(ax2.bbox, (0, 0), "points"),
             ha="left", va="bottom",
             bbox=bbox_args,
             arrowprops=dict(connectionstyle="arc3,rad=0.5",
                             **arrow_args,

                            ))

ax2.set(xlim=[-2, 2], ylim=[-2, 2])
plt.show()
参考资料
以上是关于Python可视化31|matplotlib-图添加文本(text)及注释(annotate)的主要内容,如果未能解决你的问题,请参考以下文章