Python 使用Sidetable探索数据集
Posted 卖山楂啦prss
tags:
篇首语:本文由小常识网(cha138.com)小编为大家整理,主要介绍了Python 使用Sidetable探索数据集相关的知识,希望对你有一定的参考价值。
在对数据集进行探索时,我经常使用的语句包括
df.shape
df.head()
df.columns
df.sample(n=10)
df.info(verbose=True)
df['x1'].value_counts()
df['x1'].value_counts(normalize=True)
df['x1'].unique()
nunique()
groupby
describe()
describe(include = 'all').T
df.isnull().sum()
print("数据集中有%s列重复行" % (df.shape[0] - df.drop_duplicates().shape[0]))
df.duplicated().sum()
df.corr()
sns.countplot
sns.distplot
sns.kdeplot
sns.heatmap
...
最近呢,又学习了一个新的数据探索包——Sidetable,懒得介绍了,百度有很多,其实看一下代码+结果,就知道咋用了,非常舒适~
安装
pip install -i https://pypi.doubanio.com/simple/ --trusted-host pypi.doubanio.com sidetable
数据:http://www.statsci.org/data/general/fev.html
import sidetable
import pandas as pd
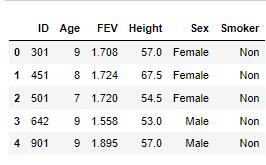
df=pd.read_excel(r'C:\\Users\\ABC\\Desktop\\data.xlsx')
df.head()
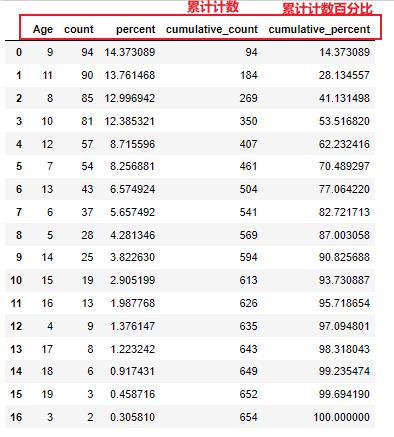
df.stb.freq(['Age'])
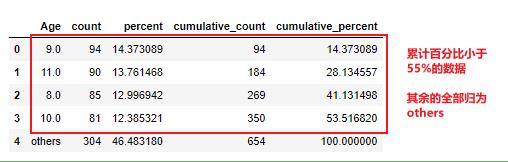
# 查看累计百分比小于55%的数据
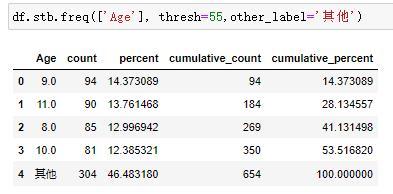
df.stb.freq(['Age'], thresh=55)
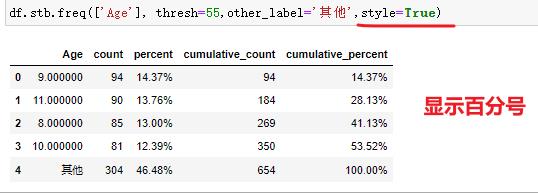
# 百分比显示格式
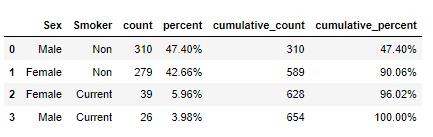
df.stb.freq(['Sex', 'Smoker'],style=True)
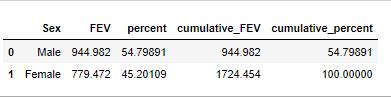
# 按照Sex聚合,求FEV的sum
df.stb.freq(['Sex'], value='FEV')
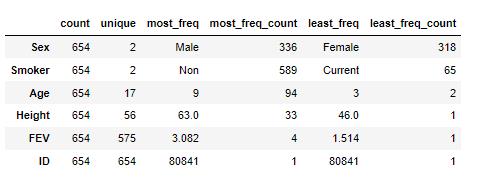
pd.set_option('display.max_columns',None)  # 全部列
df.stb.counts()
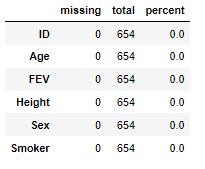
# 缺失值,当然这里数据集没有缺失值
df.stb.missing()
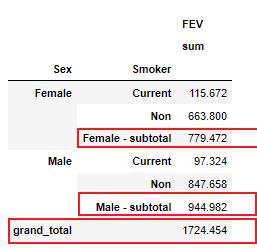
# 显示小计和总计
df.groupby(['Sex','Smoker']).agg('FEV':['sum']).stb.subtotal()
以上是关于Python 使用Sidetable探索数据集的主要内容,如果未能解决你的问题,请参考以下文章