通过一个函数对比 mgrid以及meshgrid函数
Posted 卓晴
tags:
篇首语:本文由小常识网(cha138.com)小编为大家整理,主要介绍了通过一个函数对比 mgrid以及meshgrid函数相关的知识,希望对你有一定的参考价值。
简 介: 利用3D曲面显示可以更好的将三维函数性能可视化展示。利用view_init()设置不同的视角,动态显示曲面的不同方面。
关键词: meshgrid,mgrid,view_init
§01 Axes3D函数曲面
1.1 绘制Axes3D函数曲面
1.1.1 利用mgrid产生x,y
import sys,os,math,time
sys.path.append("/home/aistudio/external-libraries")
import matplotlib.pyplot as plt
from numpy import *

from mpl_toolkits.mplot3d import Axes3D

def fxy(x,y):
    return 3*(1-x)**2*exp(-(x**2+(y+1)**2))+\\
           10*(x/5-x**3-y**5)*exp(-(x**2+y**2))-\\
           exp(-((x+1)**2+y**2))/3
grid_num = 100
x,y = mgrid[-4:4:grid_num*1j, -2:2:grid_num*1j]
xx = x.flatten()
yy = y.flatten()

ff = fxy(xx,yy).reshape(x.shape)

ax = Axes3D(plt.figure(figsize=(12,8)))
ax.plot_surface(x,y,ff,
                rstride=1,
                cstride=1,
                cmap=plt.cm.Blues)
plt.show()
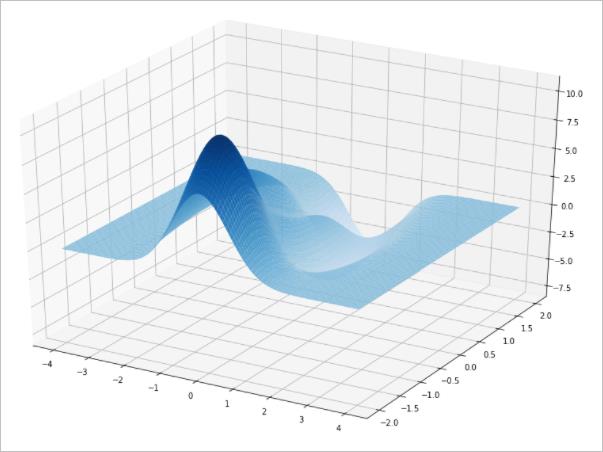
▲ 图1 mgrid产生的函数曲面
1.1.2 利用meshgrid产生xy
grid_num = 100
x = linspace(-4,4,grid_num)
y = linspace(-2,2,grid_num)
x,y = meshgrid(x,y)
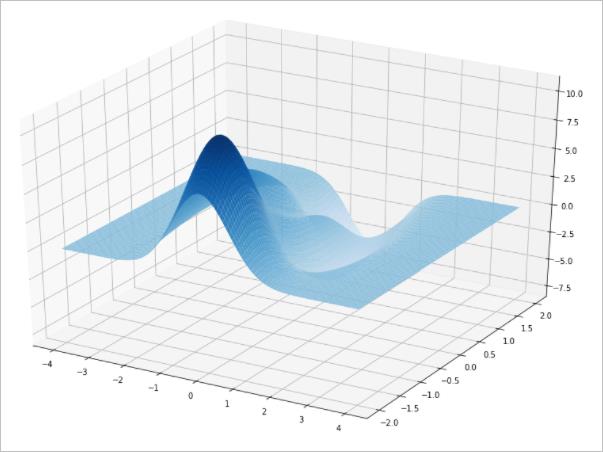
▲ 图1.1.2 mgrid产生的函数曲面
1.2 多角度的Axes3D
gifpath = '/home/aistudio/GIF'
if not os.path.isdir(gifpath):
    os.makedirs(gifpath)
gifdim = os.listdir(gifpath)
for f in gifdim:
    fn = os.path.join(gifpath, f)
    if os.path.isfile(fn):
        os.remove(fn)

xx = x.flatten()
yy = y.flatten()

ff = fxy(xx,yy).reshape(x.shape)

ax = Axes3D(plt.figure(figsize=(12,8)))
ax.plot_surface(x,y,ff,
                rstride=1,
                cstride=1,
                cmap=plt.cm.Blues)

count = 0
for i in range(0, 180, 10):
    ax.view_init(30,i)
    fn = os.path.join(gifpath, '%03d.jpg'%count)
    count += 1
    plt.savefig(fn)
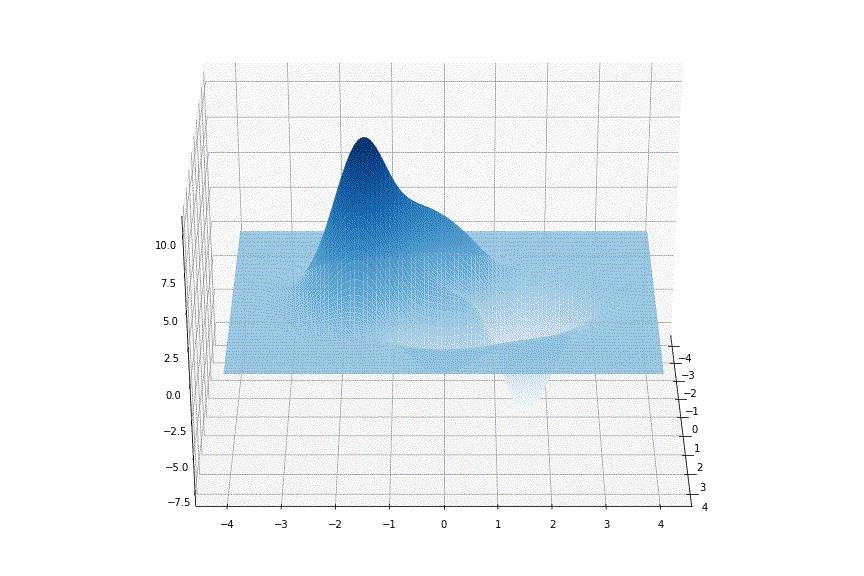
▲ 图 旋转GIF
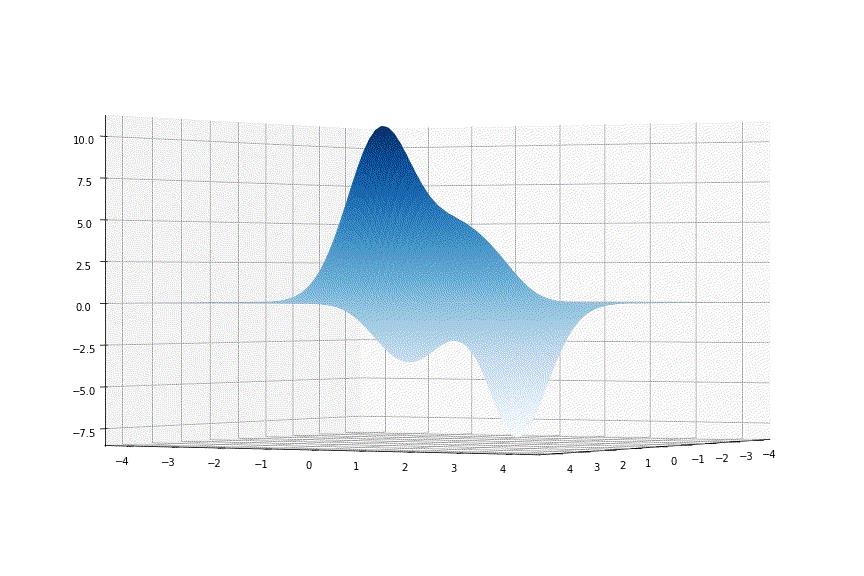
▲ 图 旋转GIF
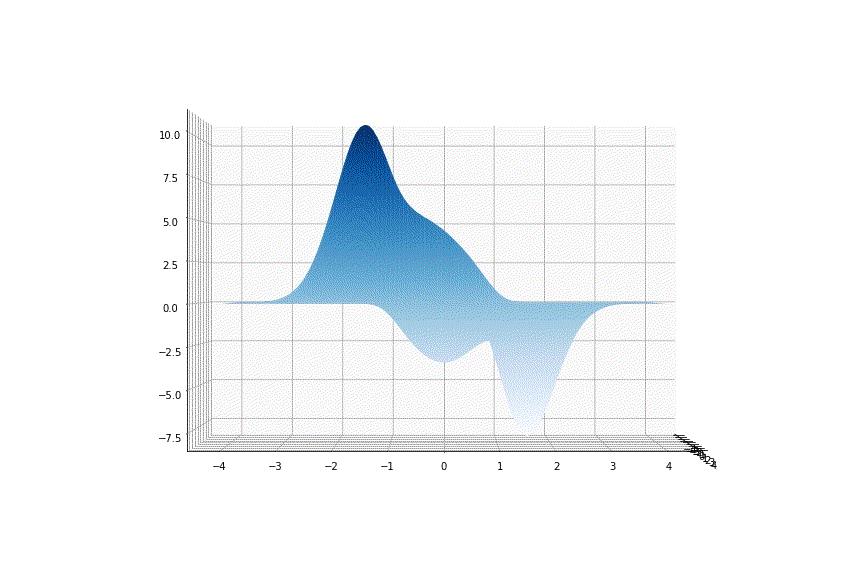
▲ 图 旋转GIF
1.3 contour3D
xx = x.flatten()
yy = y.flatten()

ff = fxy(xx,yy).reshape(x.shape)

ax = Axes3D(plt.figure(figsize=(12,8)))

ax = plt.axes(projection='3d')
ax.contour3D(x,y,ff, 100, cmap=plt.cm.hot)

count = 0
for i in tqdm(range(0, 350, 10)):
    ax.view_init(30, i)
    fn = os.path.join(gifpath, '%03d.jpg'%count)
    count += 1
    plt.savefig(fn)
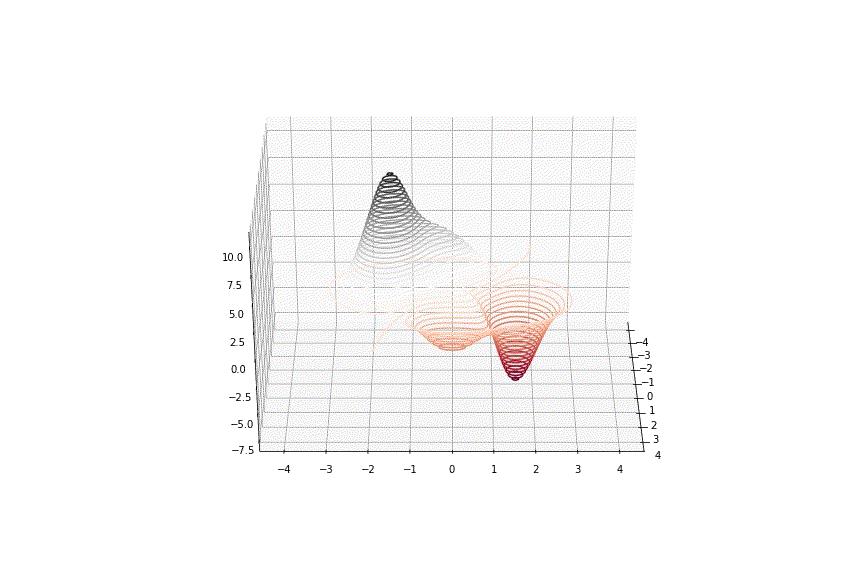
▲ 图 contour3D
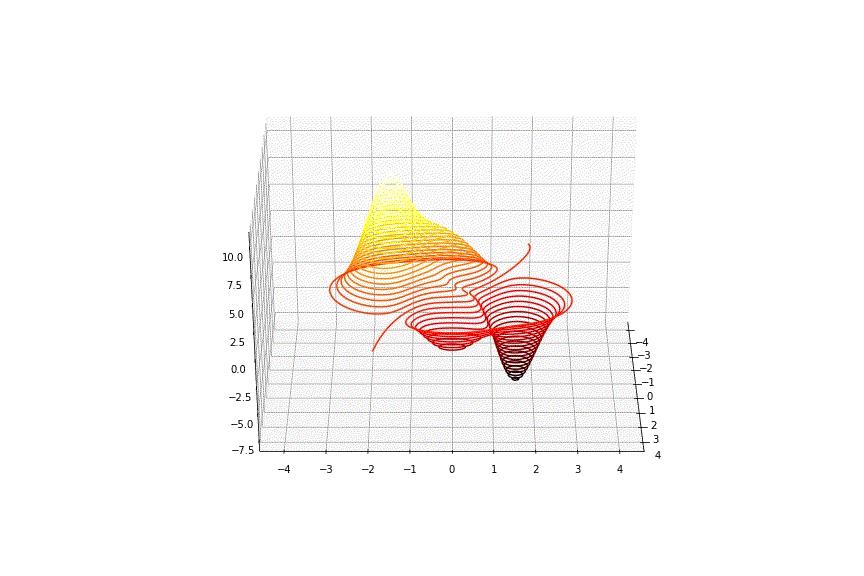
▲ 图 contour3D

▲ 图 contour3D
ax.contour3D(x,y,ff, 100, cmap=plt.cm.hot)
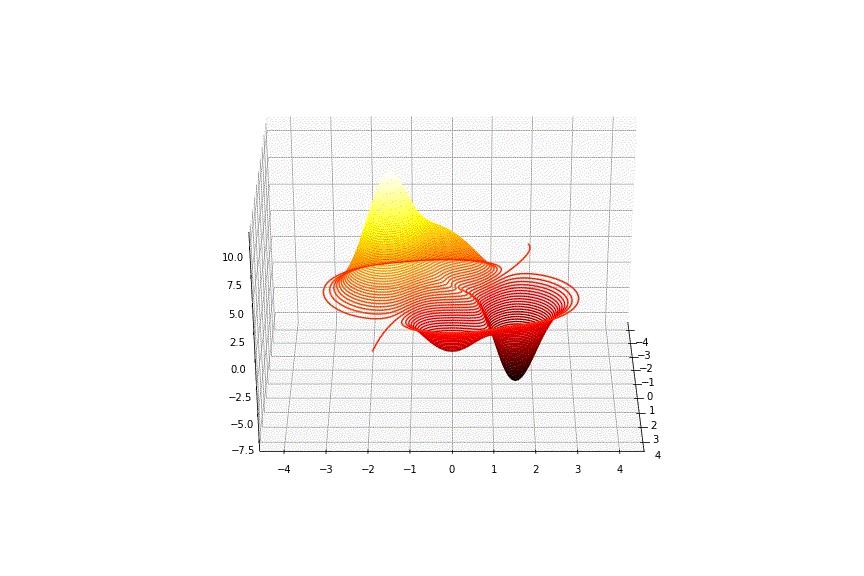
▲ 图 contour3D
※ 总结 ※
利用3D曲面显示可以更好的将三维函数性能可视化展示。利用view_init()设置不同的视角,动态显示曲面的不同方面。
● 相关图表链接:
以上是关于通过一个函数对比 mgrid以及meshgrid函数的主要内容,如果未能解决你的问题,请参考以下文章