R基础学习-- 简单练习(shiny+mysql+barplot)
Posted MemoBlog
tags:
篇首语:本文由小常识网(cha138.com)小编为大家整理,主要介绍了R基础学习-- 简单练习(shiny+mysql+barplot)相关的知识,希望对你有一定的参考价值。
测试环境:win10+RStudio
提前准备:
install.packages(\'shiny\')
install.packages(\'Rmysql\')
数据表准备:
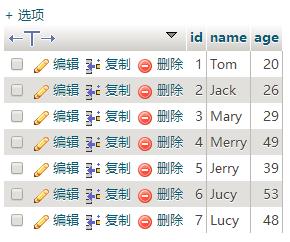
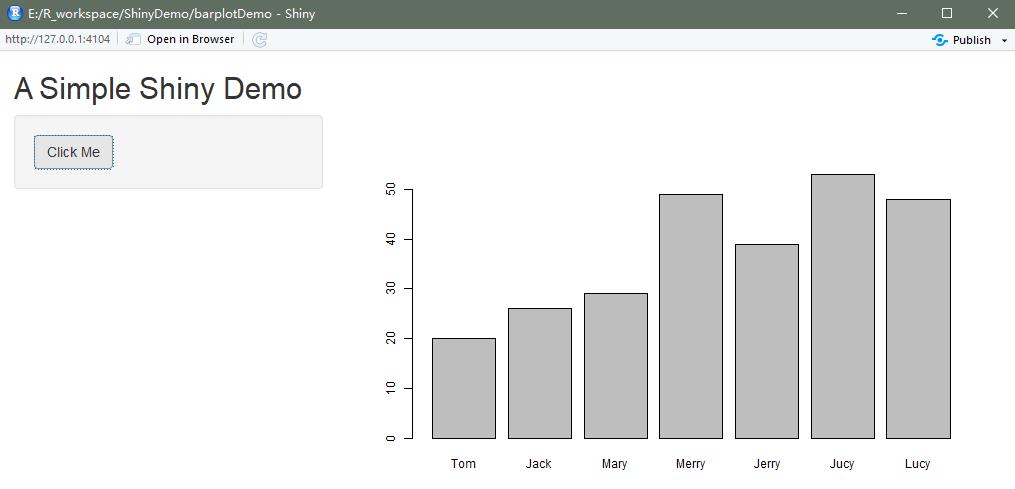
最终实现的界面效果如下:点击【Click Me】按钮,从数据库读出数据,并在界面画出条形图
正式开始!
在R项目(比如ShinyDemo)的目录下新建一个文件夹barplotDemo
然后在这个目录下新建两个文件,ui.R和server.R
ui.R的代码实现如下
library(shiny)

# Use a fluid Bootstrap layout
fluidPage(
  # Give the page a title
  titlePanel("A Simple Shiny Demo"),

  # Generate a row with a sidebar
  sidebarLayout(
    # Define the sidebar with one input
    sidebarPanel(
      actionButton("do", "Click Me")
    ),

    # Create a spot for the barplot
    mainPanel(
      plotOutput("dataPlot")
    )
 )
)
server.R的代码如下:
library(RMySQL)

# Define a server for the Shiny app
function(input, output) {
  observeEvent(input$do, {
   # connect the database
    conn <- dbConnect(MySQL(), dbname = "test", username="root", password="123456",client.flag=CLIENT_MULTI_STATEMENTS)
    users = dbGetQuery(conn, "SELECT * FROM tb_user")
    dbDisconnect(conn)
    output$dataPlot <- renderPlot({
      vAge<-as.vector(unlist(users[3]))
      vName<-as.vector(unlist(users[2]))
      height<-vAge
      names(height)<-vName
      barplot(height)
    })
  })
}
备注:
(1)observeEvent(input$do, { }) 是按钮监听处理
(2)barplot的【height】要么是向量要么是矩阵,而users是list,所以需要进行处理,可以在Console查看数据类型
> is.vector(users)
[1] FALSE
> is.array(users)
[1] FALSE
> mode(users)
[1] "list"
> vAge<-as.vector(unlist(users[3]))
> mode(vAge)
[1] "numeric"
> vAge
[1] 20 26 29 49 39 53 48
> vName<-as.vector(unlist(users[2]))
> mode(vName)
[1] "character"
> vName
[1] "Tom"   "Jack"  "Mary"  "Merry" "Jerry" "Jucy"  "Lucy"
上面两个R文件写好代码之后,在Console执行,记得在文件夹名字两侧加引号
> runApp(\'barplotDemo\')
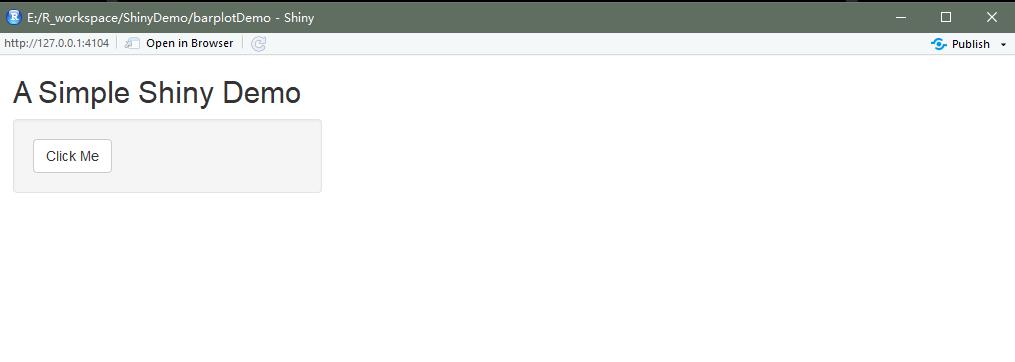
运行成功后,可以看到效果如下:
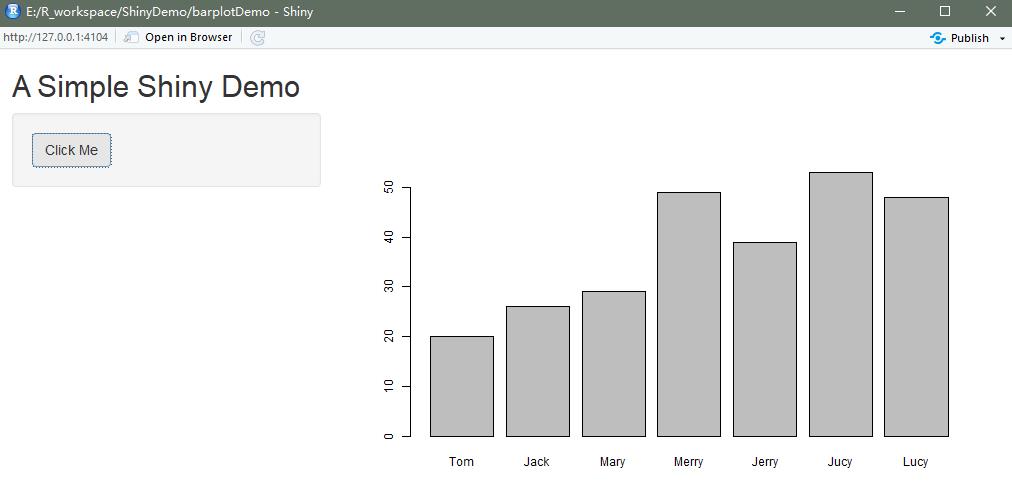
点击【Click Me】,可以看到条形图
到此结束~
以上是关于R基础学习-- 简单练习(shiny+mysql+barplot)的主要内容,如果未能解决你的问题,请参考以下文章