MySQL分析数据运行状态利器SHOW PROCESSLIST
Posted SHIHUC
tags:
篇首语:本文由小常识网(cha138.com)小编为大家整理,主要介绍了MySQL分析数据运行状态利器SHOW PROCESSLIST相关的知识,希望对你有一定的参考价值。
这个博文,将只是简单的记录一下,我们的数据库操作和使用中,加索引加不上去,分析的过程,其实比较简单,就是看有没有连接进程还在操作表。有的话,将其停掉(不影响业务的场景下)。
今天的主角是:
SHOW [FULL] PROCESSLIST
官方文档的描述如下:
SHOW PROCESSLIST shows you which threads are running. You can also get this information from the
INFORMATION_SCHEMA PROCESSLIST table or the mysqladmin processlist command. If you have
the PROCESS privilege, you can see all threads. Otherwise, you can see only your own threads (that is,
threads associated with the MySQL account that you are using). If you do not use the FULL keyword, only
the first 100 characters of each statement are shown in the Info field.
意思就是说上述指令是用来查看那些线程正在运行,你也可以得到这些信息,从INFORMATION_SCHEMA PROCESSLIST这个表,或者通过mysqladmin processlist指令。如果你有PROCESS权限,你可以查看所有的线程。否则,你只能查看你自己当前账户的线程。如果你没有使用FULL关键字,你只能查看每个记录中Info字段里面的前100个字符。
具体操作:
mysql> show processlist;
ERROR 2006 (HY000): MySQL server has gone away
No connection. Trying to reconnect...
Connection id:    46661
Current database: advsql

+-------+-----------+-------------------+--------+---------+-------+-------+------------------+
| Id    | User      | Host              | db     | Command | Time  | State | Info             |
+-------+-----------+-------------------+--------+---------+-------+-------+------------------+
| 46586 | tkcssuser | 10.90.13.61:55838 | tkcss  | Sleep   |    42 |       | NULL             |
| 46660 | tkcssuser | 10.90.13.8:52008  | tkcss  | Sleep   | 11041 |       | NULL             |
| 46661 | root      | localhost         | advsql | Query   |     0 | init  | show processlist |
+-------+-----------+-------------------+--------+---------+-------+-------+------------------+
3 rows in set (0.01 sec)
通过查询information_schema的processlist表:
mysql> select * from information_schema.processlist;
+-------+-----------+-------------------+--------+---------+-------+-----------+----------------------------------------------+
| ID    | USER      | HOST              | DB     | COMMAND | TIME  | STATE     | INFO                                         |
+-------+-----------+-------------------+--------+---------+-------+-----------+----------------------------------------------+
| 46661 | root      | localhost         | advsql | Query   |     0 | executing | select * from information_schema.processlist |
| 46586 | tkcssuser | 10.90.13.61:55838 | tkcss  | Sleep   |   279 |           | NULL                                         |
| 46660 | tkcssuser | 10.90.13.8:52008  | tkcss  | Sleep   | 11578 |           | NULL                                         |
+-------+-----------+-------------------+--------+---------+-------+-----------+----------------------------------------------+
3 rows in set (0.00 sec)
或者mysqladmin processlist指令:
[root@localhost ~]# mysqladmin processlist -u root -p
Enter password:
+-------+-----------+-------------------+--------+---------+-------+-------+------------------+
| Id    | User      | Host              | db     | Command | Time  | State | Info             |
+-------+-----------+-------------------+--------+---------+-------+-------+------------------+
| 46586 | tkcssuser | 10.90.13.61:55838 | tkcss  | Sleep   | 138   |       |                  |
| 46660 | tkcssuser | 10.90.13.8:52008  | tkcss  | Sleep   | 12037 |       |                  |
| 46661 | root      | localhost         | advsql | Sleep   | 459   |       |                  |
| 46662 | root      | localhost         |        | Query   | 0     | init  | show processlist |
+-------+-----------+-------------------+--------+---------+-------+-------+------------------+
关于这个命令的价值,官方的介绍如下:
The SHOW PROCESSLIST statement is very useful if you get the “too many connections” error message
and want to find out what is going on. MySQL reserves one extra connection to be used by accounts that
have the SUPER privilege, to ensure that administrators should always be able to connect and check the
system (assuming that you are not giving this privilege to all your users).

Threads can be killed with the KILL statement.
运行的线程,可以通过KILL指令将其杀掉。这个信息非常重要。
这里,可以看到SHOW PROCESSLIST指令里面的输出内容,有几个字段,下面给予解释说明,只有搞清楚了这些字段的含义,才对我们的实际项目问题分析才有价值:
- Id:
The connection identifier. This is the same type of value displayed in the ID column of the
INFORMATION_SCHEMA.PROCESSLIST table, the PROCESSLIST_ID column of the Performance
Schema threads table, and returned by the CONNECTION_ID() function. - User:
The MySQL user who issued the statement. If this is system user, it refers to a nonclient thread
spawned by the server to handle tasks internally. This could be the I/O or SQL thread used on replication
slaves or a delayed-row handler. unauthenticated user refers to a thread that has become
associated with a client connection but for which authentication of the client user has not yet been done.
event_scheduler refers to the thread that monitors scheduled events. For system user, there is no
host specified in the Host column. - Host:
The host name of the client issuing the statement (except for system user where there is no host).
SHOW PROCESSLIST reports the host name for TCP/IP connections in host_name:client_port
format to make it easier to determine which client is doing what. - db:
The default database, if one is selected, otherwise NULL.
- Command:
The type of command the thread is executing. 例如上面的例子中,Sleep,或者Query
- Time:
The time in seconds that the thread has been in its current state. For a slave SQL thread, the value is
the number of seconds between the timestamp of the last replicated event and the real time of the slave
machine. - State:
Most states correspond to very quick operations. If a thread stays in a given state for many seconds,
there might be a problem that needs to be investigated.
An action, event, or state that indicates what the thread is doing.
- Info:
The statement the thread is executing, or NULL if it is not executing any statement. The statement might
be the one sent to the server, or an innermost statement if the statement executes other statements. For
example, if a CALL statement executes a stored procedure that is executing a SELECT statement, the
Info value shows the SELECT statement.
上述信息的解释当中,对于我们分析问题,尤为重要的是Id,Host,Time,State以及Info字段。这几个当中,第一眼能让我们看出问题的是Time,State和Info字段。我们若想看得更详细的Info字段,请用SHOW FULL PROCESSLIST指令。注意前面的命令解释内容。
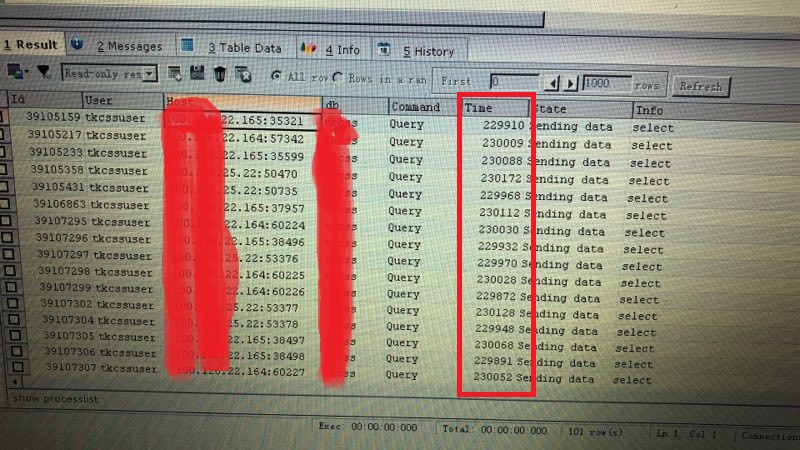
我们线上的一个问题,就是加索引加不上去,我们将应用停掉还是加不上去,通过SHOW PROCESSLIST指令,发现有好多线程Command处于Query状态。最长的Time字段显示达到230172seconds,换算成小时,都63个小时,见鬼啊!!!!(这个地方有疑问)
为了解决问题,立即调用KILL指令,前面介绍时提到的。
KILL [CONNECTION | QUERY] processlist_id
官方介绍:
Each connection to mysqld runs in a separate thread. You can kill a thread with the KILL
processlist_id statement.
参数中的processlist_id,来源于show processlist结果列表中的id字段。
kill指令支持两个可选参数,CONNECTION以及QUERY。
• KILL CONNECTION is the same as KILL with no modifier: It terminates the connection associated with
the given processlist_id, after terminating any statement the connection is executing.
• KILL QUERY terminates the statement the connection is currently executing, but leaves the connection
itself intact.
很简单,connection选项,kill的时候,将连接也断掉,而query选项,kill的过程只是将该指令杀掉,连接还保持。 kill指令不指定connection或者query选项时,默认是connection。
到此,今天要介绍的MySQL的查看数据运行连接状态的内容到此结束。
最后补充一点的是,前面提到的“这个地方有疑问”,真是有疑问,我们的应用3台服务器,6个tomcat应用,全部杀进程停掉了,为何最终SHOW PROCESSLIST里面还会出现有正在运行的QUERY,而且time都是20多万秒,难道一个select要查几天?如下图:

我们的应用在3天内,两个晚上,每天都会杀掉应用,做版本更新操作,怎么说,select也不会出现20多万秒吧?有谁能帮忙分析下,我的怀疑是这些被show processlist查出来的进程,在执行query的时候,MySQL内部发生死锁导致的,数据状态显示这个查询一直在,没有结束,因为死锁,若不杀进程,那个Time显示的时间将会更长。。。
还请高手帮忙分析或者给予一些线索。
以上是关于MySQL分析数据运行状态利器SHOW PROCESSLIST的主要内容,如果未能解决你的问题,请参考以下文章