本文主要记录如何使用 svg.js 实现对图形的拖拽,选择,图像渲染及各类形状的绘制操作。
1、关于SVG
SVG 是可缩放的矢量图形,使用XML格式定义图像,可以生成对应的DOM节点,便于对单个图形进行交互操作。比CANVAS更加灵活一点。关于SVG的基础知识,请参考SVG学习地址。
2、SVG.js
今天要说的主角是 SVG.js,它是对SVG本身的一个封装库,提供各种API使对SVG的使用更加方便,相当于JQuery对于JS,它的自我介绍是 轻量级,速度快,更具易读性。SVG.js官网介绍的很详细,不过这里还是简单的进行一些汇总。
2.1 初始化
<div id="svgDemo"></div>
this.draw = SVG("svgDemo").size("100%", "100%");
SVG(domId)初始化dom结点。转成svg元素size()是svg.js中的改变画板大小的方法,其中参数可以是像素:size(\'100px\', \'100px\');,也可以是百分比size(\'100%\', \'100%\');
2.2 一些基本形状
如图所示,我们可以很快速的绘制出一些基本图形。具体的API详见对应的代码块。

// 画线
let line = this.draw
.line(10, 10, 10, 150) // 起点xy,终点xy
.stroke({ width: 5, linecap: "round", color: "blue" }); // 线条样式

// 画矩形
let rect = this.draw
.rect(100, 100) // 宽高
.radius(10) // 圆角
.fill("red") //填充
.move(20, 20); // 位移

// 画圆
let circle = this.draw
.circle(100) // 圆直径
.fill("green")
.move(130, 20);

// 画椭圆
let ellipse = this.draw
.ellipse(150, 100) // 宽直径,高直径
.move(240, 20)
.fill("pink");

// 折线
let polyline = this.draw
.polyline(\'450, 10, 400, 100, 500, 100\') // 点的位置,也可以使用数组替换[[450,10],[400,100],[500,100]]
.fill("#f06")
.stroke({ width: 1, color: "black" });

// 多边形
let polygon = this.draw.polygon([[550,10],[600,10],[630,50],[600,100],[550,100],[520,50]]) // 点的位置
.fill("#71f5ea")
.stroke({ width: 1 });
3、实现效果
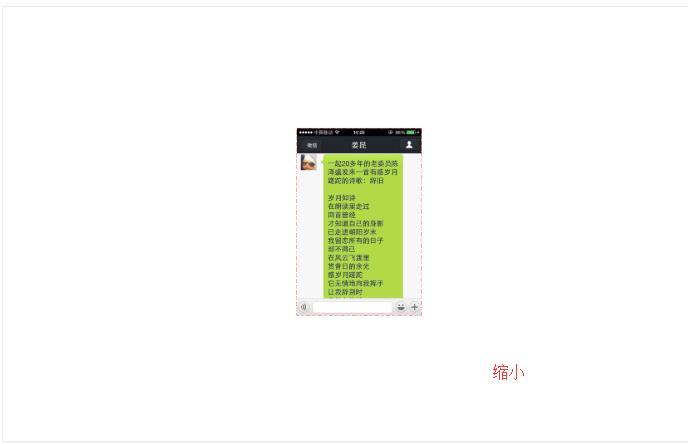
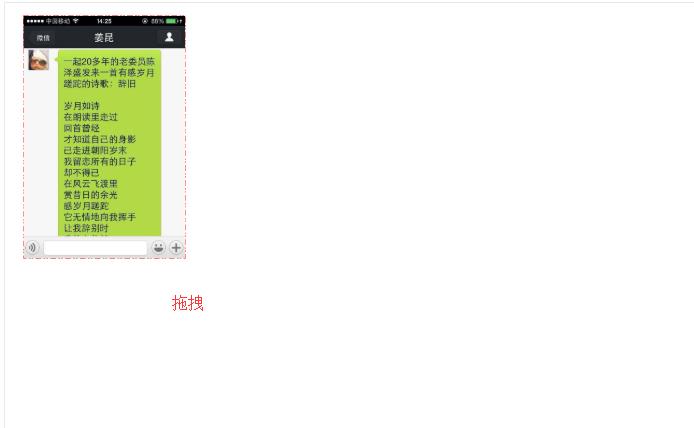
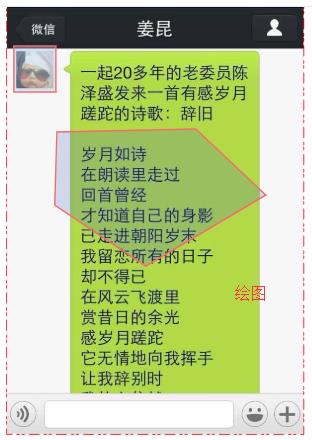
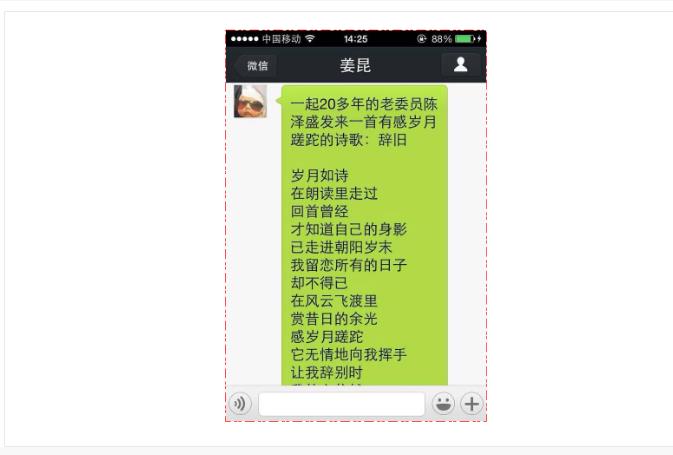
介绍了简单的使用方法,现阐述如何使用 svg.js 及对应的一些拓展插件,实现对图片的标注操作。效果如下,我们可以对图片进行放大、缩小、拖拽操作,也可以在图片上绘制不同的图形。当鼠标放在图片上时,会出现辅助线。(图片源于网络)
-
图片缩小效果
-
图片放大效果

-
图片拖拽效果
-
在图片上绘制图形效果
3.1 绘制图像
这里说一下,下面的代码只是粘贴出核心的代码。并不能直接粘贴复制实现效果。
{
    //...省略代码
    let that = this;
    this.mainImage = this.draw
    .image(imgurl)
    .loaded(function(loader) {
        // 图片加载后,设置图片大小
        this.size(loader.width, loader.height);

        // 绘制一个图形组合,之后的图形都在这个组合上操作
        that.drawGroup = that.draw.group();

        // 给图形组合加边框
        let borderRect = that.drawGroup
        .rect(loader.width, loader.height)
        .stroke(DemoSet.imageBorder) // DemoSet下都是一些配置项,这里不再罗列。
        .fill("none");

        // 给图形组合加辅助线,只有鼠标移入地时候才显示,先绘制dom
        that.lineX = that.drawGroup.line(0, 0, 0, 0).stroke(DemoSet.imageLine);
        that.lineY = that.drawGroup.line(0, 0, 0, 0).stroke(DemoSet.imageLine);

        // 将图像也放入组合中
        that.drawGroup.add(this).attr(DemoSet.groupId);

        // 使图像组合可以放大缩小
        that.groupZoom = that.drawGroup.panZoom(DemoSet.zoomOpt);

        // 鼠标移动事件
        that.drawGroup.on("mousemove", that.mousemoveEvt, that);

        // 鼠标移出事件
        that.drawGroup.on("mouseleave", that.mouseleaveEvt, that);

        // 鼠标点下
        that.drawGroup.on("mousedown", that.mousedownEvt, that);

        // 鼠标松开
        that.drawGroup.on("mouseup", that.mouseupEvt, that);
    });
}
代码解释:
image(url):在svg上绘制图片loaded((loader)=>{}):图片加载成功后的回调事件,loader参数返回的是图像的信息,包括宽、高、链接group():绘制一个图形组合panZoom():需引入 svg.pan-zoom.js 插件(npm install svg.pan-zoom.js -- save-dev),实现滚动鼠标,放大缩小图形transform():可以获取图形移动和放大缩小的位置setPosition(x, y, scale):x,y表示位置,scale表示缩放比例
on(eventname,event,context)事件绑定,eventname:事件名,event:事件,context:上下文
3.2 绘制指示参考线
鼠标在图片上移动的时候,会显示提示的参考线,这样更加方便绘制图形。
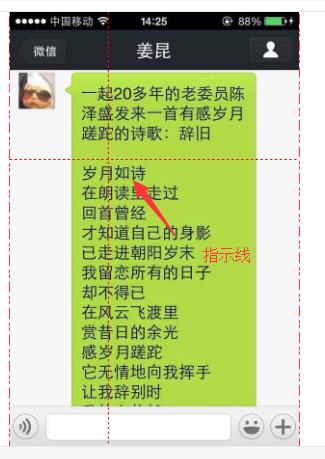
{
    //...省略代码
    // mousemove事件
    // getPointer()这是获取点的位置的方法,不是API
    let { zx, zy } = this.getPointer(e);
    // 获取图片的宽高
    let w = this.mainImage.width();
    let h = this.mainImage.height();
    // 画线
    this.lineX.front().plot(0, zy + 1, w, zy + 1);
    this.lineY.front().plot(zx + 1, 0, zx + 1, h);
}
front():表示在组合里显示置前plot():图形移动绘制
3.3 绘制图形
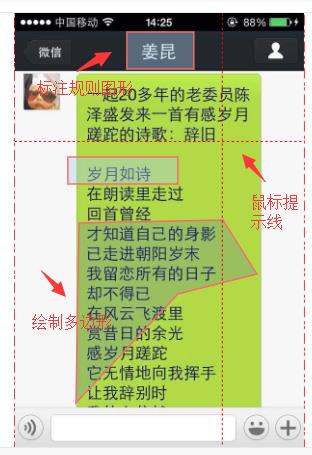
/**
 * 绘制移动的矩形
 */
//...省略代码
let currentDraw = this.currentDraw;
if (!currentDraw) {
    this.currentDraw = this.drawGroup
    .rect(0, 0)
    .move(x, y) // 这里的xy表示矩形的位置
    .fill(OcrSet.rect)
    .stroke(OcrSet.rectStroke)
    .attr({ id: id });
} else {
    let width = Math.abs(zx - x),
    height = Math.abs(zy - y),
    mx = Math.min(zx, x),
    my = Math.min(zy, y); // zx,zy表示移动的鼠标的位置
    this.currentDraw.size(width, height).move(mx, my);
}
/**
 * 绘制多边形-过程
 */
//...省略代码
let currentDraw = this.currentDraw;
if (!currentDraw) {
    points.push([zx, zy]); // points表示当前多边形的点
    this.currentDraw = this.drawGroup
    .polygon(points)
    .fill(OcrSet.polygo)
    .stroke(OcrSet.rectStroke)
    .attr({ id: id });
} else {
    points = this.currentDraw.array().value.slice(0);
    points.push([zx, zy]);
    this.currentDraw.plot(points);
}
array():可以获取到多边形的点信息
3.4 图形选中拖拽事件
// 图形可拖拽
this.selectShape.draggable();

// 图形禁止拖拽
this.selectShape.draggable(false);

// 图形选中并可放大缩小
this.selectShape.selectize(OcrSet.selectOpt).resize();

// 图形去除选中并禁止放大缩小
this.selectShape.selectize(false, { deepSelect: true }).resize("stop");


// 图形位置修改后的事件
this.selectShape.on("resizedone", function() {
  ...
});

// 图形拖拽后的事件
this.selectShape.off("dragend").on("dragend", function(e) {
    ...
});
- 图形拖拽:需引入 svg.draggable.js 插件(
npm install svg.draggable.js -- save-dev),实现图形的拖拽draggable(boolean):支持拖拽,当boolean是false的时候禁止拖拽;dragend():拖拽后的事件
- 图形选择:需引入 svg.select.js 插件(
npm install svg.select.js -- save-dev),实现图形的选择和放大缩小的操作selectize():图形变成选中状态resize(param):图形可放大缩小,当参数param是stop的时候,禁止放大缩小resizedone():图形放大缩小后的操作
补充于 2021.3.4
因有博友想知道DemoSet中的颜色或者属性配置,因此附上:
// 用于ocr的各种配置项
export default {
  // 图片的边框
  imageBorder: {
    color: "#f00",
    width: 3,
    linecap: "round",
    dasharray: "20,10,5,5,5,10",
    linejoin: "miter"
  },
  // 图片指示线
  imageLine: {
    width: 1,
    color: "#f00",
    dasharray: "5, 5"
  },
  // 选择框
  selectOpt: {
    rotationPoint: false,
    deepSelect: true
  },
  lawSelectOpt: {
    rotationPoint: false,
    deepSelect: true,
    points:[\'lt\',\'rt\',\'lb\',\'rb\']
  },
  // 放大缩小参数
  zoomOpt: {
    zoom: [0.05, 10]
  },
  zoomOpt2: {
    zoomEnabled: true,
    maxZoom: 3,
    minZoom: 0.1
  },
  // 中间图片的id
  groupId: {
    id: "ocrDrawGroup"
  },
  // 正在绘制的矩形
  rect: {
    color: \'#abcdef\',
    opacity: 0.6
  },
  // 多边形样式
  polygo: {
    color: "#3656bf",
    opacity: 0.6
  },
  // 矩形边框
  rectStroke: {
    color: "#f56c6c",
    width: 1,
    linecap: "round",
    linejoin: "miter",
    opacity: 0.4
  },
  drawHeight: "434px",
  areaHeight: "134px"
}