验证Oracle收集统计信息参数granularity数据分析的力度
Posted
tags:
篇首语:本文由小常识网(cha138.com)小编为大家整理,主要介绍了验证Oracle收集统计信息参数granularity数据分析的力度相关的知识,希望对你有一定的参考价值。
最近在学习Oracle的统计信息这一块,收集统计信息的方法如下:
DBMS_STATS.GATHER_TABLE_STATS (
ownname VARCHAR2, ---所有者名字
tabname VARCHAR2, ---表名
partname VARCHAR2 DEFAULT NULL, ---要分析的分区名
estimate_percent NUMBER DEFAULT NULL, ---采样的比例
block_sample BOOLEAN DEFAULT FALSE, ---是否块分析
method_opt VARCHAR2 DEFAULT ‘FOR ALL COLUMNS SIZE 1’,---分析的方式
degree NUMBER DEFAULT NULL, ---分析的并行度
granularity VARCHAR2 DEFAULT ‘DEFAULT’, ---分析的粒度
cascade BOOLEAN DEFAULT FALSE, ---是否分析索引
stattab VARCHAR2 DEFAULT NULL, ---使用的性能表名
statid VARCHAR2 DEFAULT NULL, ---性能表标识
statown VARCHAR2 DEFAULT NULL, ---性能表所有者
no_invalidate BOOLEAN DEFAULT FALSE, ---是否验证游标依存关系
force BOOLEAN DEFAULT FALSE); ---强制分析,即使锁表
本文主要对参数granularity进行了一下验证,
granularity:数据分析的力度
--global ---全局
--partition ---只在分区级别做分析
--subpartition --只在子分区级别做分析
验证步骤如下:
一、创建一个分区表并插入两条数据,同时在字段ID上创建索引
drop table test purge;
create table test(id number) partition by range(id)
(partition p1 values less than (5),
partition p2 values less than (10)
) ;
insert into test values(1);
insert into test values(6);
commit;
create index ind_id on test(id);
二、收集表的统计信息
exec dbms_stats.gather_table_stats(user,‘TEST‘,cascade=>true);
三、查询表的统计信息
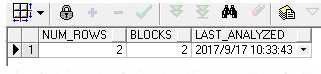
select num_rows,blocks,last_analyzed from user_tables where table_name = ‘TEST‘;
结果如下:
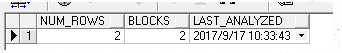
num_rows:表数据行数
blocks:数据块数
last_analyzed:最近分析时间
四、查询表分区信息
select partition_name,num_rows,blocks,last_analyzed from dba_tab_partitions where table_name =‘TEST‘;
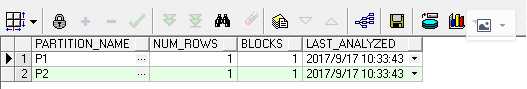
PARTITION_NAME:分区名称
NUM_ROWS:数据行数
BLOCKS:数据块数
last_analyzed:最近分析时间
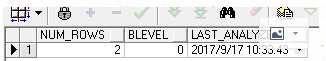
五、查询索引统计信息
select num_rows,blevel,last_analyzed from user_indexes where index_name = ‘IND_ID‘;
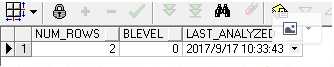
num_rows:索引数据行数
blevel:索引高度
last_analyzed:分析时间
六、新增一个分区
alter table test add partition pmax values less than(maxvalue);
七、往新的分区中插入10000条数据
begin for i in 1..10000 loop ---插入10000条数据
insert into test values(100);
end loop;
commit;
end;
八、创建一个倾斜度非常大的分区
update test set id=10000 where id=100 and rownum=1; ---创造一个非常倾斜的Pmax分区
Commit;
九、查询分区数据
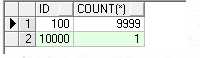
select id,count(*) from test partition(pmax) group by id;
十、不做分析,再次查询表的统计信息
select num_rows,blocks,last_analyzed from user_tables where table_name = ‘TEST‘;
发现数据行数量和数据块数量没有发现变化
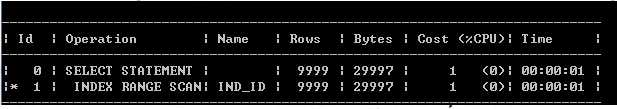
十一、查询id=100时执行计划
set autotrace traceonly
set linesize 1000
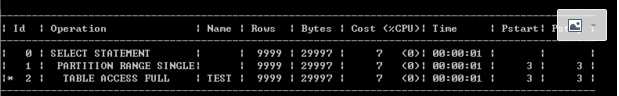
select * from test where id=100;
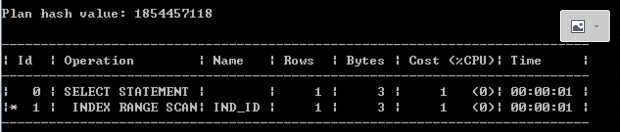
发现走了索引,正常情况下,因为id=100的数据在一个倾斜度非常高的分区pmax中,id为100的数据有9999条,走索引的代价会比走全表的代价还要高(因为走索引需要回表),如果统计信息正确,优化器应该会选择走全表,但是这里没走全表而是走了索引,这里怀疑是统计信息不正确导致,后面验证
十二、收集分区统计信息
exec dbms_stats.gather_table_stats(user,‘TEST‘,partname => ‘PMAX‘,granularity => ‘PARTITION‘);
十三、再次查询表的统计信息和分区统计信息
select partition_name,num_rows,blocks,last_analyzed from dba_tab_partitions where table_name =‘TEST‘;
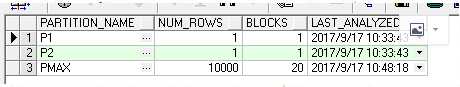
发现和步骤四比较,分区信息有了变化,说明对分区进行统计信息收集后,分区信息进行了更新
select num_rows,blocks,last_analyzed from user_tables where table_name = ‘TEST‘;
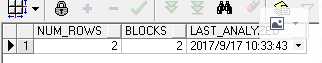
发现和步骤三想比,表的统计信息并没有发生变化,说明统计了分区信息后,表的统计信息么有更新
十四、再次查询id=100的数据
仍然走索引,说明在评估查询的时候,表的统计信息依然陈旧
十五、查询索引的统计信息
select num_rows,blevel,last_analyzed from user_indexes where index_name = ‘IND_ID‘;
发现索引统计信息较步骤五没有变化,说明收集了分区的统计信息后,表的索引信息没有更新
十六、重新再次收集表的统计信息
exec dbms_stats.gather_table_stats(user,‘TEST‘,cascade =>true);
十七、查询表的统计信息以及索引的统计信息
select num_rows,blocks,last_analyzed from user_tables where table_name = ‘TEST‘;
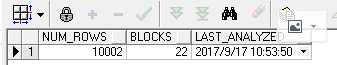
表的统计信息已经更新
select num_rows,blevel,last_analyzed from user_indexes where index_name = ‘IND_ID‘;
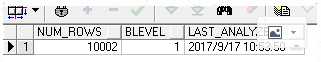
索引的统计信息也已经更新
十八、再次查询id=100的执行计划
这次发现走了全表,说明收集了全局的统计信息后,表的统计信息准确了,评估也就准确了。
以上是关于验证Oracle收集统计信息参数granularity数据分析的力度的主要内容,如果未能解决你的问题,请参考以下文章