数据集笔记:Uber Movement (Speed)python 处理数据集至时空矩阵
Posted UQI-LIUWJ
tags:
篇首语:本文由小常识网(cha138.com)小编为大家整理,主要介绍了数据集笔记:Uber Movement (Speed)python 处理数据集至时空矩阵相关的知识,希望对你有一定的参考价值。
Uber Movement: Let's find smarter ways forward, together.
以伦敦威斯敏斯特的一个小区域为例
1 导入库
import osmnx as ox
import pandas as pd
2 读入数据
这里选取了6个月的数据
df1=pd.read_csv('movement-speeds-hourly-london-2019-10.csv.zip')
df2=pd.read_csv('movement-speeds-hourly-london-2019-11.csv.zip')
df3=pd.read_csv('movement-speeds-hourly-london-2019-12.csv.zip')
df4=pd.read_csv('movement-speeds-hourly-london-2020-1.csv.zip')
df5=pd.read_csv('movement-speeds-hourly-london-2020-2.csv.zip')
df6=pd.read_csv('movement-speeds-hourly-london-2020-3.csv.zip')
合并成一块
df=pd.concat([df1,df2,df3,df4,df5,df6])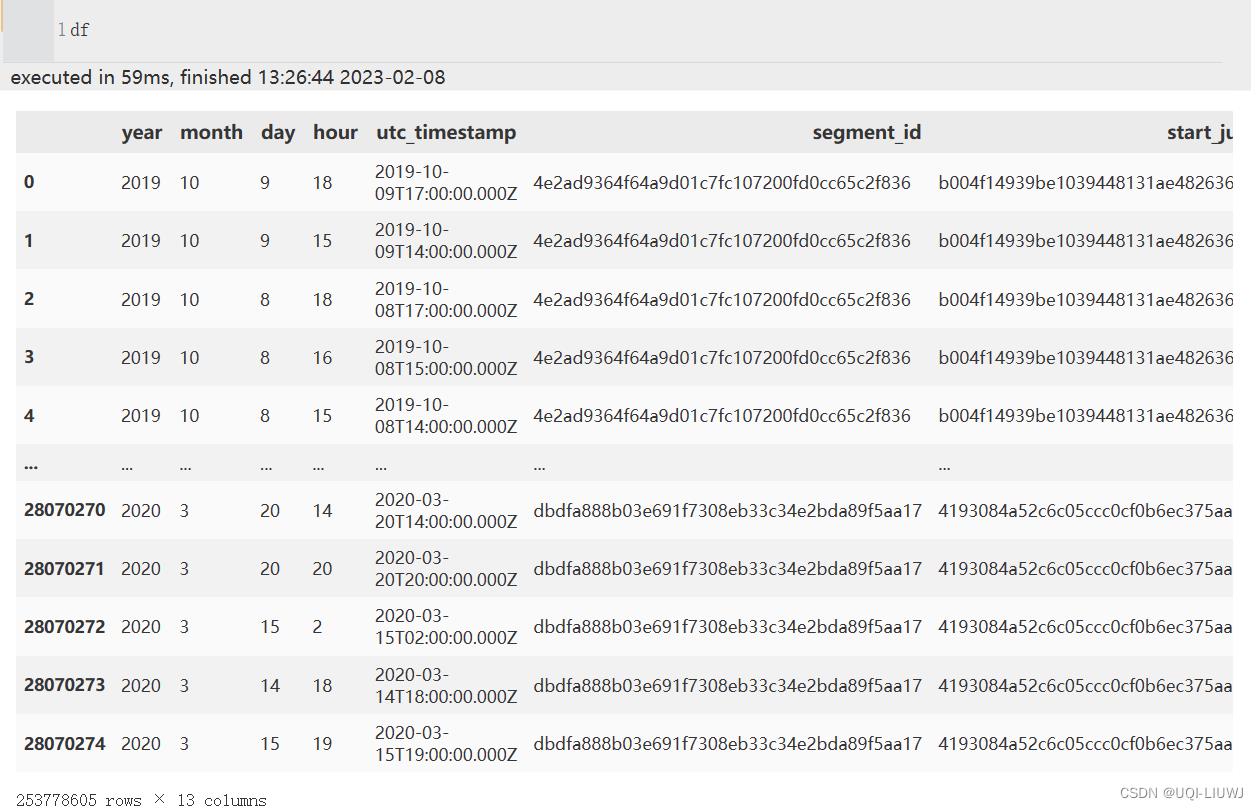
3 导入提取区域的open street map
G1=ox.graph_from_point((51.499998, -0.1333328), dist=500,network_type='drive')
ox.plot.plot_graph(G1)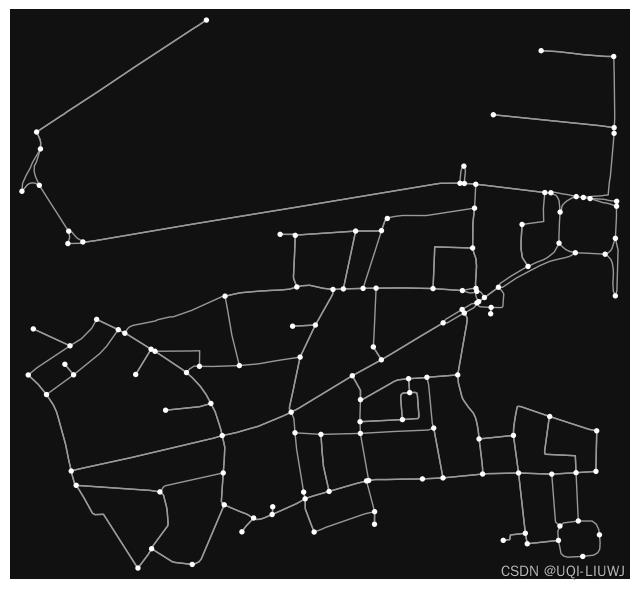
这是威斯敏斯特的一小部分:
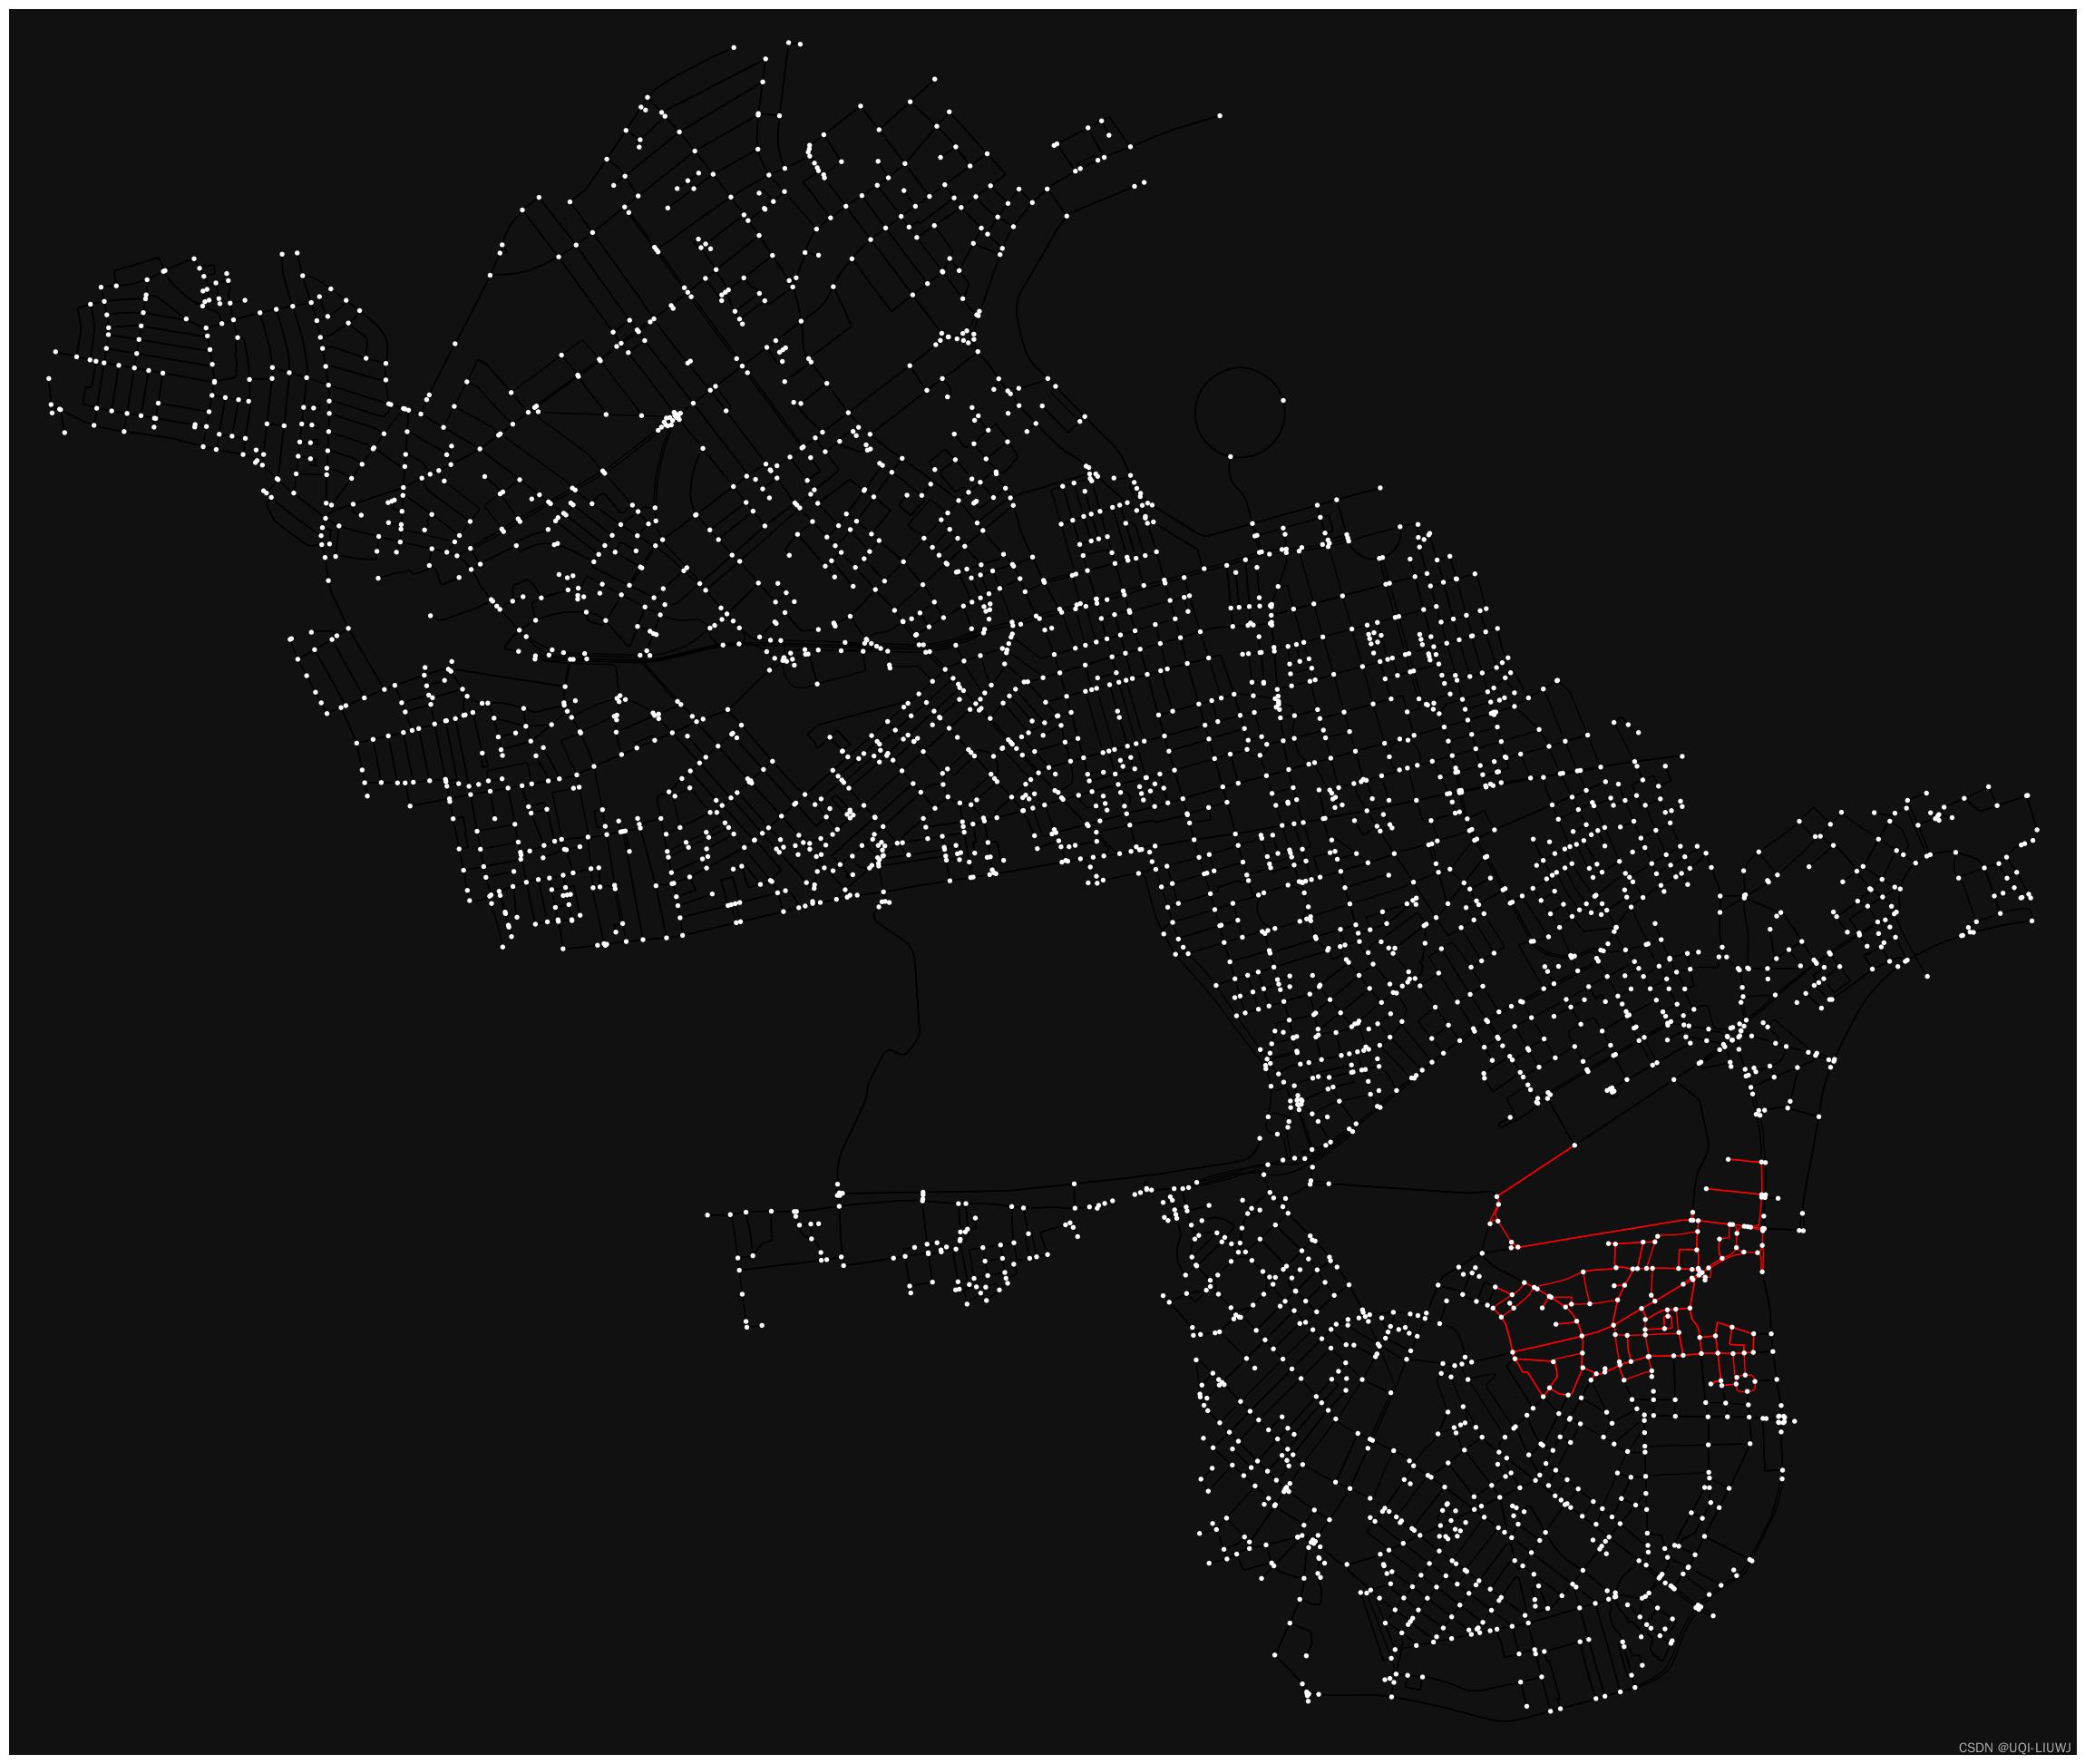
edge_color_lst=[]
G2 = ox.graph_from_place('Westminster', network_type='drive')
for i in G2.edges():
    if i in G1.edges:
        edge_color_lst.append('red')
    else:
        edge_color_lst.append('black')
ox.plot.plot_graph(G2,edge_color=edge_color_lst,figsize=(100,25))
3.1 从OpenStreeetMap中提取 node和edge的GeoDataFrame
nodes, edges = ox.graph_to_gdfs(G1, nodes=True, edges=True)
nodes
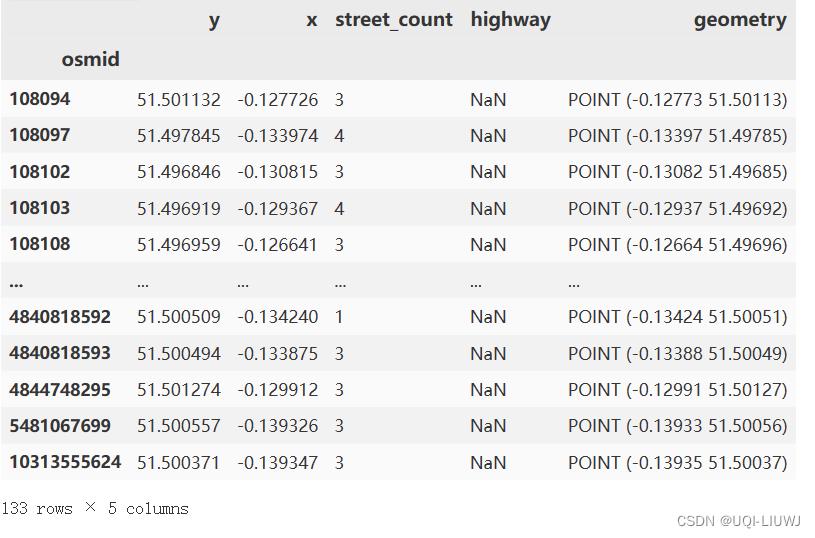
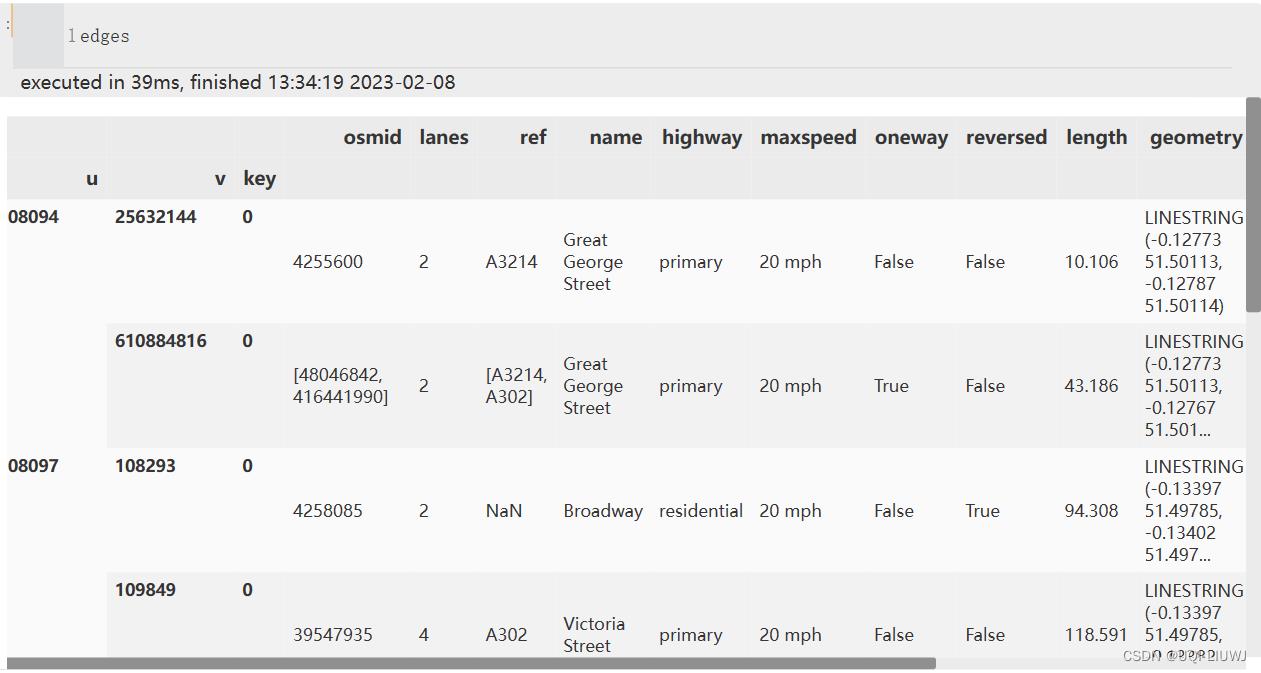
nodes['osmid'] = nodes.index.values
#nodes添加一列 osmid
edges['osmid'] = edges.osmid.map(lambda x: x if isinstance(x, list) else [x])
#edges的osmid都变成list
u, v, _ = list(zip(*edges.index))
'''
目前edges的index是
MultiIndex([( 108094, 25632144, 0),
( 108094, 610884816, 0),
( 108097, 108293, 0),
( 108097, 109849, 0)],
names=['u', 'v', 'key'], length=284)
上面这一行代码的作用是把u,v,key分离出来
'''
edges["u"] = u
edges["v"] = v
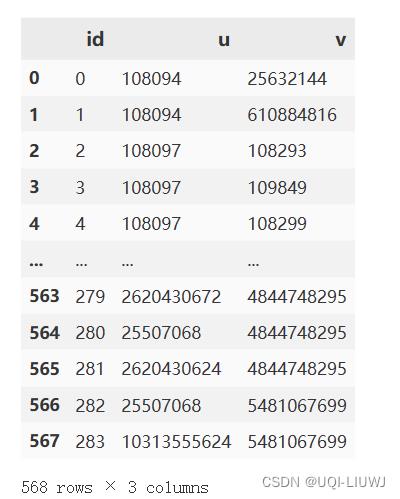
edges['id'] = np.arange(edges.shape[0])
edges.set_index('id', inplace=True, drop=False)
#将id作为edges的活跃列(从0开始的数字)3.2 获取OSM对应的邻接矩阵(边之间的邻接矩阵)
triple = pd.concat([pd.DataFrame('id': edges.id, 'u': edges.u, 'v': edges.v),
                        pd.DataFrame('id': edges.id, 'u': edges.v, 'v': edges.u)],
                       ignore_index=True)
triple
#从u射出来的边/从v射出来的边
#一条边两个方向
pairs = []
for (_, g) in triple.groupby('u'):
        pairs += [(u, v) for u in g.id for v in g.id if u != v]
for (_, g) in triple.groupby('v'):
        pairs += [(u, v) for u in g.id for v in g.id if u != v]
#同时从一个点出发\\同时到达一个点的边

G = Graph()
G.add_edges_from(pairs)
#根据点对关系确定图

import networkx as nx
nx.laplacian_matrix(G)
#获得拉普拉斯矩阵
pairs那边,做一个解释
for (a,b) in triple.groupby('u'):
    print(a)
    print('*'*100)
    print(b)
    print('*'*100)
    print(b.id)
    break
'''
108094
****************************************************************************************************
      id       u           v
0      0  108094    25632144
1      1  108094   610884816
466  182  108094    25632144
506  222  108094  1782020093
****************************************************************************************************
0        0
1        1
466    182
506    222
Name: id, dtype: int32
'''
这里把每一条边看成“新图”的“点”,如果两条边在原图中有一个共同的交点,那么他们在新图中就是相邻的点
我们分别根据射出点u和射入点v进行groupby,那么每条groupby的结果,第一项就是u/v,第二项的id就是每个点所连接的边的id。
4 根据OpenstreetMap过滤GeoDataFrame
4.1 首末节点是否在nodes里面
sdf = df[df.osm_start_node_id.isin(nodes.osmid)&df.osm_end_node_id.isin(nodes.osmid)].copy()

sdf
只选择首尾边在openstreet map 中的GeoDataFrame(可以发现item数量少了很多)

sdf.drop(["segment_id", "start_junction_id", "end_junction_id"], axis=1, inplace=True)
#丢弃这三列
4.2 首末节点和osmid,三个item唯一决定了一条路径
edgeidmap = (u, v): (osmid, edgeid) for (u, v, osmid, edgeid) in
                 zip(edges.u, edges.v, edges.osmid, edges.id)
edgeidmap
'''
(108094, 25632144): ([4255600], 0),
 (108094, 610884816): ([48046842, 416441990], 1),
 (108097, 108293): ([4258085], 2),
 (108097, 109849): ([39547935], 3),
 (108097, 108299): ([1106511807, 39547935], 4),
 (108102, 25378086): ([102950257], 5),
 (108102, 25378077): ([102950257], 6),
 (108103, 25378086): ([102950257], 7),
...
)
'''
#辅助函数:根据u和v(起止节点),判断是否有对应的osmid,有的话返回edgeid
def getedgeid(u,v,osmid):
osmid_tmp,edgeid_tmp=edgeidmap.get((u,v),[-1],-1)
#根据起止节点id,找寻对应的osmid和edgeid(如果没有返回-1)
if(osmid in osmid_tmp):
#表示起止节点id,对应的osmid三个可以唯一确定一个节点
return edgeid_tmp
#此时就返回这个节点的id
else:
return -1
'''
osmid_tmp=[-1] 表示根据起止节点找不到对应的osmid
osmid不在osmid_tmp中,三者没法确定一段edge
'''sdf['edgeid']=sdf[['osm_start_node_id', 'osm_end_node_id', 'osm_way_id']].apply(lambda x:getedgeid(*x),axis=1)
sdf = sdf[sdf.edgeid >= 0]
sdf
'''
剔除掉:
1,起止节点在edges中找不到对应的osmid
2,起止节点和osmid和edges中的这三项并不是完美匹配
'''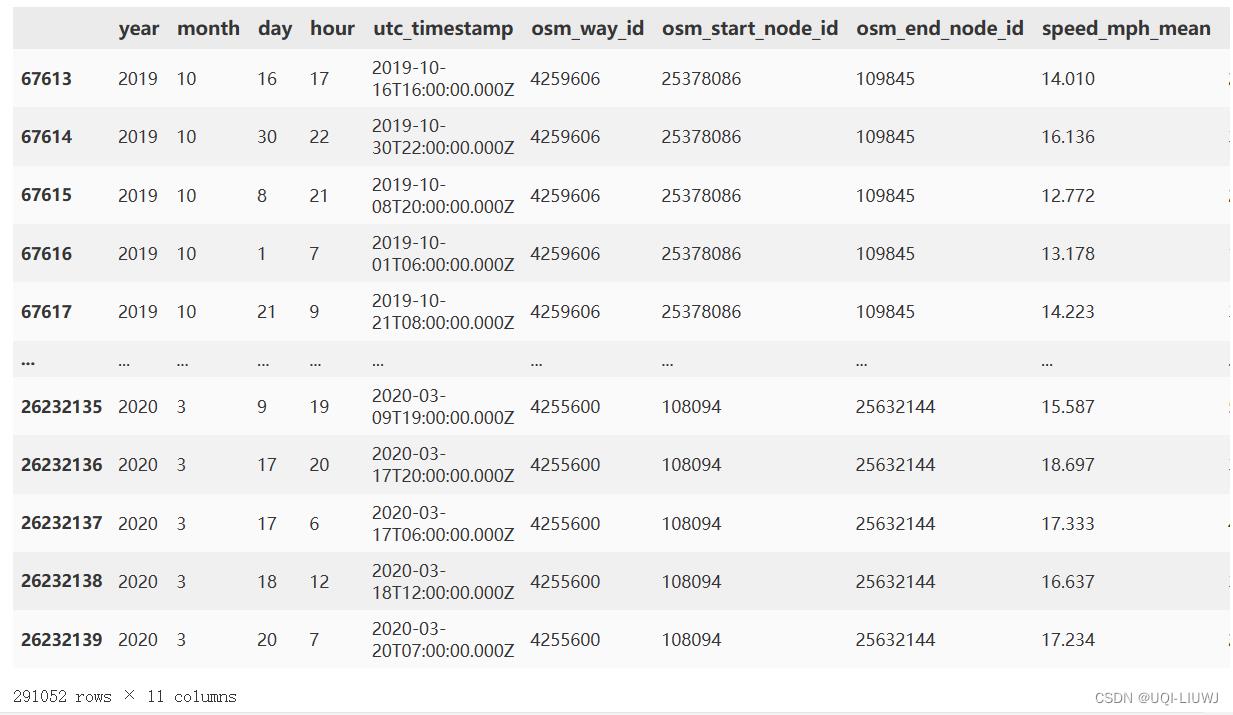
item更少了
5 转化成时空矩阵
sdf['datetime'] = sdf[['year', 'month', 'day', 'hour']].apply(lambda x: datetime(*x), axis=1)
##每一行的年月日小时合并(eg,2019-07-01 14:00:00)

sdf= sdf[['edgeid', 'datetime', 'speed_mph_mean']].set_index(['edgeid', 'datetime'])
sdf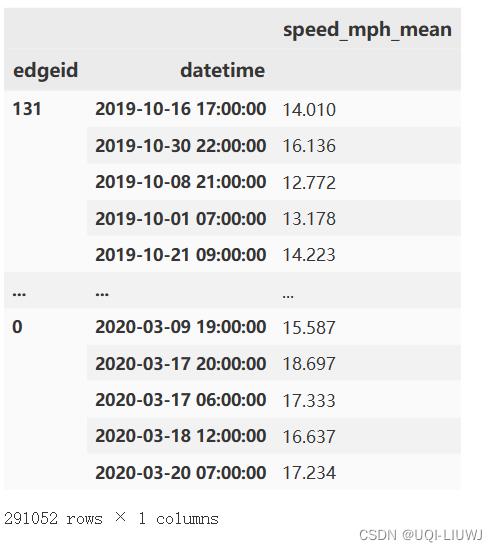
import xarray as xa
x=xa.DataArray.from_series(sdf.speed_mph_mean)
#将DataFrame的内容转换成时空矩阵
x
此时edgeid和datatime虽然都是递增的,但是此时edgeid的数量是比open street map中的要小
len(x.edgeid),edges.shape[0]
#(176, 284)

所以把缺失的边的数据用nan补进来
missed_edges = np.setdiff1d(np.arange(edges.shape[0]), x.edgeid.values)
#一直没有出现过的边id

z = xa.DataArray(np.float32(np.nan), [('edgeid', missed_edges),
                                          ('datetime', x.datetime.values)])

##一直没有出现过的边id组成的时空矩阵,数据都是NaN

x = xa.concat([x, z], dim='edgeid').rename('edgeid': 's', 'datetime': 't')
#两个DataArray 拼起来


x.sel(s=np.arange(edges.shape[0]))
##上面虽然合并了,但是edgeid的顺序不是从小到大排的,这里sel相当于重新排序 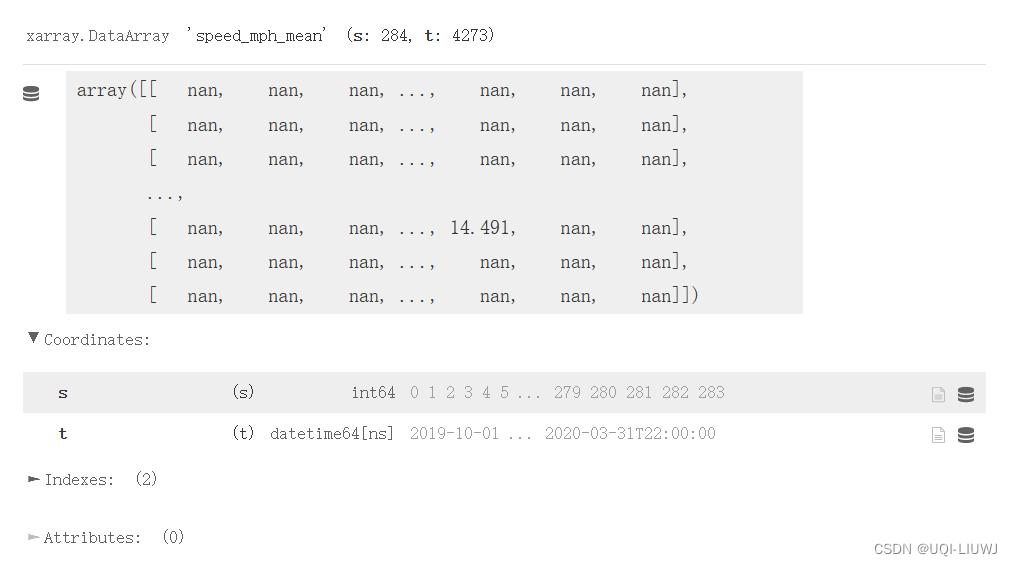
arr=x.sel(s=np.arange(edges.shape[0])).values
arr

import numpy as np
np.save('London_6mon.npy',arr)
以上是关于数据集笔记:Uber Movement (Speed)python 处理数据集至时空矩阵的主要内容,如果未能解决你的问题,请参考以下文章