三教你搞懂渐变堆叠面积图《手把手教你 ECharts 数据可视化详解》
Posted 1_bit
tags:
篇首语:本文由小常识网(cha138.com)小编为大家整理,主要介绍了三教你搞懂渐变堆叠面积图《手把手教你 ECharts 数据可视化详解》相关的知识,希望对你有一定的参考价值。
注:本系列教程需要对应 javascript 、html、css 基础,否则将会导致阅读时困难,本教程将会从 ECharts 的官方示例出发,详解每一个示例实现,从中学习 ECharts 。
ECharts 官方示例:https://echarts.apache.org/examples/zh/index.html
《手把手教你 ECharts 数据可视化详解》 目录
一、基础折线图详解
二、基础平滑、面积折线图与折线堆叠、面积堆叠
一、渐变色
再正式学习 渐变堆叠面积图 之前,我们需要学习在 ECharts 的图标上如何创建渐变色。渐变色在 ECharts 上使用 echarts 对象创建,echarts 内置了 graphic.LinearGradient,使用 LinearGradient 方法可创建渐变色修饰,但具体渐变色修饰创建后还需要给与一个颜色属性,以为在此渐变色是一个颜色属性。
此时我们给与一个 ECharts 的配置如下:
option =
	xAxis:
	    type: 'category',
	    data: ['Mon', 'Tue', 'Wed', 'Thu', 'Fri', 'Sat', 'Sun']
	,
	yAxis: ,
	series: [

		name: 'Line 1',
		type: 'line',
		areaStyle:
		  opacity: 0.8,
		  color: new echarts.graphic.LinearGradient(
		  0, 0, 0, 1,
		  [

		      offset: 0,
		      color: 'rgb(30, 30, 30)'
		    ,

		      offset: 1,
		      color: 'rgb(0, 122, 204)'

		  ])
		,
		data: [140, 232, 101, 264, 90, 340, 250]

	]
;
以上配置大部分我们已经在之前章节学过,在此我们并不了解的是 new echarts.graphic.LinearGradient 创建渐变色。
在创建渐变色的前 4 个参数 0, 0, 0, 1 表示的是渐变色的其实位置,值分别对应的位置是 ”右下左上“;例如第一个 0 对应的是右,第二个 0 对应的是 下,以此类推;再次最后一个位置为 1 则表示渐变色其实位置从上方向开始,意思就是说渐变色从上开始往下渐变。
再往下看,第 5 个参数为一个数组,数组中胚子了两个参数(可以配置多个),这个配置项是对应的渐变色位置变化与颜色关系的配置项,例如第一个配置如下:
  offset: 0,
  color: 'rgb(30, 30, 30)'
其中 offset 表示对应色彩变幻位置,以为渐变色会从一种颜色渐变到另外一种颜色,又或者多种颜色的相互渐变,再次这个 offset 就表示从 0 到 1 从渐变开始到渐变结束的位置的颜色设置;例如再此处设置 offset 为 0,则表示渐变色开始时的配置项,其中第二个配置项时一个 color ,两者结合起来就表示在渐变开始时,颜色是 'rgb(30, 30, 30)' 黑色。
我们接着看下一个渐变色的配置项:
	offset: 1,
	color: 'rgb(0, 122, 204)'
这个配置表示 offset 为1 时,也就是渐变结束的颜色为 ‘rgb(0, 122, 204)’ 蓝色,整体上看来说就是黑色到蓝色的渐变,结合最开始所述的位置信息,那么就是 “渐变色从黑色开始渐变到蓝色,从上方向开始”。
我们将这个配置项复制到我们的代码示例中,又或者直接复制以下完整代码:
<!DOCTYPE html>
<html lang="en">
<head>
    <meta charset="UTF-8">
    <meta http-equiv="X-UA-Compatible" content="IE=edge">
    <meta name="viewport" content="width=device-width, initial-scale=1.0">
    <title>ECharts</title>
    <script src="https://cdn.jsdelivr.net/npm/echarts@5.4.0/dist/echarts.min.js"></script>
</head>
<body>
    <div id="main" style="width: 600px;height:400px;"></div>
    <script type="text/javascript">
      var myChart = echarts.init(document.getElementById('main'));
      option =
        xAxis:
            type: 'category',
            data: ['Mon', 'Tue', 'Wed', 'Thu', 'Fri', 'Sat', 'Sun']
        ,
        yAxis: ,
        series: [

            name: 'Line 1',
            type: 'line',
            areaStyle:
              opacity: 0.8,
              color: new echarts.graphic.LinearGradient(
                0, 0, 0, 1,
                [

                    offset: 0,
                    color: 'rgb(30, 30, 30)'
                    ,

                    offset: 1,
                    color: 'rgb(0, 122, 204)'

              ]
            ),
            data: [140, 232, 101, 264, 90, 340, 250]

        ]
        ;

      //
      myChart.setOption(option);
    </script>
</body>
</html>
此时运行后,在页面上显示为:
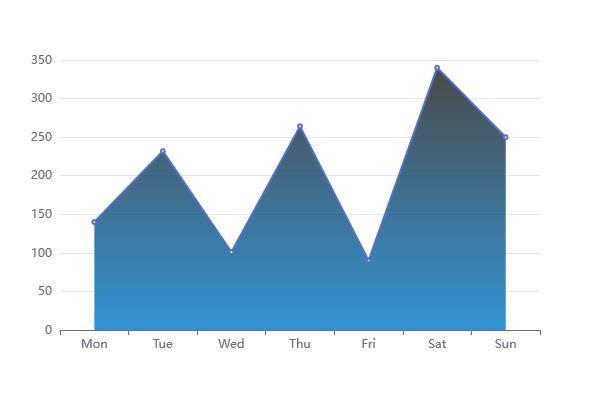
在此可以很好的观察到顶部是黑色,往下逐渐变蓝。
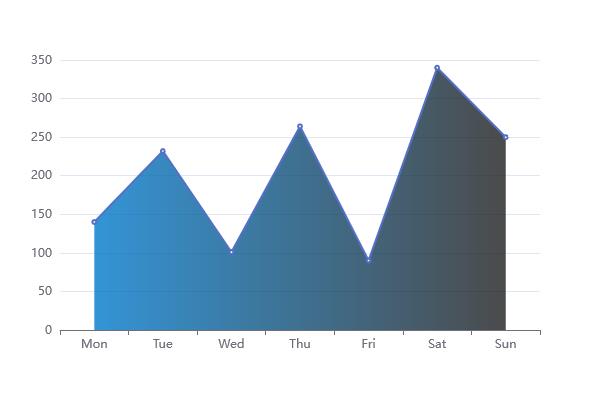
我们可以更改一下位置信息的值,例如更改为 1, 0, 0, 0 表示位置从右边开始,黑色应该在右侧,那么展示效果如下:
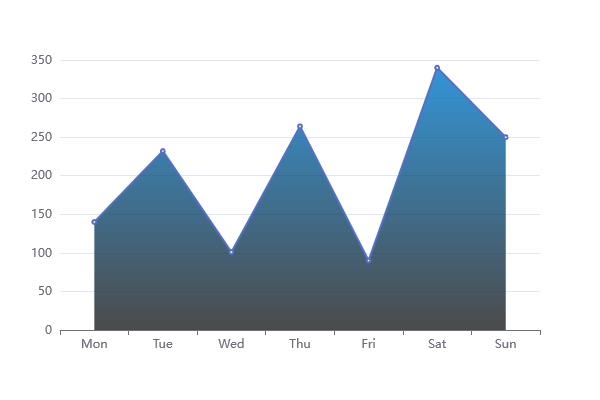
若是 1, 1, 0, 0 那么根据 右下左上 的规则,那位置应该就是从 右下开始:

此时的感觉应该不是很明显,我们可以将 1, 1, 0, 0 改成 1, 1, 1, 0 ,那就是从靠右的下左方向开始,此时应该就是整个底部就是渐变色的开始,那么效果如下:
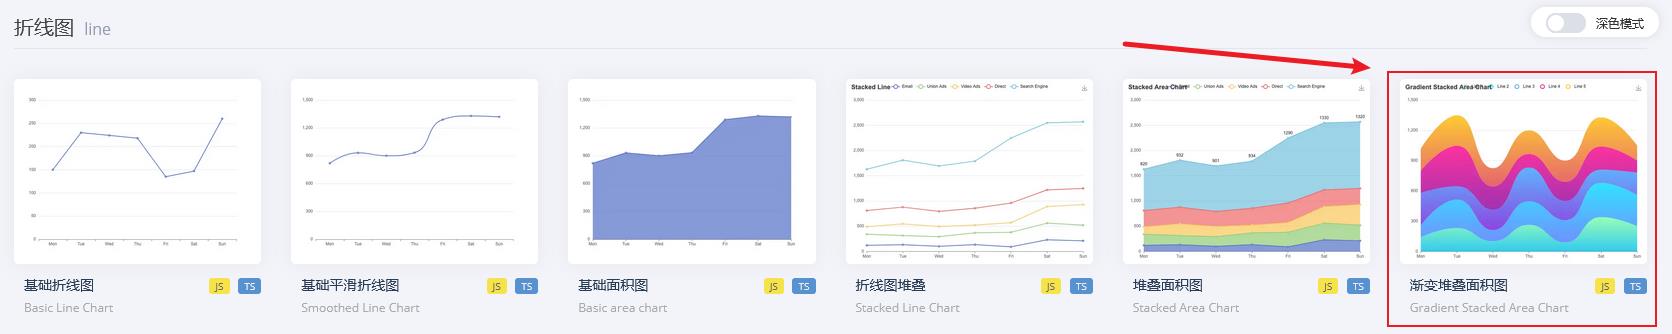
二、渐变堆叠面积图
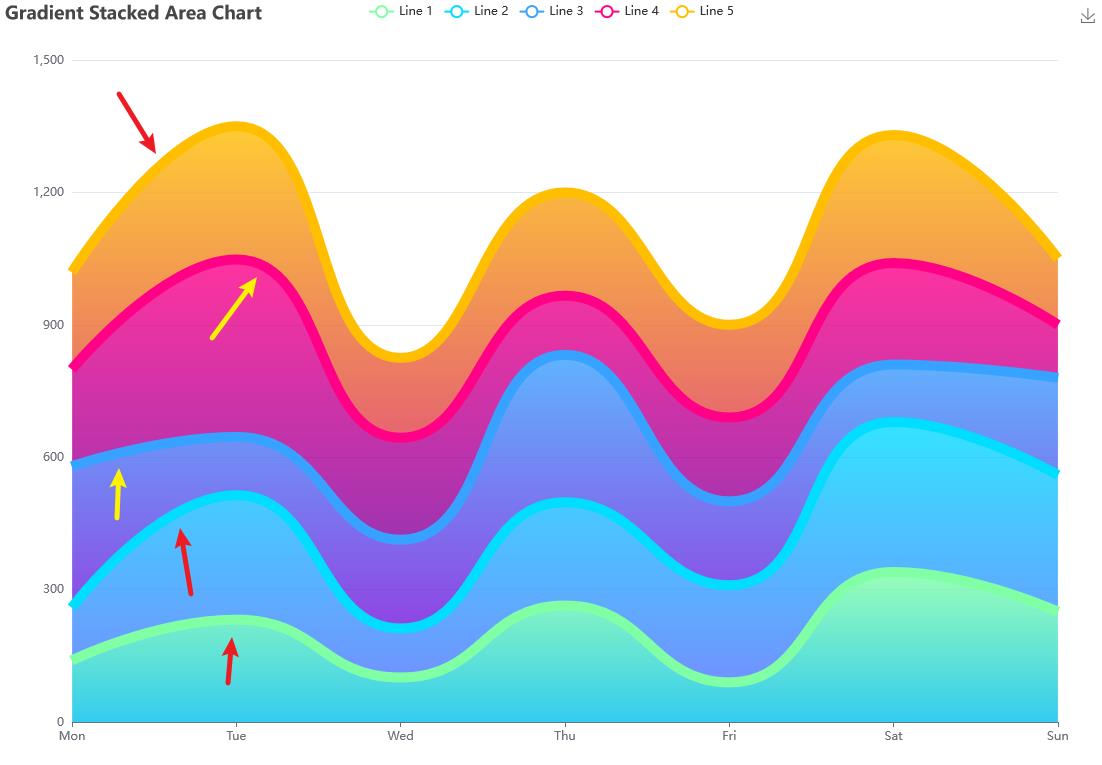
我们打开官网示例图的 渐变堆叠面积图:
打开后,其配置代码如下:
option =
  color: ['#80FFA5', '#00DDFF', '#37A2FF', '#FF0087', '#FFBF00'],
  title:
    text: 'Gradient Stacked Area Chart'
  ,
  tooltip:
    trigger: 'axis',
    axisPointer:
      type: 'cross',
      label:
        backgroundColor: '#6a7985'


  ,
  legend:
    data: ['Line 1', 'Line 2', 'Line 3', 'Line 4', 'Line 5']
  ,
  toolbox:
    feature:
      saveAsImage:

  ,
  grid:
    left: '3%',
    right: '4%',
    bottom: '3%',
    containLabel: true
  ,
  xAxis: [

      type: 'category',
      boundaryGap: false,
      data: ['Mon', 'Tue', 'Wed', 'Thu', 'Fri', 'Sat', 'Sun']

  ],
  yAxis: [

      type: 'value'

  ],
  series: [

      name: 'Line 1',
      type: 'line',
      stack: 'Total',
      smooth: true,
      lineStyle:
        width: 0
      ,
      showSymbol: false,
      areaStyle:
        opacity: 0.8,
        color: new echarts.graphic.LinearGradient(0, 0, 0, 1, [

            offset: 0,
            color: 'rgb(128, 255, 165)'
          ,

            offset: 1,
            color: 'rgb(1, 191, 236)'

        ])
      ,
      emphasis:
        focus: 'series'
      ,
      data: [140, 232, 101, 264, 90, 340, 250]
    ,

      name: 'Line 2',
      type: 'line',
      stack: 'Total',
      smooth: true,
      lineStyle:
        width: 0
      ,
      showSymbol: false,
      areaStyle:
        opacity: 0.8,
        color: new echarts.graphic.LinearGradient(0, 0, 0, 1, [

            offset: 0,
            color: 'rgb(0, 221, 255)'
          ,

            offset: 1,
            color: 'rgb(77, 119, 255)'

        ])
      ,
      emphasis:
        focus: 'series'
      ,
      data: [120, 282, 111, 234, 220, 340, 310]
    ,

      name: 'Line 3',
      type: 'line',
      stack: 'Total',
      smooth: true,
      lineStyle:
        width: 0
      ,
      showSymbol: false,
      areaStyle:
        opacity: 0.8,
        color: new echarts.graphic.LinearGradient(0, 0, 0, 1, [

            offset: 0,
            color: 'rgb(55, 162, 255)'
          ,

            offset: 1,
            color: 'rgb(116, 21, 219)'

        ])
      ,
      emphasis:
        focus: 'series'
      ,
      data: [320, 132, 201, 334, 190, 130, 220]
    ,

      name: 'Line 4',
      type: 'line',
      stack: 'Total',
      smooth: true,
      lineStyle:
        width: 0
      ,
      showSymbol: false,
      areaStyle:
        opacity: 0.8,
        color: new echarts.graphic.LinearGradient(0, 0, 0, 1, [

            offset: 0,
            color: 'rgb(255, 0, 135)'
          ,

            offset: 1,
            color: 'rgb(135, 0, 157)'

        ])
      ,
      emphasis:
        focus: 'series'
      ,
      data: [220, 402, 231, 134, 190, 230, 120]
    ,

      name: 'Line 5',
      type: 'line',
      stack: 'Total',
      smooth: true,
      lineStyle:
        width: 0
      ,
      showSymbol: false,
      label:
        show: true,
        position: 'top'
      ,
      areaStyle:
        opacity: 0.8,
        color: new echarts.graphic.LinearGradient(0, 0, 0, 1, [

            offset: 0,
            color: 'rgb(255, 191, 0)'
          ,

            offset: 1,
            color: 'rgb(224, 62, 76)'

        ])
      ,
      emphasis:
        focus: 'series'
      ,
      data: [220, 302, 181, 234, 210, 290, 150]

  ]
;
在以上配置项中,出现的新配置项只有 lineStyle 折线图图例横线的样式设置,其配置为:
lineStyle:
	width: 0
其中 width 表示配置线宽,线宽在图标中表示本身折线图的线段,如下图所示为 width 配置为 10 的情况:
position
此时我们将线条恢复为 0 值时,我们鼠标移动到坐标轴上,发现上面有一个数值:
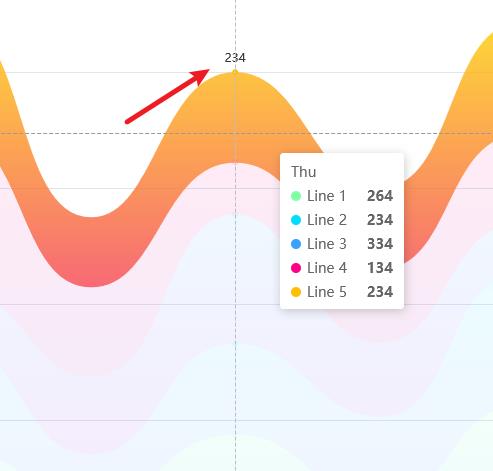
此时在 series 下的某个数据组里面的 label 就是指当前这个区域,此时的配置如下:
label:
 show: true,
 position: 'top'
在此配置中 show 表示是否显示,position 表示显示的位置,入此时 top 就是显示在那个数值的顶部,若你更改为 left,那么显示如下:
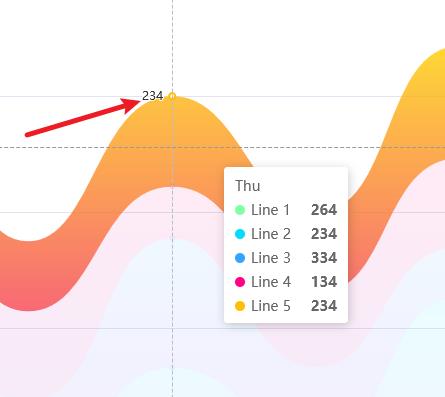
此时数值将会显示在数值点的左侧。
以上是关于三教你搞懂渐变堆叠面积图《手把手教你 ECharts 数据可视化详解》的主要内容,如果未能解决你的问题,请参考以下文章
三教你搞懂渐变堆叠面积图《手把手教你 ECharts 数据可视化详解》