CS109 Lecture 3
Posted ZJun310
tags:
篇首语:本文由小常识网(cha138.com)小编为大家整理,主要介绍了CS109 Lecture 3相关的知识,希望对你有一定的参考价值。
CS109 Lecture 3
Visualization Goal
Presentation
- Know facts about data
- Task: Communicate results
Exploration
Data without hypothesis
Task: Generate hypothesis
The grestest value of a picture is when it forces us to notice what we never expected to see —John Tukey
Confirmation
- Hypothesis is given
- Task: Verify/ falsify hypothesis
The Process of data analysis
Steps
- Ask an interesting question
- Get the data
- Explore the data
- Model the data
- Communicate and visualize the results
Note !
This is not step by step process, you can move back to every step
Data & Question
- What are the data types ?
- What are possible questions ?
Data Type (1)
- 1D (sequences) / 2D (maps) / 3D (shaped) / nD (relational)
- Temporal
- Trees (hierarchical)
- Networks (graphs)
Data Type (2)
- Tables
- Networks
- text
Data Type (3)
- Normal (Categorical)
- Ordinal (O)
- Quantitative (Q)
- Two Type
- Interval (location of zero arbitrary)
- Ratio (zero fixed)
- Two Type
Semantics vs. Types
Data Semantics : The really-world meaning
Data Type : Interpretation in terms of scales of measurements
Data Dismensions
Univariate Data / Bivariate Data / Trivariate Data / Multivariate Data
Ps : Do not use 3D scatterplot ! And map the third dimension to some other visual attribute
Data Reduction
- Flitering
- Eliminate some items or attributes
- Aggregation
- Represent a group of elements by a new derived element
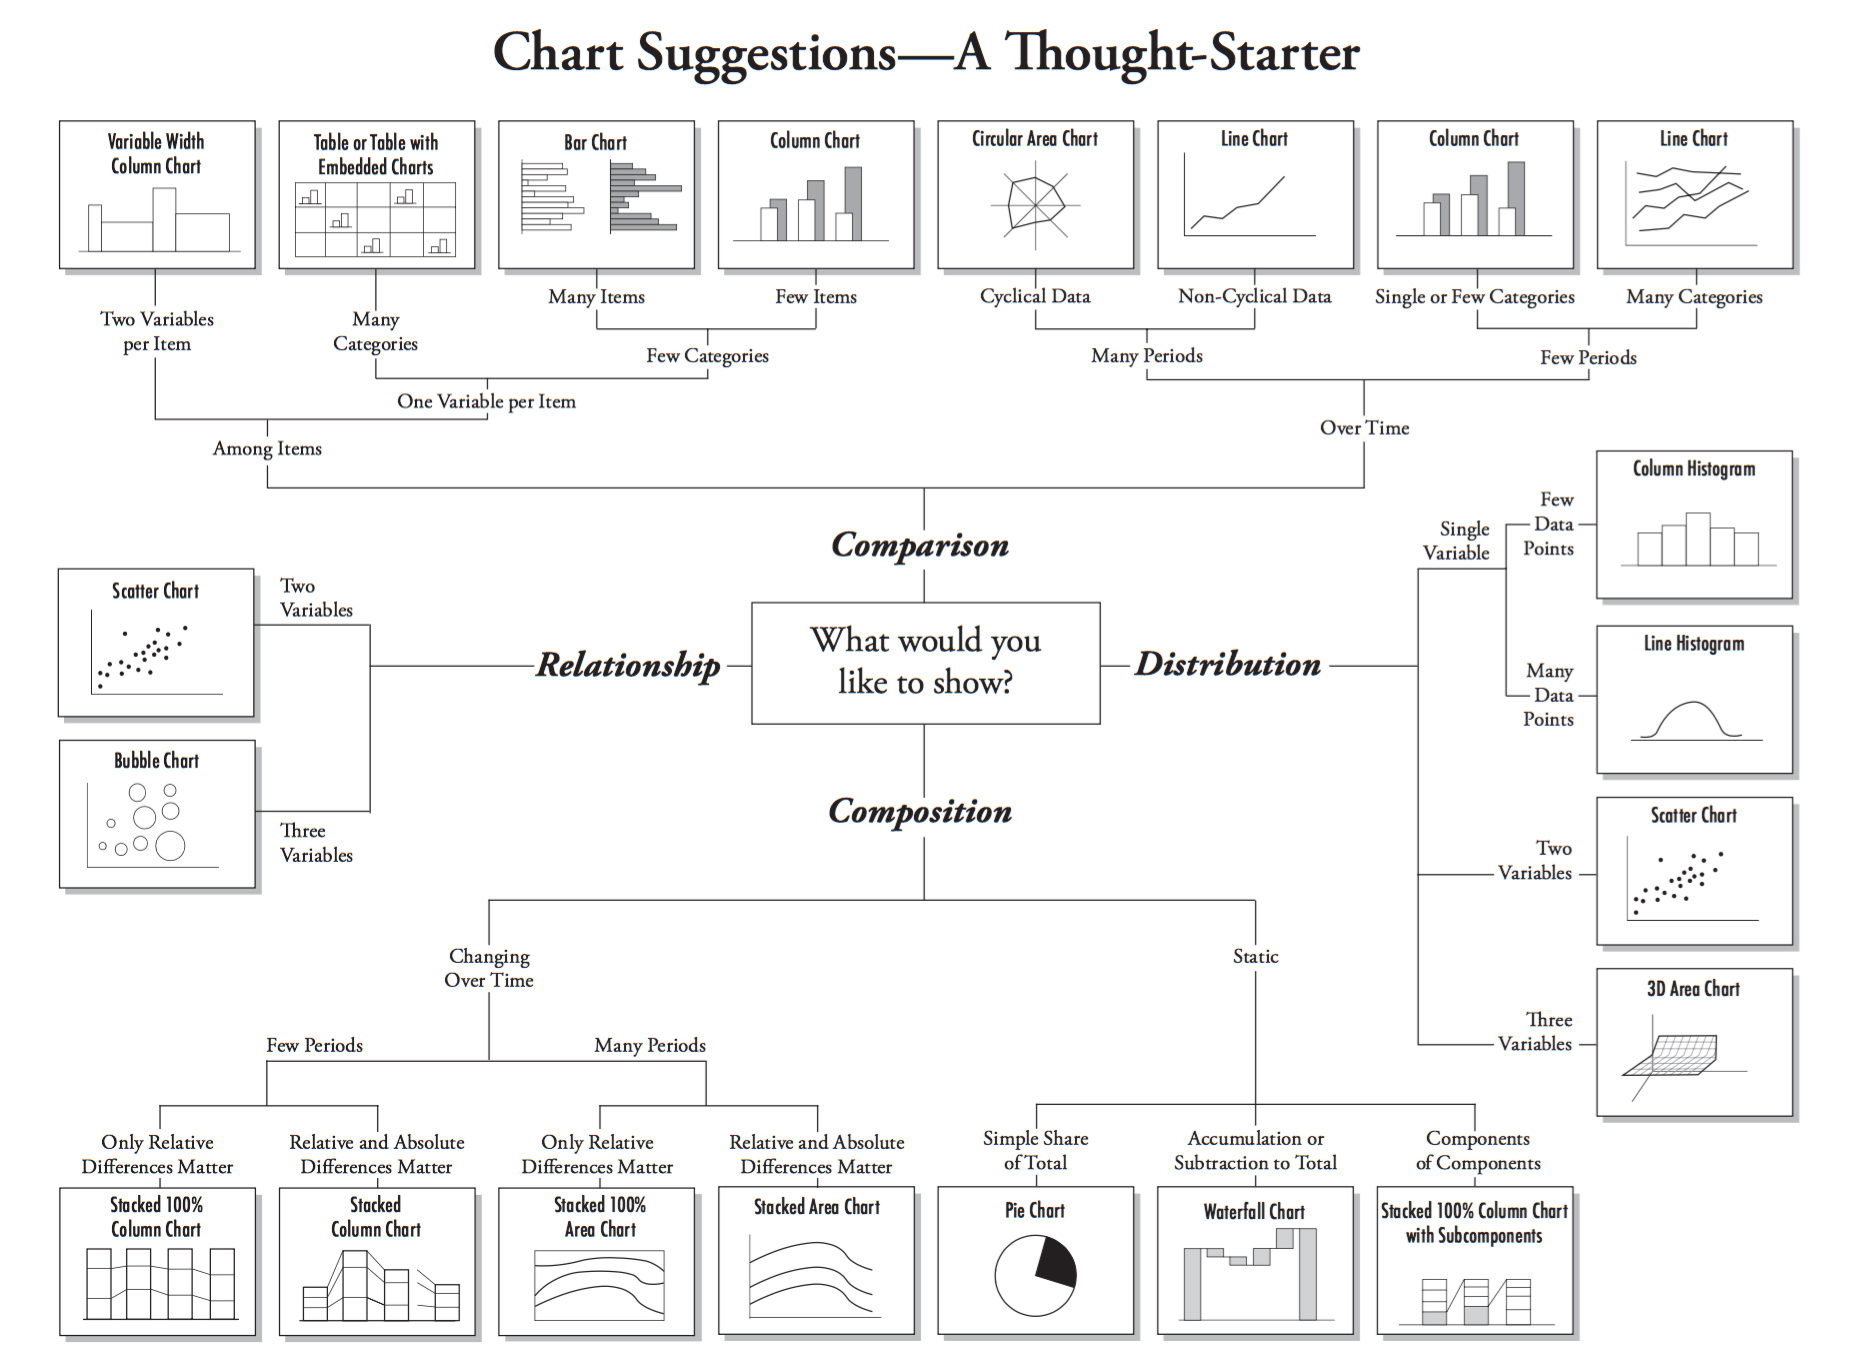
Statistical Graph Type
Choosing an Appropriate Chart

Note !
Sometimes we have to deal with overplotting by changing the value of alpha
以上是关于CS109 Lecture 3的主要内容,如果未能解决你的问题,请参考以下文章