Python实现拓扑排序并绘图
Posted Circle-C
tags:
篇首语:本文由小常识网(cha138.com)小编为大家整理,主要介绍了Python实现拓扑排序并绘图相关的知识,希望对你有一定的参考价值。
绘图需要:
1. 需要安装graphviz软件,配置bin文件夹到环境变量
windows:
下载地址:https://graphviz.gitlab.io
Linux:
# yum下载graphviz软件:
yum -y install graphviz
2. 需要安装python的graphviz模块
pip install graphvizfrom collections import defaultdict
from graphviz import Digraph
class Graph:
def __init__(self, vertices):
self.graph = defaultdict(list)
self.V = vertices
def addEdge(self, u, v):
self.graph[u].append(v)
def topologicalSortUtil(self, v, visited, stack):
visited[v] = True
for node in self.graph[v]:
if visited[node] == False:
self.topologicalSortUtil(node, visited, stack)
stack.insert(0, v)
def topologicalSort(self):
visited =
for key, values in self.graph.items():
visited[key] = False
for val in values:
visited[val] = False
stack = []
for node in visited.keys():
if visited[node] == False:
self.topologicalSortUtil(node, visited, stack)
return stack
def draw_graph(node_relations):
dot = Digraph(comment='node graph', filename='blueprintNodeGraph-neato', format='png', engine='neato')
dot.attr(
'node',
shape='box', style='rounded,filled',
fixedsize='false',
fontname='Microsoft YaHei', fontsize='12')
node_size = 0
for relation in node_relations:
node_size += 1
# wrapsize = 12
# dot.node(textwrap.fill(node_name, wrapsize))
dot.edge(relation[0], relation[1], len='3')
print(f"relation[0] -> relation[1]")
dot.render(directory='doctest-output', view=True).replace('\\\\', '/')
if __name__ == '__main__':
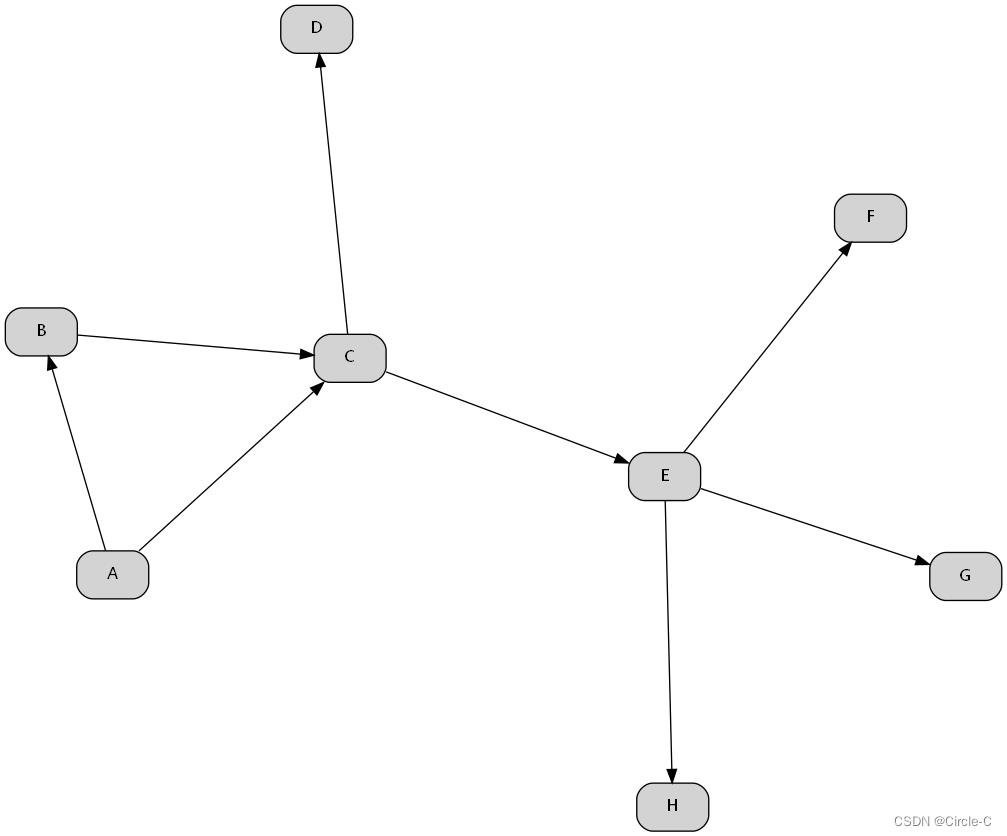
node_relations = (('A', 'B'),
('A', 'C'),
('B', 'C'),
('C', 'D'),
('C', 'E'),
('E', 'F'),
('E', 'G'),
('E', 'H'))
# 拓扑排序
g = Graph(8)
for a, b in node_relations:
g.addEdge(a, b)
topo_list = g.topologicalSort()
print(topo_list)
# 绘图
draw_graph(node_relations)执行后输出:
# output
['A', 'B', 'C', 'E', 'H', 'G', 'F', 'D']
A -> B
A -> C
B -> C
C -> D
C -> E
E -> F
E -> G
E -> H
拓扑图:

以上是关于Python实现拓扑排序并绘图的主要内容,如果未能解决你的问题,请参考以下文章