Prometheus部署告警对接邮箱
Posted 还行少年
tags:
篇首语:本文由小常识网(cha138.com)小编为大家整理,主要介绍了Prometheus部署告警对接邮箱相关的知识,希望对你有一定的参考价值。
文章目录
定义告警规则
[root@prometheus ~]# tar xf alertmanager-0.22.2.linux-amd64.tar.gz -C /usr/local/
[root@prometheus ~]# mv /usr/local/alertmanager-0.22.2.linux-amd64/ /usr/local/alertmanager
[root@prometheus ~]# cat /usr/local/alertmanager/alertmanager.yml
route:                       //路由信息
  group_by: ['alertname']    //分组
  group_wait: 30s            //分组缓冲/等待时间
  group_interval: 5m         //重新分组时间
  repeat_interval: 1h        //重新告警间隔
  receiver: 'web.hook'       //接收方/媒介
receivers:                   //接收方信息
- name: 'web.hook'
  webhook_configs:
  - url: 'http://127.0.0.1:5001/'   //标注5001端口
inhibit_rules:                      //抑制规则的策略
  - source_match:                   //匹配项
      severity: 'critical'          //严重的级别
    target_match:
      severity: 'warning'           //target匹配warning级别
    equal: ['alertname', 'dev', 'instance']  //符合alertname、dev、instance的分组、分类对象

[root@prometheus ~]#
修改alertmanager的配置文件
[root@prometheus ~]# cat /usr/local/alertmanager/alertmanager.yml
global:
  smtp_from: 12762639@qq.com
  smtp_auth_username: 12762639@qq.com
  smtp_auth_password: suevatcftbxcbagd
  smtp_require_tls: false
  smtp_smarthost: 'smtp.qq.com:465'

route:
  group_by: ['alertname']
  group_wait: 10s
  group_interval: 10s
  repeat_interval: 1h
  receiver: 'email-test'
receivers:
- name: 'email-test'
  email_configs:
  - to: 12762639@qq.com
    send_resolved: true
部署alert-config
[root@prometheus ~]# cd /usr/local/alertmanager/alert-config/
[root@prometheus alert-config]# ls
alert_rules  prometheus.yml  targets
[root@prometheus alert-config]# cat prometheus.yml
# my global config
# Author: MageEdu <mage@magedu.com>
# Repo: http://gitlab.magedu.com/MageEdu/prometheus-configs/
global:
  scrape_interval:     15s # Set the scrape interval to every 15 seconds. Default is every 1 minute.
  evaluation_interval: 15s # Evaluate rules every 15 seconds. The default is every 1 minute.
  # scrape_timeout is set to the global default (10s).

# Alertmanager configuration
alerting:
  alertmanagers:
  - file_sd_configs:
    - files:
      - "targets/alertmanagers*.yaml"

# Load rules once and periodically evaluate them according to the global 'evaluation_interval'.
rule_files:
  - "rules/*.yaml"
  - "alert_rules/*.yaml"

# A scrape configuration containing exactly one endpoint to scrape:
# Here it's Prometheus itself.
scrape_configs:
  # The job name is added as a label `job=<job_name>` to any timeseries scraped from this config.
  - job_name: 'prometheus'
    # metrics_path defaults to '/metrics'
    # scheme defaults to 'http'.
    static_configs:
    file_sd_configs:
    - files:
      - targets/prometheus-*.yaml
      refresh_interval: 2m

  # All nodes
  - job_name: 'nodes'
    file_sd_configs:
    - files:
      - targets/nodes-*.yaml
      refresh_interval: 2m

  - job_name: 'alertmanagers'
    file_sd_configs:
    - files:
      - targets/alertmanagers*.yaml
      refresh_interval: 2m
[root@prometheus alert-config]#
[root@prometheus alert-config]# ls
alert_rules prometheus.yml targets
[root@prometheus alert-config]# cd targets/
[root@prometheus targets]# cat alertmanagers.yaml
- targets:
- 192.168.30.7:9093
labels:
app: alertmanager
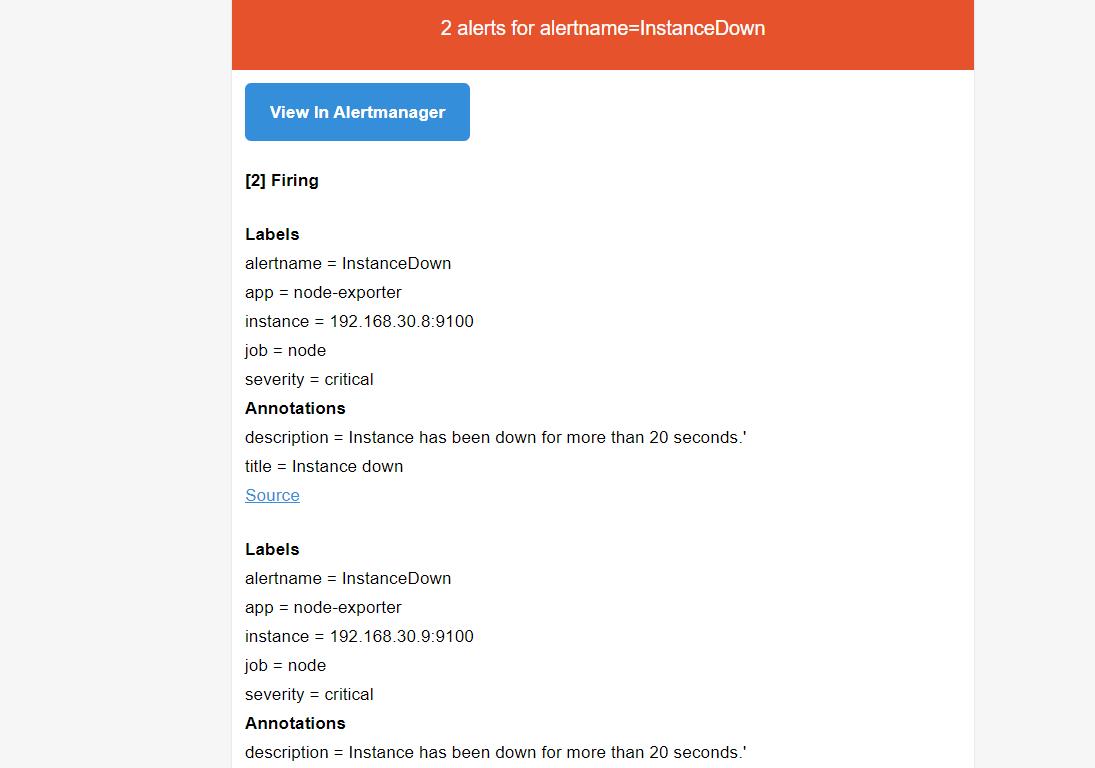
[root@prometheus targets]# cat nodes-linux.yaml
- targets:
- 192.168.30.8:9100
- 192.168.30.9:9100
labels:
app: node-exporter
job: node
[root@prometheus targets]# cat prometheus-servers.yaml
- targets:
- 192.168.30.7:9090
labels:
app: prometheus
job: prometheus
[root@prometheus targets]#
[root@prometheus targets]# cd ..
[root@prometheus alert-config]# cd alert_rules/
[root@prometheus alert_rules]# cat instance_down.yaml
groups:
- name: AllInstances
rules:
- alert: InstanceDown
# Condition for alerting
expr: up == 0
for: 20s
# Annotation - additional informational labels to store more information
annotations:
title: 'Instance down'
description: Instance has been down for more than 20 seconds.'
# Labels - additional labels to be attached to the alert
labels:
severity: 'critical'
[root@prometheus alert_rules]#
启动alertmanager
[root@prometheus targets]# cd /usr/local/alertmanager/
[root@prometheus alertmanager]# ./alertmanager
level=info ts=2021-09-23T14:22:00.204Z caller=main.go:221 msg="Starting Alertmanager" version="(version=0.22.2, branch=HEAD, revision=44f8adc06af5101ad64bd8b9c8b18273f2922051)"
level=info ts=2021-09-23T14:22:00.204Z caller=main.go:222 build_context="(go=go1.16.4, user=root@b595c7f32520, date=20210602-07:50:37)"
level=info ts=2021-09-23T14:22:00.207Z caller=cluster.go:184 component=cluster msg="setting advertise address explicitly" addr=192.168.30.7 port=9094
level=info ts=2021-09-23T14:22:00.209Z caller=cluster.go:671 component=cluster msg="Waiting for gossip to settle..." interval=2s
level=info ts=2021-09-23T14:22:00.269Z caller=coordinator.go:113 component=configuration msg="Loading configuration file" file=alertmanager.yml
level=info ts=2021-09-23T14:22:00.269Z caller=coordinator.go:126 component=configuration msg="Completed loading of configuration file" file=alertmanager.yml
level=info ts=2021-09-23T14:22:00.276Z caller=main.go:514 msg=Listening address=:9093
level=info ts=2021-09-23T14:22:00.276Z caller=tls_config.go:191 msg="TLS is disabled." http2=false
level=info ts=2021-09-23T14:22:02.210Z caller=cluster.go:696 component=cluster msg="gossip not settled" polls=0 before=0 now=1 elapsed=2.001291729s
level=info ts=2021-09-23T14:22:10.213Z caller=cluster.go:688 component=cluster msg="gossip settled; proceeding" elapsed=10.003838302s
指定文件启动prometheus
[root@prometheus prometheus-2.27.1.linux-amd64]# cd /usr/local/alertmanager/
[root@prometheus alertmanager]# ls
alert-config  alertmanager  alertmanager.yml  alertmanager.yml.bak  amtool  data  LICENSE  NOTICE
[root@prometheus alertmanager]# cd alert-config/
[root@prometheus alert-config]# ls
alert_rules  prometheus.yml  targets
[root@prometheus alert-config]# cd ..
[root@prometheus alertmanager]# ln -s /usr/local/prometheus-2.27.1.linux-amd64/prometheus /usr/local/bin
[root@prometheus alertmanager]# prometheus --config.file=./alert-config/prometheus.yml
level=info ts=2021-09-23T14:24:58.948Z caller=main.go:388 msg="No time or size retention was set so using the default time retention" duration=15d
level=info ts=2021-09-23T14:24:58.948Z caller=main.go:426 msg="Starting Prometheus" version="(version=2.27.1, branch=HEAD, revision=db7f0bcec27bd8aeebad6b08ac849516efa9ae02)"
level=info ts=2021-09-23T14:24:58.948Z caller=main.go:431 build_context="(go=go1.16.4, user=root@fd804fbd4f25, date=20210518-14:17:54)"
level=info ts=2021-09-23T14:24:58.948Z caller=main.go:432 host_details="(Linux 3.10.0-957.el7.x86_64 #1 SMP Thu Nov 8 23:39:32 UTC 2018 x86_64 prometheus (none))"
level=info ts=2021-09-23T14:24:58.948Z caller=main.go:433 fd_limits="(soft=1024, hard=4096)"
level=info ts=2021-09-23T14:24:58.948Z caller=main.go:434 vm_limits="(soft=unlimited, hard=unlimited)"
level=info ts=2021-09-23T14:24:58.950Z caller=web.go:540 component=web msg="Start listening for connections" add
关闭节点上的node_exporter
以上是关于Prometheus部署告警对接邮箱的主要内容,如果未能解决你的问题,请参考以下文章