Flutter——Canvas自定义曲线图
Posted 怀君
tags:
篇首语:本文由小常识网(cha138.com)小编为大家整理,主要介绍了Flutter——Canvas自定义曲线图相关的知识,希望对你有一定的参考价值。
开发背景
公司功能需求开发;要求通过Flutter控件Canvas实现曲线图,刻度道等UI;
效果图

- 第一步实现坐标体系;
实现坐标体系,左上右下四个点;
  ///原点坐标
  Offset? pointOrigin;

  ///原点顶部左边坐标
  Offset? pointTopLeft;

  ///原点顶部右边坐标
  Offset? pointTopRight;

  ///原点底部右边坐标
  Offset? pointBottomRight;

  ///画布的坐标系的Rect
  Rect? paintRect;

  ///1、初始化画布四个点
  initPoint()
    pointOrigin = fracturingModel.pointOrigin;
    pointTopLeft = fracturingModel.pointTopLeft;
    pointTopRight = fracturingModel.pointTopRight;
    pointBottomRight = fracturingModel.pointBottomRight;
    paintRect = fracturingModel.paintRect;
- 第二步实现顶部类型标识UI;
效果图
这里需要注意的是 **drawText()**方法,后面会贴上实现方法;
  ///2、顶部类型样式
  void initDrawTopText()
    ///1.拿到JSON数据
    var fracturingMaxList = fracturingModel.fracturingsInfoList;
    var fontWidth = 0.0;
    var length = fracturingMaxList.length;

    ///2.算出文字的宽度
    for (var i = 0; i < length; i++)
      var info = fracturingMaxList[i];
      Size textSize = drawTextBoxSize(info.paramName, 10.0, 'typeface');
      fontWidth += (textSize.width + space + rectWidth + 2);


    ///3.算出总文字宽度的中心点,并从此点绘制出文本跟颜色标识
    var startX = (width - fontWidth) / 2;
    for (var i = 0; i < length; i++)
      paints.style = PaintingStyle.fill;
      var info = fracturingMaxList[i];

      ///3.1点击选中,是否显示该条曲线
      if (info.isShow)
        paints.color = ColorsUtils.hexToColor(info.curveColorPlus!);
       else
        paints.color = Colors.grey;


      ///3.2计算颜色标识的矩形宽度
      var rect = Rect.fromLTWH(startX, 0, rectWidth, rectHeight);
      ctx.drawRect(rect, paints);

      ///3.3计算文字的起始点
      startX += rectWidth;

      ///3.4绘制文字
      Size drawSize = drawText(info.paramName, startX + 2, 5.0, 'typeface',
          10.0, paints.color, 'left', 'middle');

      ///3.5计算颜色标识与文本的绘制矩形,后期做点击事件的功能
      var rects = Rect.fromLTWH(
          startX - rectWidth, 0, rectWidth + drawSize.width, rectHeight);
      listRect.add(rects);
      startX += drawSize.width + space;
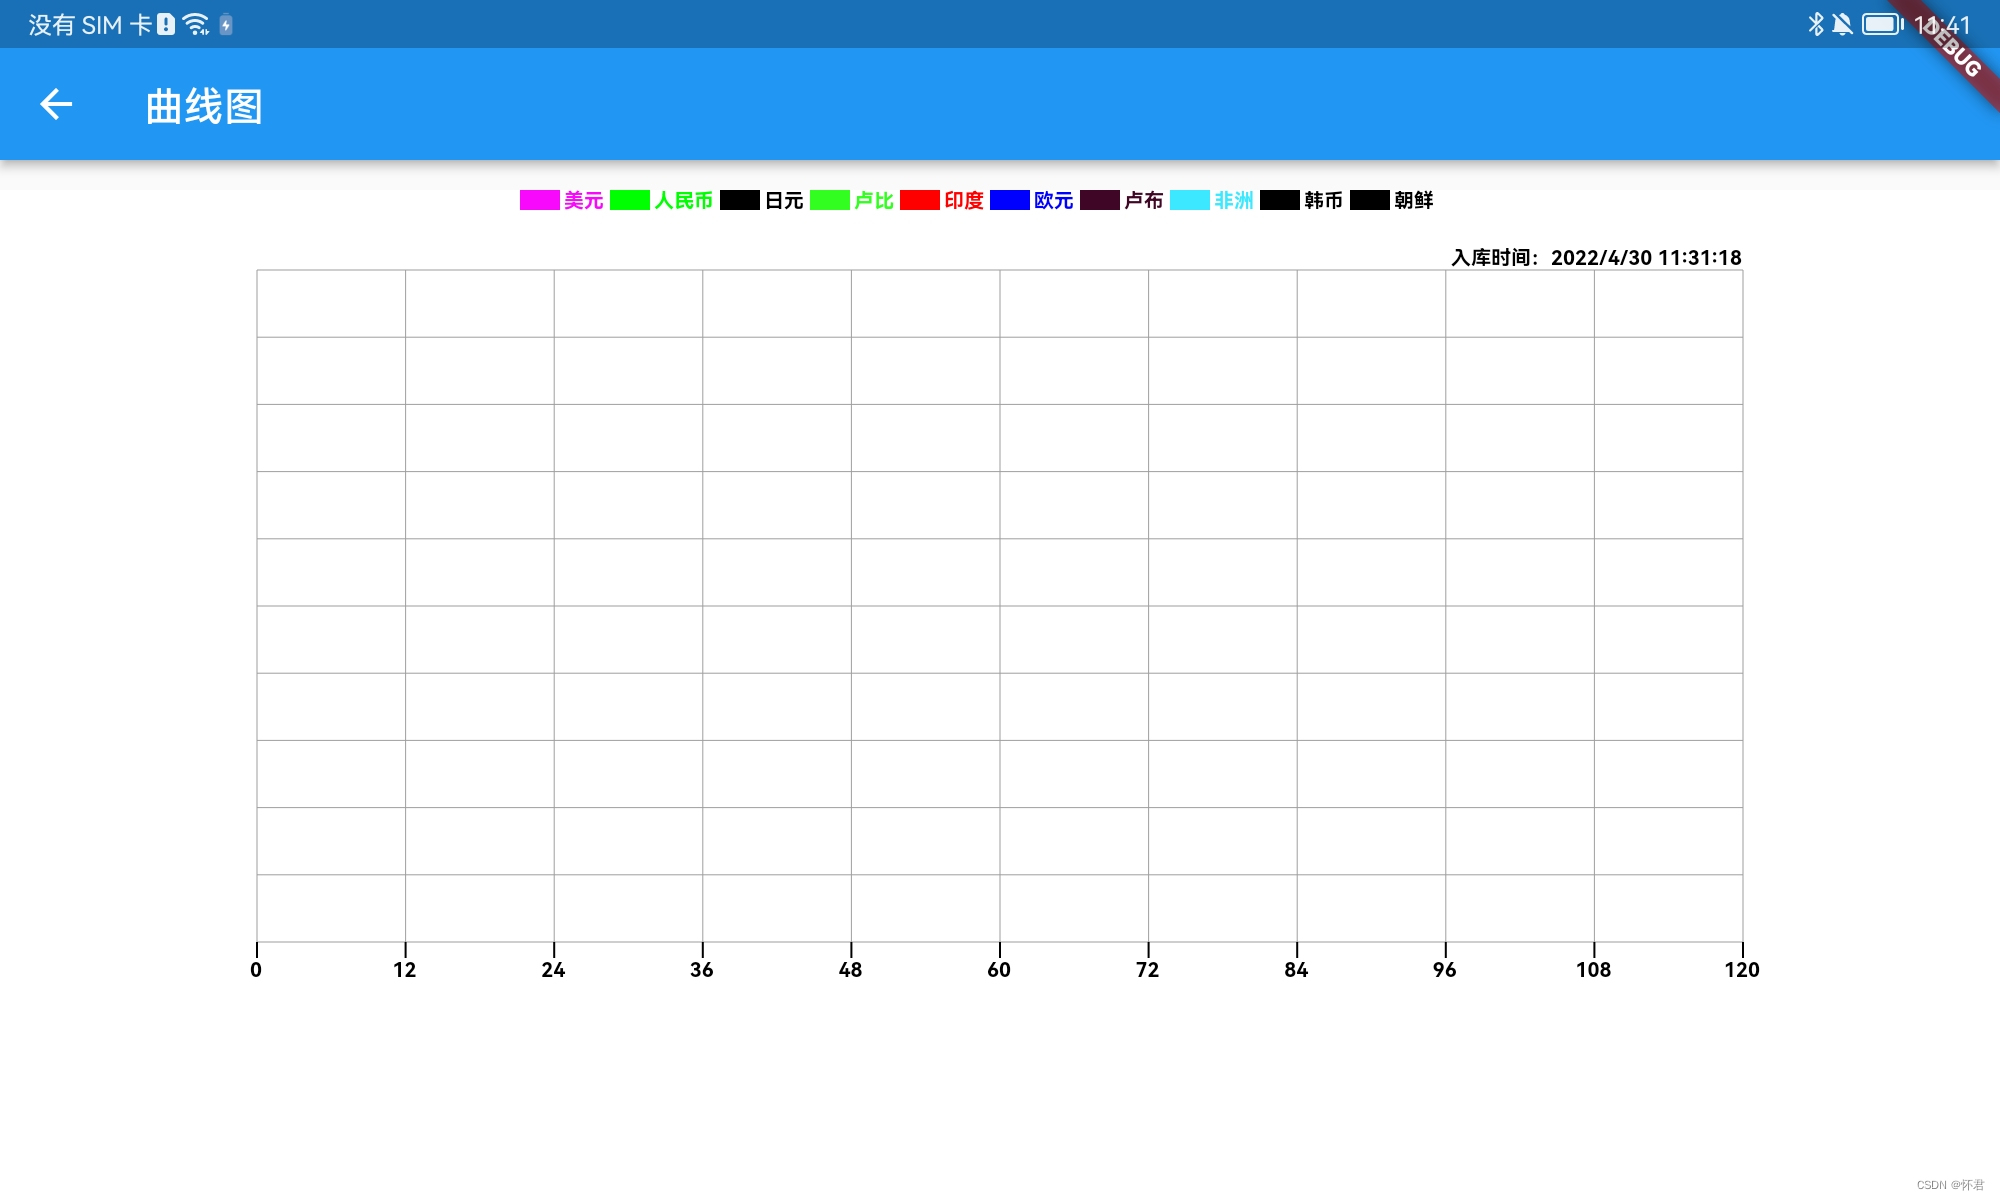
- 根据四个点绘制网格
效果图
  ///3、绘制网格
  void initDrawLine()
    paints.color = Colors.grey;
    ///左上y值;
    var y = pointTopLeft!.dy;
    ///左上x值;
    var x = pointTopLeft!.dx;
    for (var i = 0; i < 11; i++)
      ctx.drawLine(Offset(x, pointTopRight!.dy),
          Offset(x, height - marginBottom + 10.0), paints);
      ctx.drawLine(
          Offset(marginLeft, y), Offset(width - marginRight, y), paints);
      y += averageHeight;
      x += averageWidth;
- 绘制底部刻度道
效果图看第三步
  ///5、底部刻度道
  initDrawBottomScale()
    paints.strokeWidth = 1.0;
    var scaleHeight = 8;
    var paintWidth = width - marginRight - marginLeft;
    var space = paintWidth / 10;
    var y = pointOrigin!.dy;
    var x = marginLeft;
    for (var i = 0; i < fracturingModel.bottomScaleList.length; i++)
      drawScale(x, y, x, y + scaleHeight);
      drawText(fracturingModel.bottomScaleList[i].toStringAsFixed(0), x,
          y + scaleHeight, 's', 10.0, null, 'center', 'top');
      x = x + space;
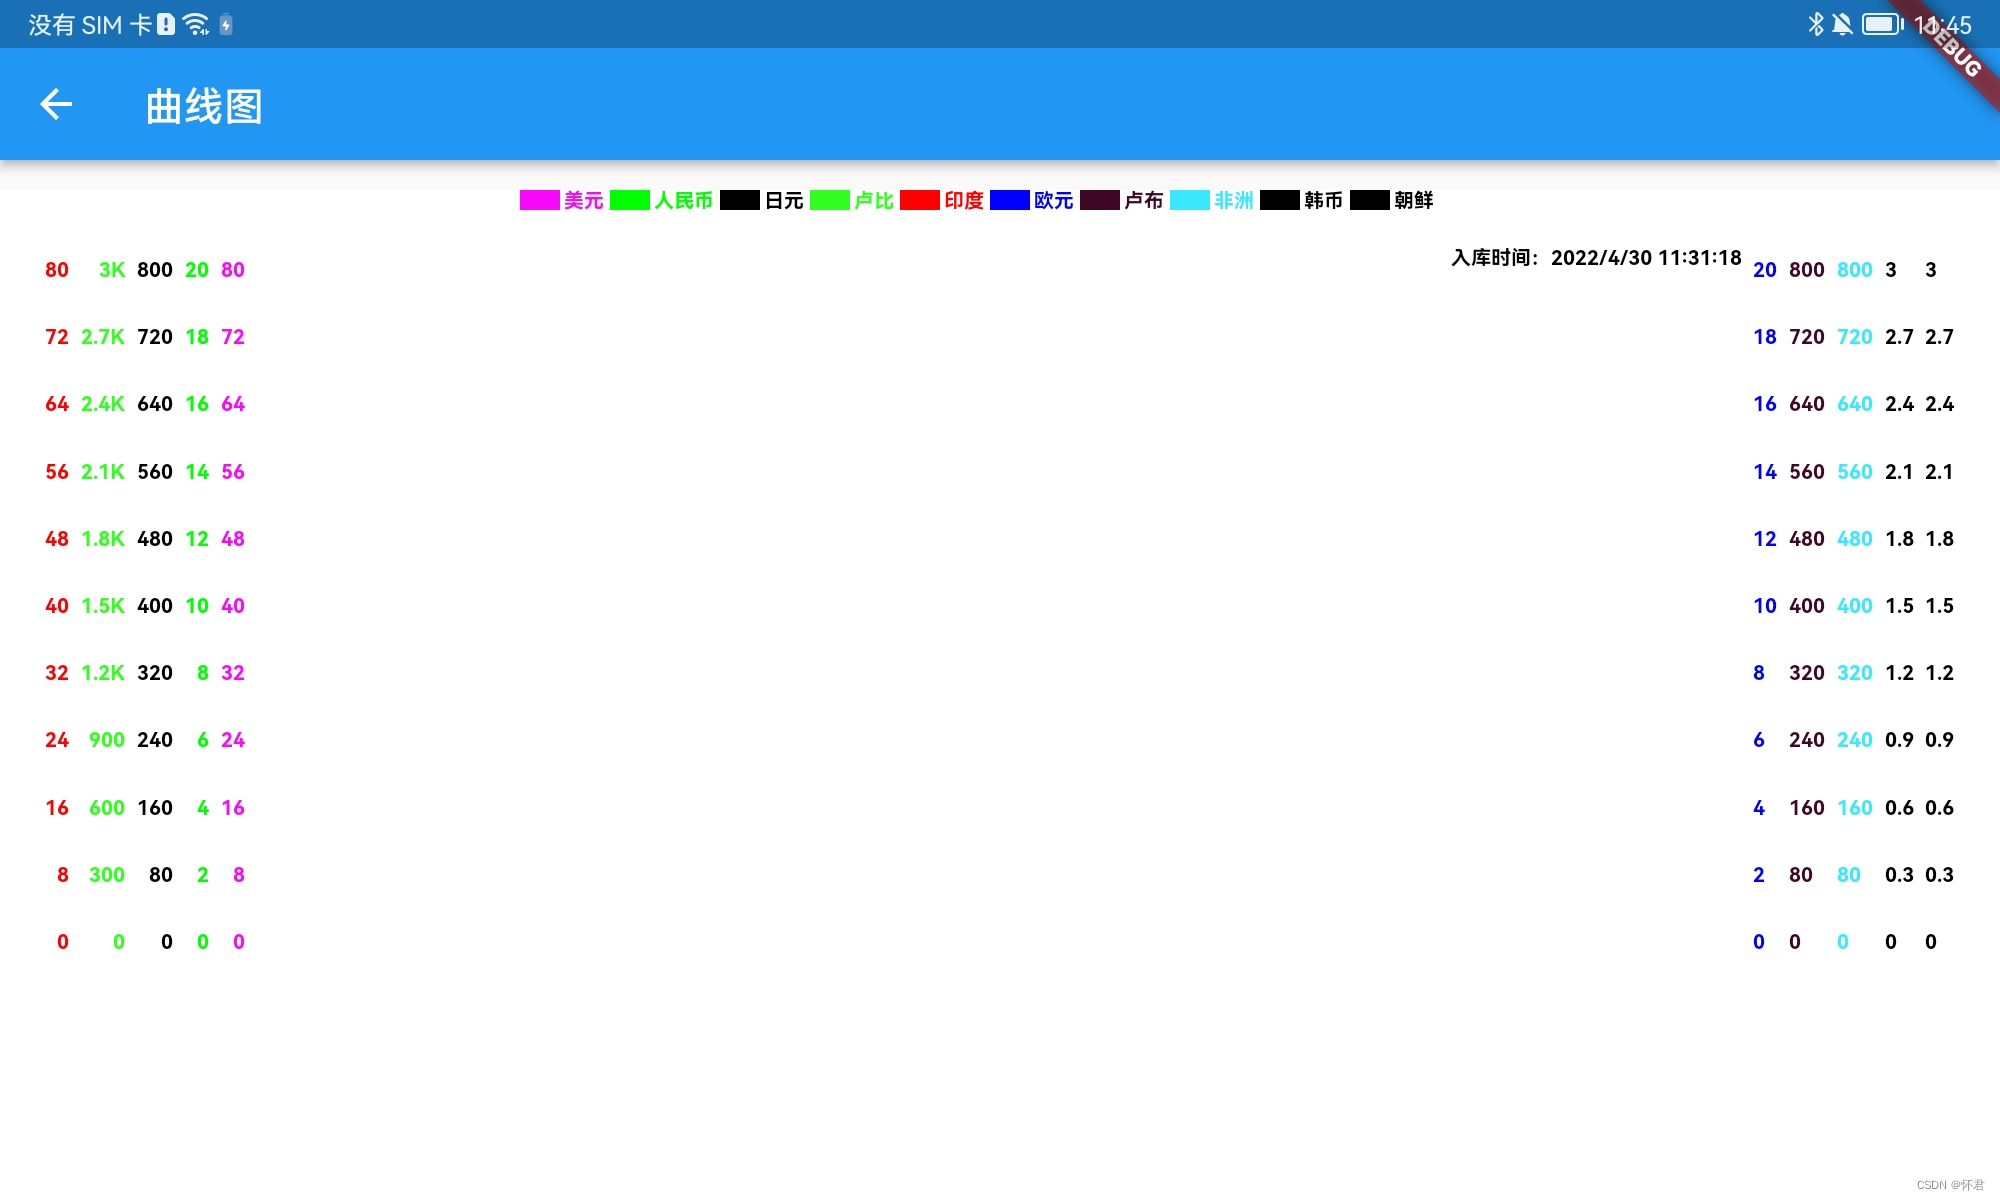
- 绘制左右侧刻度道
效果图
  ///6、绘制左侧刻度道
  initDrawLeftRightScale()
    var fracturingMaxList = fracturingModel.fracturingsInfoList;
    ///左边x轴绘制起点
    var leftX = pointOrigin!.dx - space;
    ///右边x轴绘制起点
    var rightX = width - marginRight + space;
    ///总共有多少条刻度
    var length = fracturingMaxList.length;
    var even = (length / 2).round();
    ///判断奇偶数,根据它来判断左右需要绘画的刻度列数
    if (!MathUtil.isEven(length))
      even -= 1;

    for (var i = 0; i < length; i++)
      var maxData = fracturingMaxList[i];
      if (i < even)
        var y = pointOrigin!.dy;
        var yyText = 0.0;
        Size? textSize;
        var textWidth = 0.0;
        for (var j = 0; j < 11; j++)
          textSize = drawText(
              Utils().formatNumber(yyText),
              leftX,
              y,
              's',
              10.0,
              ColorsUtils.hexToColor(maxData.curveColorPlus!),
              'right',
              'middle');
          y -= averageHeight;
          yyText += (maxData.maxValue! / 10);
          if (textWidth < textSize!.width)
            textWidth = textSize.width;


        leftX -= (textWidth + space);
       else
        var y = pointOrigin!.dy;
        var yyText = 0.0;
        Size? textSize;
        var textWidth = 0.0;
        for (var j = 0; j < 11; j++)
          textSize = drawText(
              Utils().formatNumber(yyText),
              rightX,
              y,
              's',
              10.0,
              ColorsUtils.hexToColor(maxData.curveColorPlus!),
              'left',
              'middle');
          y -= averageHeight;
          yyText += (maxData.maxValue! / 10);
          if (textWidth < textSize!.width)
            textWidth = textSize.width;


        rightX += (textWidth + space);
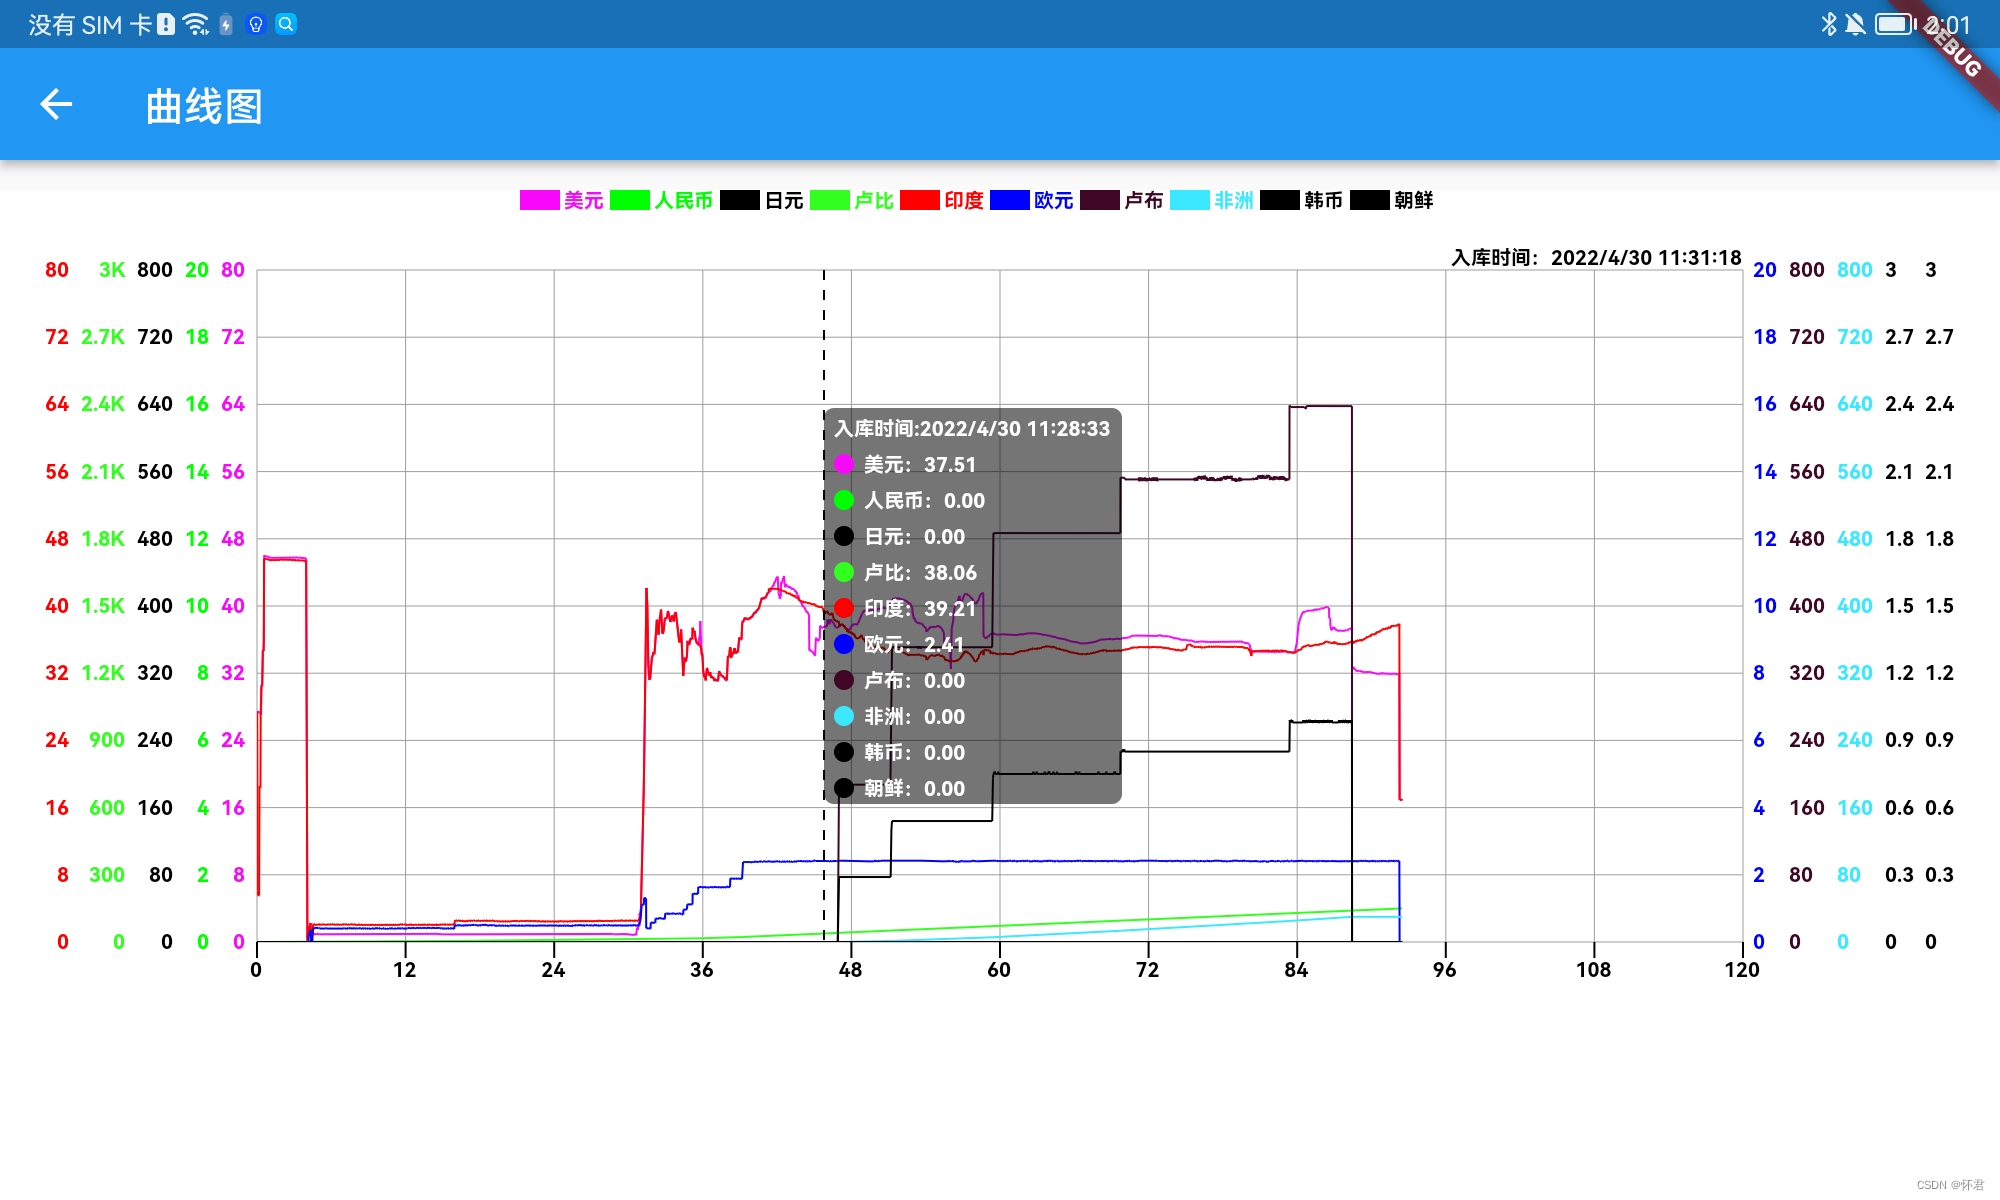
- 绘制曲线图
效果图
  void initDrawYYPointLine()
    ctx.save();
    ///先绘制区域
    Rect rect = Rect.fromLTWH(
        pointOrigin!.dx,
        pointTopLeft!.dy,
        pointTopRight!.dx - pointTopLeft!.dx,
        pointBottomRight!.dy - pointTopRight!.dy);
    ///裁剪区域以外的部分
    ctx.clipRect(rect);
    ///绘制每条曲线
    for (var points in fracturingModel.listPoints)
      drawLinePoints(points);

    ctx.restore();


  drawLinePoints(ListPoints points)
    if (points.isShow)
      paints.strokeWidth = 1.0;
      paints.style = PaintingStyle.stroke;
      paints.strokeCap = StrokeCap.butt;
      paints.strokeJoin = StrokeJoin.round;
      paints.color = points.color ?? Colors.black;
      ctx.drawPoints(PointMode.polygon, points.offsetZommScaleList, paints);
- 点击查看该点详情数据
效果图
  drawDashLine([fromX, fromY, toX, toY, gap])
    var path = Path();
    path.reset();
    path.moveTo(fromX, fromY);
    path.lineTo(toX, toY);
    paints.strokeWidth = 1.0;
    var paint = Paint()
      ..strokeWidth = 1.0
      ..color = Colors.black
      ..style = PaintingStyle.stroke;
    ctx.drawPath(getDashLine(path, gap, 5.0), paint);
    drawPointTextInfo(fromX, toX);


  Path getDashLine([path, dottedLength, dottedGap])
    Path targetPath = Path(); //虚线Path
    for (PathMetric metrice in path.computeMetrics())
      double distance = 0;
      bool isDrawDotted = true;
      while (distance < metrice.length)
        if (isDrawDotted)
          Path extractPath =
              metrice.extractPath(distance, distance + dottedLength);
          targetPath.addPath(extractPath, Offset.zero);
          distance += dottedLength;
         else
          distance += dottedGap;

        isDrawDotted = !isDrawDotted;


    return targetPath;


  ///绘制点击之后每个点的详细信息
  drawPointTextInfo(fromX, toX)
    var textWidth = 0.0;
    var textHeight = 0.0;
    for (var i = 0; i < fracturingModel.fracturingsInfoList.length; i++)
      var itemInfo = fracturingModel.fracturingsInfoList[i];
      Size textSize;
      if (i == 0)
        textSize = drawTextBoxSize(
            '入库时间:$itemInfo.warehousingTime  ', 10.0, 'typeface');
        textHeight += textSize.height + 5;
       else
        textSize = drawTextBoxSize(
            '$itemInfo.paramName:$itemInfo.detailValues  ',
            10.0,
            'typeface');

      textHeight += textSize.height + 5;
      if (textWidth < textSize.width)
        textWidth = textSize.width;


    textWidth += 10;
    var pointHeight = pointBottomRight!.dy - pointTopRight!.dy;
    var bottom = (pointHeight - textHeight) / 2;
    var top = bottom + textHeight;
    var paint = Paint();
    paint.color = Colors.black54;
    paint.style = PaintingStyle.fill;

    var l = 0.0;
    var t = 0.0;
    var r = 0.0;
    var b = 0.0;

    ///1.说明右边距离不够
    if (pointTopRight!.dx - fromX < textWidth)
      l = fromX - textWidth;
      r = fromX;
     else
      l = fromX;
      r = fromX + textWidth;

    t = getY(top);
    b = getY(bottom);

    RRect rrect = RRect.fromLTRBR(l, t, r, b, const Radius.circular(5.0));
    ctx.drawRRect(rrect, paint);
    var y = getY(top - 10);
    for (var i = 0; i < fracturingModel.fracturingsInfoList.length; i++)
      var itemInfo = fracturingModel.fracturingsInfoList[i];
      if (i == 0)
        Size size = drawText('入库时间:$itemInfo.warehousingTime', rrect.left + 5,
            y, 'typeface', 10.0, Colors.white, 'left', 'middle');
        y += size.height + 5;

      paint.color = ColorsUtils.hexToColor(itemInfo.curveColorPlus!);
      ctx.drawCircle(Offset(rrect.left + 10, y), 5, paint);
      Size textSize = drawText('$itemInfo.paramName:$itemInfo.detailValues',
          rrect.left + 20, y, 'typeface', 10.0, Colors.white, 'left', 'middle');
      y += textSize.height + 5;


  getX(x)
    return pointOrigin!.dx + x;


  getY(y)
    return pointOrigin!.dy - y;
在处理点击事件时,需要注意。根据点击坐标Offset 通过 paintRect!.contains(localPosition) 方法判断是否在此范围内,再做相应的UI绘制操作;
  ///返回点击类型 1点击曲线图 2.点击顶部标识
  onHitTest(Offset localPosition)
    ///画布类型
    if (paintRect != null && paintRect!.contains(localPosition))
      return 'type': 'curveGraph', 'position': '';
     else
    ///顶部标识类型
      for (var i = 0; i < listRect.length; i++)
        Rect rect = listRect[i];
        if (rect.contains(localPosition))
          return 'type': 'topTypeGraph', 'position': i;


    return 'type': 'cancel', 'position': '';
点击之后,拿到类型数据,做一系列的逻辑操作
  void onTapDown(detail, map)
    if (detail != null)
      var type = map['type'];
      if (type == 'curveGraph')
        ///点击的是曲线图
        localPosition = detail;
        var listPoint = listPoints[0];
        var length = listPoint.offsetList.length;
        var startOffset = listPoint.offsetList[0];
        var endOffset = listPoint.offsetList[length - 1];
        if (detail.dx > startOffset.dx || detail.dx < endOffset.dx)
          ///点击的x点
          var x = double.parse(getTimeX(detail.dx).toStringAsFixed(4));
          var fracturingList = fracturingsInfoList;
          for (var i = 0; i < fracturingList.length; i++)
            var fracturingMaxList = fracturingsInfoList[i];
            var itemList = fracturingList[i].listFracturing;
            var info = 0.0;
            var sjList = sjMaxList;
            var time = '';
                 ///通过二分查找到相应的索引,进行获取详细的数据信息,进行展示
            var index =
                MathUtil.binarySearchNums(sjList, 0, sjList.length - 1, x);
            if (index == -1)
              info = 0.0;
              time = '';
             else if (index == 0 || index == fracturingList.length - 1)
              info = itemList[index];
              time = cjsjList[index];
             else
              time = cjsjList[index];
              var x0 = sjList[index];
              var x1 = sjList[index + 1];
              var y0 = itemList[index];
              var y1 = itemList[index + 1];
              var k = (x - x0) / (x1 - x0);
              var y = y0 + (y1 - y0) * k;
              info = y;

            fracturingMaxList.warehousingTime = time;
            fracturingMaxList.detailValues = info.toStringAsFixed(2);


       else if (type == 'topTypeGraph')
      ///改变数据源重新渲染,是否绘制相对应的曲线
        var position = map['position'];
        fracturingsInfoList[position].isShow =
            !fracturingsInfoList[position].isShow;
        listPoints[position].isShow = !listPoints[position].isShow;
- 曲线缩放功能
属于拓展功能;
需要引用 在 文件中pubspec.yaml ,添加 syncfusion_flutter_sliders: ^20.1.57
要注意三种状态,
1.拖动起始点时,需要换算缩放比例与x轴的比例;
2.拖动结束点时,需要换算x轴的位移比例;
3.区间拖动时,需要换算缩放比例与x轴的比例;
  SfRangeValues onChangedSlide(SfRangeValues values, SfRangeValues oldSfRange)
    bottomScaleList.clear();

    ///刻度总宽度
    var totalWidth = values.end - values.start;
    var equalParts = totalWidth ~/ 10;

    ///起始位置
    var start = values.start;

    ///结束位置
    var end = values.end;
    zommScale = sjMax / totalWidth;
    var newMax = sjMax / zommScale;
    equalParts = newMax / 10;

    ///重新换算x轴比例
    ratioX = getRatioX(newMax);
    var oldWith = (width - marginLeft - marginRight);
    var newWidth = oldWith * zommScale;
    bottomScaleList.add(start);
    for (var i = 0; i < 10; i++)
      start += equalParts;
      bottomScaleList.add(start);

    if (oldSfRange.start == values.start)
      ///说明是拖动的结束点
      if (values.start != 0)
        translateX = values.start / sjMax * newWidth;
       else
        translateX = 0;

      for (var points in listPoints)
        points.offsetZommScaleList = List.from(points.offsetList);
        for (var i = 0; i < points.offsetZommScaleList.length; i++)
          var d = (points.offsetZommScaleList[i].dx - marginLeft) * zommScale +
              marginLeft;
          points.offsetZommScaleList[i] =
              Offset(d, points.offsetZommScaleList[i].dy);
          points.offsetZommScaleList[i] =
              points.offsetZommScaleList[i].translate(-translateX, 0.0);


     else if (oldSfRange.end == values.end)
      /// 说明是拖动的开始点
      if (values.end != 0)
        translateX = values.start / sjMax * newWidth;
       else
        translateX = (sjMax - totalWidth) / sjMax * newWidth;

      for (var points in listPoints)
        points.offsetZommScaleList = List.from(points.offsetList);
        for (var i = 0; i < points.offsetZommScaleList.length; i++)
          var d = (points.offsetZommScaleList[i].dx - marginLeft) * zommScale +
              marginLeft;
          points.offsetZommScaleList[i] =
              Offset(d, points.offsetZommScaleList[i].dy);
          points.offsetZommScaleList[i] =
              points.offsetZommScaleList[i].translate(-translateX, 0.0);


     else if (oldSfRange.start != values.start &&
        oldSfRange.end != values.end)
      print('说明是拖动的整条线');
      translateX = values.start / sjMax * newWidth;
      for (var points in listPoints)
        points.offsetZommScaleList = List.from(points.offsetList);
        for (var i = 0; i < points.offsetZommScaleList.length; i++)
          var d = (points.offsetZommScaleList[i].dx - marginLeft) * zommScale +
              marginLeft;
          points.offsetZommScaleList[i] =
              Offset(d, points.offsetZommScaleList[i].dy);
          points.offsetZommScaleList[i] =
              points.offsetZommScaleList[i].translate(-translateX, 0.0);


    return values;
效果图
项目demo地址:https://github.com/z244370114/flutter_demo
以上是关于Flutter——Canvas自定义曲线图的主要内容,如果未能解决你的问题,请参考以下文章


