使用Echarts实现拓扑结构(graph)
Posted 抛物线.
tags:
篇首语:本文由小常识网(cha138.com)小编为大家整理,主要介绍了使用Echarts实现拓扑结构(graph)相关的知识,希望对你有一定的参考价值。
使用Echarts实现集群维度拓扑结构
文章目录
1、业务实现背景
随着公司业务量的扩容,各种集群产品也在横向和纵向扩容,同时,也给管理者或者维护者带来一定的困难,因为集群太多了,没有一个完整的概览图,特别是当负责多种产品化的管理时,此时不同的角色对集群的关注点就有缺别了,如:
- 领导: 对于领导,肯定是想快速、直接的看到集群分布和组合,因为部分产品会存在关联耦合性,如云平台计算集群和底层提供存储的ceph集群、glusterfs集群、商业存储等。
- 维护者: 对于集群的维护者来说,当所负责的某个产品集群规模较小,数量较少时,可能维护者不需要在意,但是当同一个产品集群规模大数量过多时,那么最熟悉这个产品集群分布概览的估计只有维护者了,领导肯定不熟悉。并且这个概览多数都存在集群建设和长期维护者的大脑里,不过随着时间流逝,集群变多,建设者可能也会混淆,也需要简单思考下,才知道集群的“样子”。
- 接盘侠: 对于新入职或者接盘侠来说,就更加痛苦了,因为原建设者可能因为离职或者换岗位,仓促进行工作交接,导致”接盘侠“短期一脸迷茫。
2、拓扑结构设计
当前部门涉及的产品条线众多,当前计划集群拓扑结构仅统计比较庞大的几个产品线,如计算集群,容器集群,块存储集群,对象存储集群、文件存储集群。
-
首先,一个计算或者一个容器集群后端底层所对接的存储集群一定是要进行强关联的;
-
其次,对于像对象存储,文件存储这类,仅仅和数据中心关联即可。
-
最终,分层级设计拓扑结构。
-
第一层:数据中心,比如异地数据中心,如北京森华、酒仙桥、上海临港、嘉定、广东、合肥等数据中心为第一层;
-
第二层:通过产品维度进行区分,如文件存储产品、云主机产品、对象存储产品、容器产品;
-
第三层:确定每个数据中心的每个产品维度下的具体产品;
-
第四层:确定部分具有强关联的产品的关系,比如计算和底层块存储进行关联、容器和底层文件存储及对接的块存储进行关联等。
3、效果展示
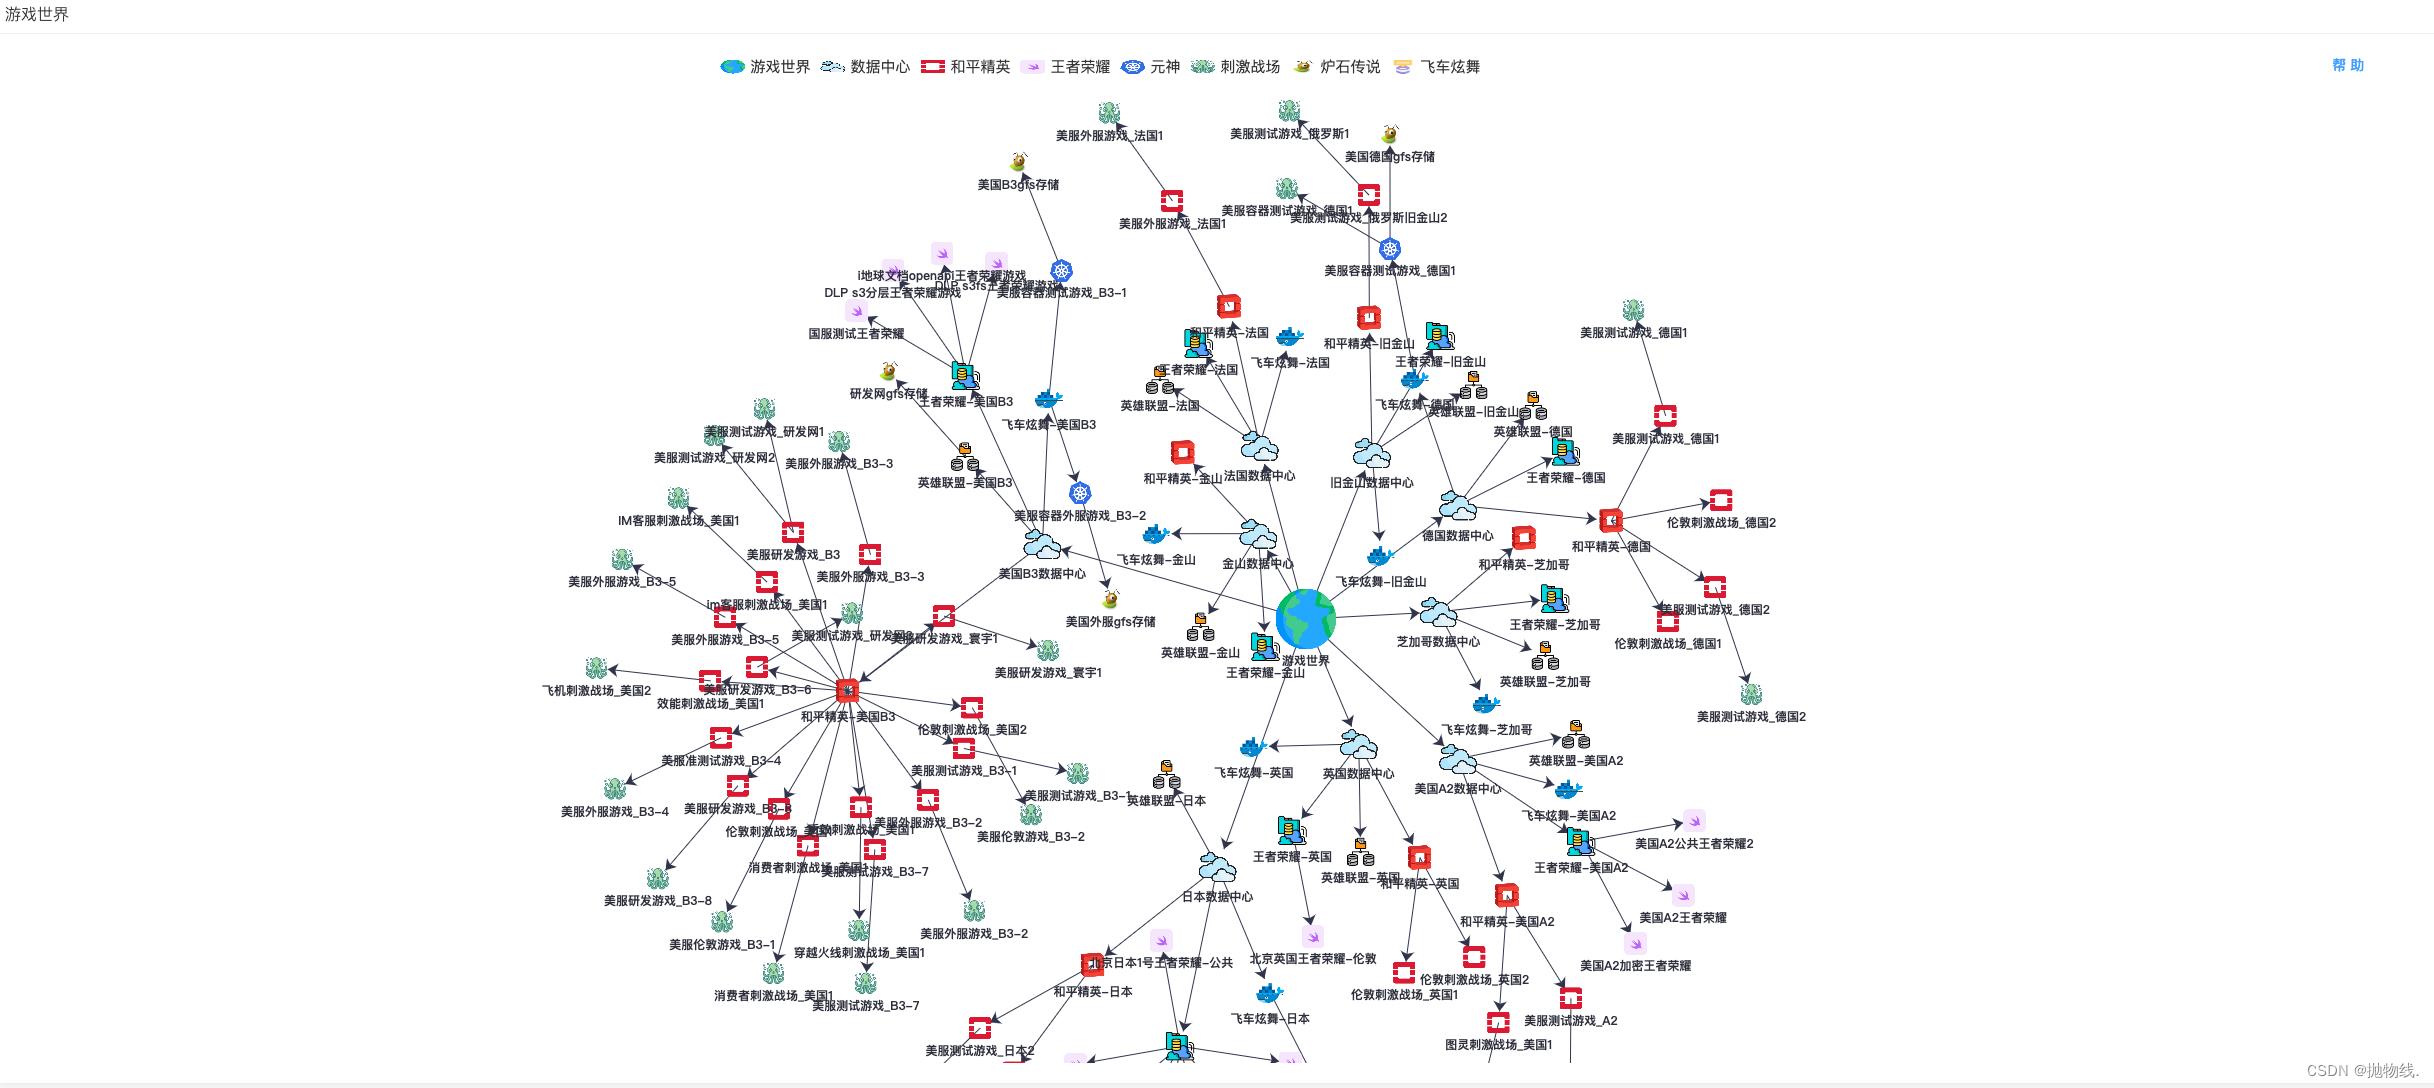
基于echarts实现拓扑结构
4、echarts相关代码实现
<template>
  <div id="overview_2">
    <div class="scrollbar-main1" style="height: 91vh; width: 100%">
      <el-scrollbar style="height:100%">
        <el-card shadow="hover" class="cardItem" header="xx云集群拓扑"
                 style="display: flex;flex-direction: column;width: 98%">
          <div>
            <el-popover
              placement="top-start"
              width="200"
              trigger="hover"
              content="集群拓扑可以任意拖拽、解绑、发散;鼠标悬停可展示集群region,eg: rg1_hfb3,rg1_bjsh">
              <el-button slot="reference" style="float: right; padding: 3px 0" type="text">帮 助</el-button>
            </el-popover>
          </div>
          <div id="chartgraph" class="pie-wrap" style="height: 100%; width: 98%"></div>
        </el-card>
      </el-scrollbar>
    </div>
  </div>
</template>

<script>
import * as echarts from 'echarts'

export default
  name: 'clustergraph',
  data ()
    return
  ,
  mounted ()
    this.getChartGraph()
  ,
  methods:
    getChartGraph ()
      this.$ajax.getRequest(
        url: '/cmdb_api/clustergraph',
        dataType: 'json',
        cb (data)
          let datas = JSON.parse(JSON.stringify(data.datas))
          let links = JSON.parse(JSON.stringify(data.links))
          let chartgraph = echarts.init(
            document.getElementById('chartgraph'),
            'macarons'
          )
          let option
          option =
            tooltip:
              trigger: 'item'
              // formatter: 'a <br/>b : c'
            ,
            showContent: true,
            color: ['#8378EA',
              '#f49f42',
              '#ea7ccc',
              '#3ba272',
              '#ee6666',
              '#9a60b4',
              '#37A2DA'],
            legend:
              show: true,
              textStyle:
                fontSize: '15px'
              ,
              data: [
                name: '游戏世界',
                icon: 'image://http://x.x.x.x:8111/icon/earth-icon.png'
                //icon:'image://./images/icon1.png'  //如果用图片img,格式为'image://+icon文件地址',其中image::后的//不能省略
              ,
                name: '数据中心',
                icon: 'image://http://x.x.x.x:8111/icon/clopng'
              ,
                name: '和平精英',
                icon: 'image://http://x.x.x.x:8111/icon/o.png'
              ,
                name: '王者荣耀',
                // icon: 'image://'+ require("../../assets/graph/swift-icon.png")
                icon: 'image://http://x.x.x.x:8111/icon/s.png'
              ,
                name: '元神',
                icon: 'image://http://x.x.x.x:8111/icon/ku.png'
              ,
                name: '刺激战场',
                icon: 'image://http://x.x.x.x:8111/icon/ce.png'
              ,
                name: '炉石传说',
                icon: 'image://http://x.x.x.x:8111/icon/g.png'
              ,
                name: '飞车炫舞',
                icon: 'image://http://x.x.x.x:8111/icon/cicon.png'

              ]
            ,
            series: [
              name: '集群信息',
              //name : "拓扑图", //系列名称,用于tooltip的显示,legend 的图例筛选,在 setOption 更新数据和配置项时用于指定对应的系列。
              type: 'graph', //关系图
              layout: 'force', //图的布局,类型为力导图,'circular' 采用环形布局,见示例 Les Miserables
              legendHoverLink: true, //是否启用图例 hover(悬停) 时的联动高亮。
              hoverAnimation: true, //是否开启鼠标悬停节点的显示动画
              coordinateSystem: null,//坐标系可选
              xAxisIndex: 0,//x轴坐标 有多种坐标系轴坐标选项
              yAxisIndex: 0,
              force:
                repulsion: 450, //相距距离
                edgeLength: [150, 200],
                layoutAnimation: true
              ,
              // force :  //力引导图基本配置
            //     //initLayout: ,//力引导的初始化布局,默认使用xy轴的标点
            //     repulsion : 200,//节点之间的斥力因子。支持数组表达斥力范围,值越大斥力越大。
            //     gravity : 0.03,//节点受到的向中心的引力因子。该值越大节点越往中心点靠拢。
            //     edgeLength :80,//边的两个节点之间的距离,这个距离也会受 repulsion。[10, 50] 。值越小则长度越长
            //     layoutAnimation : true
            //     //因为力引导布局会在多次迭代后才会稳定,这个参数决定是否显示布局的迭代动画,在浏览器端节点数据较多(>100)的时候不建议关闭,布局过程会造成浏览器假死。
            // ,
              roam: true, //是否开启鼠标缩放和平移漫游。默认不开启。如果只想要开启缩放或者平移,可以设置成 'scale' 或者 'move'。设置成 true 为都开启
              nodeScaleRatio: 0.6,//鼠标漫游缩放时节点的相应缩放比例,当设为0时节点不随着鼠标的缩放而缩放
              draggable: true,//节点是否可拖拽,只在使用力引导布局的时候有用。
              focusNodeAdjacency: true,//是否在鼠标移到节点上的时候突出显示节点以及节点的边和邻接节点。
              edgeSymbol: ['none', 'arrow'], //边两端的标记类型,可以是一个数组分别指定两端,也可以是单个统一指定。默认不显示标记,常见的可以设置为箭头,如下:edgeSymbol: ['circle', 'arrow']
              symbolSize: 50,
              edgeSymbolSize: 10, //边两端的标记大小,可以是一个数组分别指定两端,也可以是单个统一指定。
              itemStyle:
                normal:
                  label:
                    show: true

                  // borderType: 'solid',  //图形描边类型,默认为实线,支持 'solid'(实线), 'dashed'(虚线), 'dotted'(点线)。
                  // borderColor: 'rgba(255,215,0,0.4)',//设置图形边框为淡金色,透明度为0.4
                  // borderWidth: 2,//图形的描边线宽。为 0 时无描边。
                  // opacity: 1  //图形透明度。支持从 0 到 1 的数字,为 0 时不绘制该图形。默认0.5

                ,
                emphasis:
                //高亮状态

              ,
              lineStyle: //关系边的公用线条样式
                normal:
                  color: '#31354B',
                  width: '1',
                  type: 'solid',//线的类型 'solid'(实线)'dashed'(虚线)'dotted'(点线)
                  curveness: 0,
                  opacity: 1 //图形透明度。支持从 0 到 1 的数字,为 0 时不绘制该图形。默认0.5
                ,
                emphasis:
              ,
              label:
                normal:
                  show: true,
                  position: 'bottom',
                  textStyle:
                    color: '#2D2F3B',
                    fontStyle: 'normal', //文字字体的风格 'normal'标准 'italic'斜体 'oblique' 倾斜
                    fontWeight: 'bolder',
                    fontFamily: 'sans-serif',
                    fontSize: 12

                ,
                emphasis:
              ,
              edgeLabel:
                normal:
                  show: false
                ,
                emphasis:
              ,
              data: datas,
              // datas 结构:
              // [category: 1,name: "服务器1"]

                category: 0,
                name: "服务器1",
                tooltip:
                    formatter:'b<br />192.168.1.1'

            ,

                category: 0,
                name: "服务器2",
                tooltip:
                    formatter:'b<br />192.168.1.2'

            ,

                category: 0,
                name: "服务器3",
                tooltip:
                    formatter:'b<br />192.168.1.3'

            ,
              links: links,
              // links 结构 ,用于做关联绑定,只向target
              // [source: '服务器1',target: '服务器2',]
              categories: [
                name: '游戏世界',
                symbol: 'image://http://x.x.x.x:8111/icon/earth-icon.png'
              ,
                name: '数据中心',
                symbol: 'image://http://x.x.x.x:8111/icon/cl-icon.png'
              ,
                name: '和平精英',
                symbol: 'image://http://x.x.x.x:8111/icon/opeicon.png'
              ,
                name: '王者荣耀',
                symbol: 'image://http://x.x.x.x:8111/icon/s-icon.png'
              ,
                name: '元神',
                symbol: 'image://http://x.x.x.x:8111/icon/k.png'
              ,
                name: '刺激战场',
                symbol: 'image://http://x.x.x.x:8111/icon/ce.png'
              ,
                name: '炉石传说',
                symbol: 'image://http://x.x.x.x:8111/icon/glu.png'
              ,
                name: '飞车炫舞',
                symbol: 'image://http://x.x.x.x:8111/icon/cn.png'

              ]
            ]

          window.onresize = function ()
            chartgraph.resize()

          chartgraph.setOption(option)

      )


</script>

<style lang="less">
#overview_2
  .el-card__header
    padding: 8px 8px 8px 8px;


  .el-card__body
    width: 96%;
    height: 96%;


</style>

<style scoped lang="less">
#overview_2
  display: flex;
  flex-wrap: wrap;
  justify-content: space-evenly;

  .proms
    margin: 5px 5px 5px 5px;


  .cardHeader
    width: 98%;


  .cardItem
    margin-bottom: 2vh;
    margin-left: 1%;
    width: 96%;
    height: 89vh;


</style>
以上是关于使用Echarts实现拓扑结构(graph)的主要内容,如果未能解决你的问题,请参考以下文章