10分钟入门Matplotlib: 数据可视化介绍&使用教程
Posted DeepHub IMBA
tags:
篇首语:本文由小常识网(cha138.com)小编为大家整理,主要介绍了10分钟入门Matplotlib: 数据可视化介绍&使用教程相关的知识,希望对你有一定的参考价值。
“一张图胜过千言万语”,对于数据来说同样地,“一张可视化的图片胜过一张复杂的数据表格或报告”。
Matplotlib介绍
数据可视化是数据科学家需要掌握的必备技能之一。使用可视化技术可以理解和解决大多数业务问题。可视化主要包括探索性数据分析(EDA)和图形绘制。有效的可视化有助于用户了解数据中的模式,并有效地解决业务问题。可视化的另一个优点是能将复杂数据简化为易于理解的形式。
人们总是觉得图像比文本更容易理解,因此可视化是分析和解释数据的最佳手段,它能帮助用户轻松地理解大量的信息。数据可视化也有助于人们理解趋势、相关性、模式、分布等信息。
在数据可视化领域的众多工具和技术中,python是最常用的。Python为数据可视化提供了多个库,其中最常用的有:
Matplotlib
Seaborn
Pandas visualisation
Plotly
本文档将有助于你了解在业界被广泛使用的matplotlib库。Matplotlib具有丰富的图形功能,而且容易上手。本文主要介绍不同的图形功能,包括一些语法等。
Matplotlib的安装
matplotlib库有多种安装方法。最简单的安装matplotlib的方式是下载Anaconda包。因为Anaconda会默认安装Matplotlib,不需要你进行任何额外的步骤。
从anaconda的官方网站下载anaconda软件包
为了安装matplotlib,打开anaconda提示符并运行以下命令
pip install matplotlibor
conda install matplotlib在Jupyter notebook中运行以下命令以验证matplotlib是否正确安装
import matplotlibmatplotlib.__version__

请输入图片描述
如何使用Matplotlib
在使用matplotlib之前,我们需要在Jupyter notebook中使用‘import’方法来导入这个包。PyPlot是matplotlib中最常用的数据可视化模块,通常使用PyPlot就足以满足可视化的需求。
# import matplotlib library as mplimport matplotlib as mpl#import the pyplot module from matplotlib as plt (short name used for referring the object)import matplotlib.pyplot as plt

请输入图片描述
Matplotlib、Pyplot和Python之间的关系
Python是一种非常流行的编程语言,可以用于web开发、数学和统计分析。Python可以在大多数平台上工作,而且使用起来也很简单。
Python有很多库可以调用,用于可视化和数据分析的库主要以下几种。
NumPy
Pandas
Matplotlib
Seaborn
Plotly
SciKit-Learn
正如您所看到的,这里面包括matplotlib,它是使用python开发的。这个库被广泛用于数据可视化。
PyPlot是matplotlib中的一个模块,它提供类似于MATLAB的交互体验。MATLAB被广泛用于工业界中的统计分析。但MATLAB是一种需要许可的软件,且价格不菲。而PyPlot是一个开源模块,为python用户提供类似MATLAB的功能。总之,PyPlot在开源环境中被视为MATLAB的替代品。
绘制一个简单的图像
在这里,我们将使用NumPy生成的随机数来绘制一个简单的图像。创建图像最简单的方法是使用' plot() '方法。为了生成一个图像,我们需要两个坐标轴(X)和(Y),因此我们使用Numpy中的' linspace() '方法生成两个随机数列。
# import the NumPy package
import numpy as np
# generate random number using NumPy, generate two sets of random numbers and store in x, y
x = np.linspace(0,50,100)
y = x * np.linspace(100,150,100)
# Create a basic plot
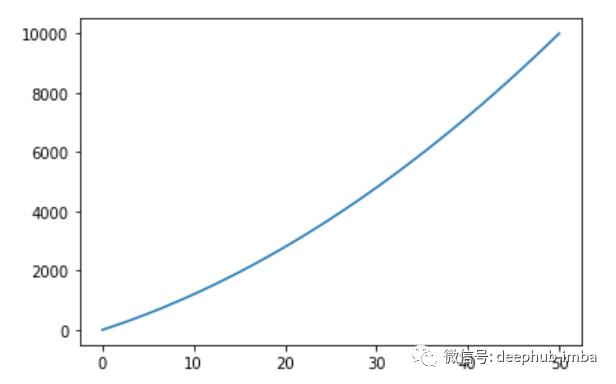
plt.plot(x,y)

请输入图片描述
生成的图像如下图所示:
请输入图片描述
为图像添加更多元素
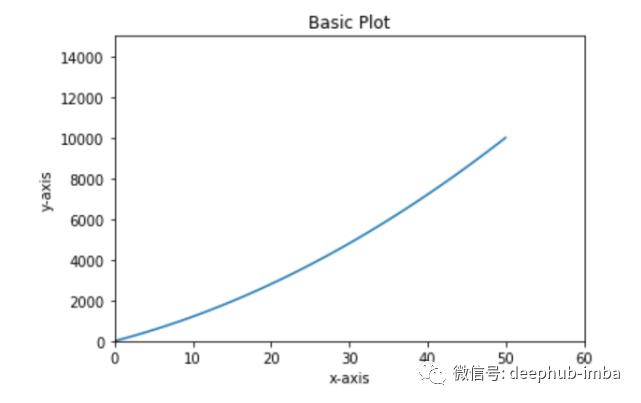
上面生成的图还缺少一些东西,让我们试着为它添加不同的元素,以便更好地解释这个图。可以为其添加的元素包括title、x-Label、y-label、x-limits、y-limits。
# set different elements to the plot generated above
# Add title using ‘plt.title’
# Add x-label using ‘plt.xlabel’
# Add y-label using ‘plt.ylabel’
# set x-axis limits using ‘plt.xlim’
# set y-axis limits using ‘plt.ylim’
# Add legend using ‘plt.legend’

请输入图片描述
请输入图片描述
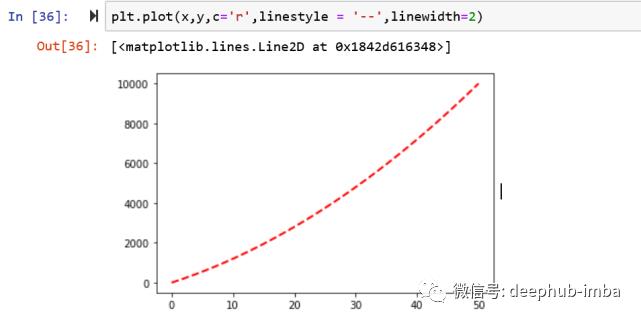
# add color, style, width to line element
plt.plot(x, y, c = 'r', linestyle = '--', linewidth=2)
请输入图片描述
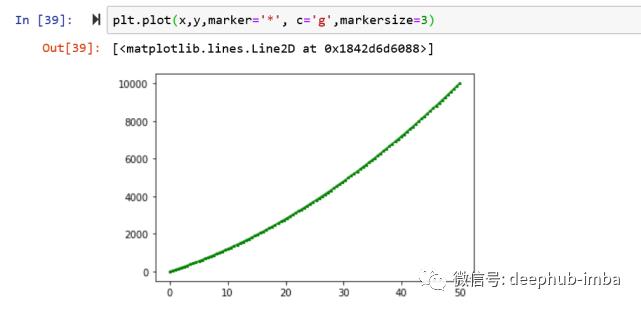
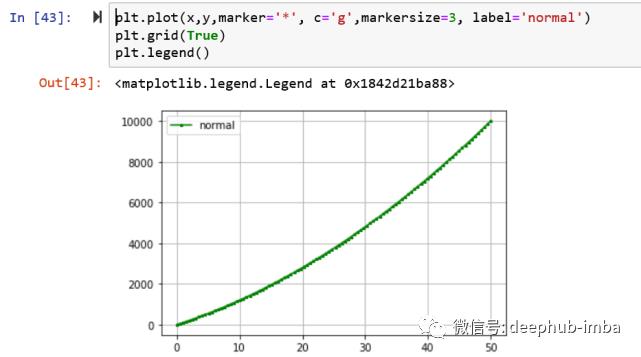
# add markers to the plot, marker has different elements i.e., style, color, size etc.,
plt.plot (x, y, marker='*', markersize=3, c=’g’)
请输入图片描述
# add grid using grid() method
Plt.grid(True)
# add legend and label
plt.legend()
请输入图片描述
图像自定义:
色彩
b –蓝色
c –青色
g –绿色
k –黑色
m –洋红色
r –红色
w –白色
y –黄色
可以使用十六进制或RGB格式
线型
'-' :实线
'--':虚线
'-。':点划线
':'–虚线
标记样式
。–点标记
,–像素标记
v –三角形向下标记
^ –三角形向上标记
<–三角形左标记
>–三角形右标记
1 –三脚架下降标记
2 –三脚架向上标记
3 –三脚架左标记
4 –三脚架右标记
s –方形标记
p –五边形标记
–星形标记
其他配置属性
color or c
linestyle
linewidth
marker
markeredgewidth
markeredgecolor
markerfacecolor
markersize
在一张图中绘制多个函数
在某些情况下,出于特殊目的,用户可能必须在单个图像中显示多个函数。例如,零售商想知道最近12个月中两家分店的销售趋势,而他希望在同一个坐标轴里查看两家商店的趋势。
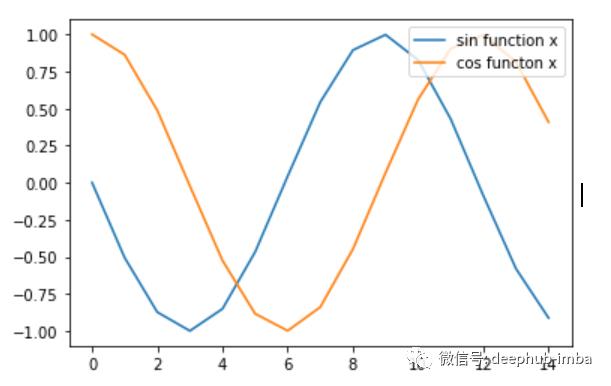
让我们在一张图中绘制两条线sin(x)和cos(x),并添加图例以了解哪一条线是什么。
# lets plot two lines Sin(x) and Cos(x)
# loc is used to set the location of the legend on the plot
# label is used to represent the label for the line in the legend
# generate the random number
x= np.arange(0,1500,100)
plt.plot(np.sin(x),label='sin function x')
plt.plot(np.cos(x),label='cos functon x')
plt.legend(loc='upper right')
请输入图片描述

请输入图片描述
# To show the multiple plots in separate figure instead of a single figure, use plt.show() statement before the next plot statement as shown below
x= np.linspace(0,100,50)
plt.plot(x,'r',label='simple x')
plt.show()
plt.plot(x*x,'g',label='two times x')
plt.show()
plt.legend(loc='upper right')

请输入图片描述
创建子图
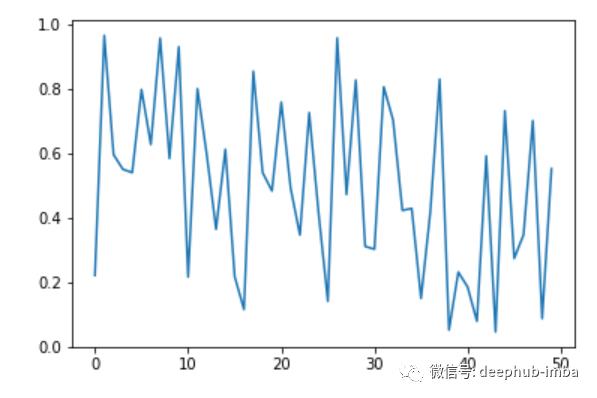
在某些情况下,如果我们要给股东汇报公司最近的情况,我们需要在一个图中显示多个子图。这可以通过使用matplotlib库中的subplot来实现。例如,一家零售店有6家分店,经理希望在一个展示窗口中看到6家商店的每日销售额并进行比较。这可以通过subplots将报表的行和列进行可视化处理。
# subplots are used to create multiple plots in a single figure
# let’s create a single subplot first following by adding more subplots
x = np.random.rand(50)
y = np.sin(x*2)
#need to create an empty figure with an axis as below, figure and axis are two separate objects in matplotlib
fig, ax = plt.subplots()
#add the charts to the plot
ax.plot(y)
请输入图片描述

请输入图片描述
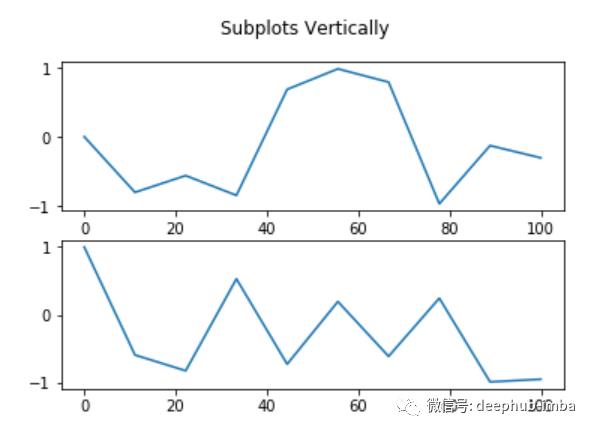
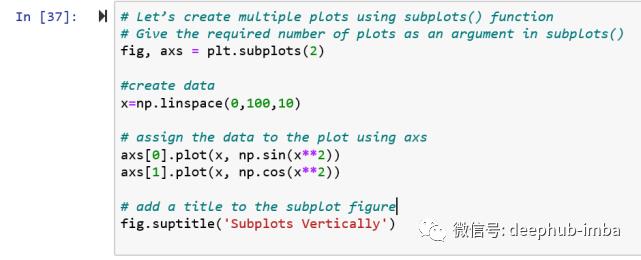
# Let’s add multiple plots using subplots() function
# Give the required number of plots as an argument in subplots(), below function creates 2 subplots
fig, axs = plt.subplots(2)
#create data
x=np.linspace(0,100,10)
# assign the data to the plot using axs
axs.plot(x, np.sin(x**2))
axs.plot(x, np.cos(x**2))
# add a title to the subplot figure
fig.suptitle('Vertically stacked subplots')
请输入图片描述
请输入图片描述
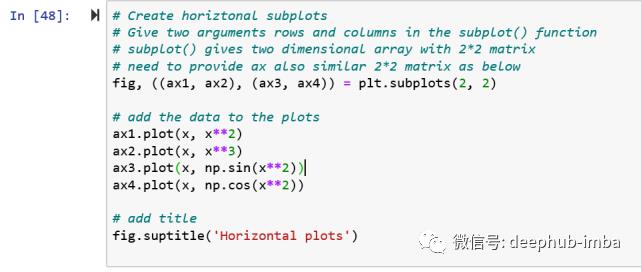
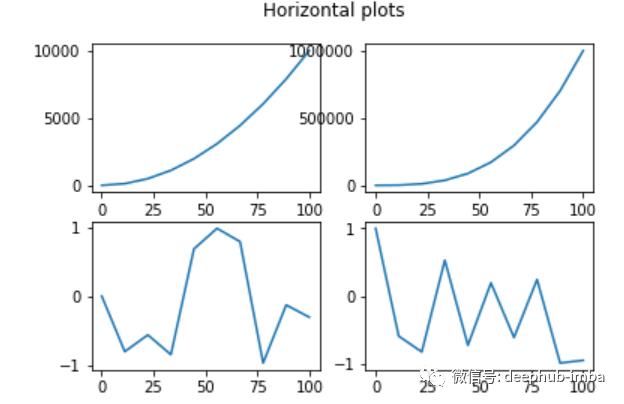
# Create horizontal subplots
# Give two arguments rows and columns in the subplot() function
# subplot() gives two dimensional array with 2*2 matrix
# need to provide ax also similar 2*2 matrix as below
fig, ((ax1, ax2), (ax3, ax4)) = plt.subplots(2, 2)
# add the data to the plots
ax1.plot(x, x**2)
ax2.plot(x, x**3)
ax3.plot(x, np.sin(x**2))
ax4.plot(x, np.cos(x**2))
# add title
fig.suptitle('Horizontal plots')
请输入图片描述
请输入图片描述
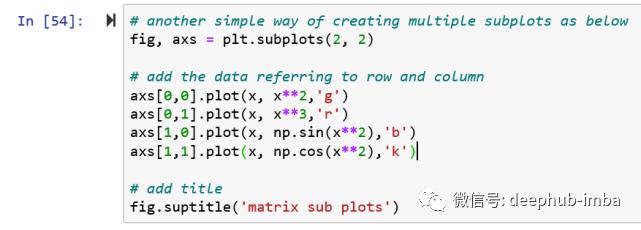
# another simple way of creating multiple subplots as below, using axs
fig, axs = plt.subplots(2, 2)
# add the data referring to row and column
axs.plot(x, x**2,'g')
axs.plot(x, x**3,'r')
axs.plot(x, np.sin(x**2),'b')
axs.plot(x, np.cos(x**2),'k')
# add title
fig.suptitle('matrix sub plots')
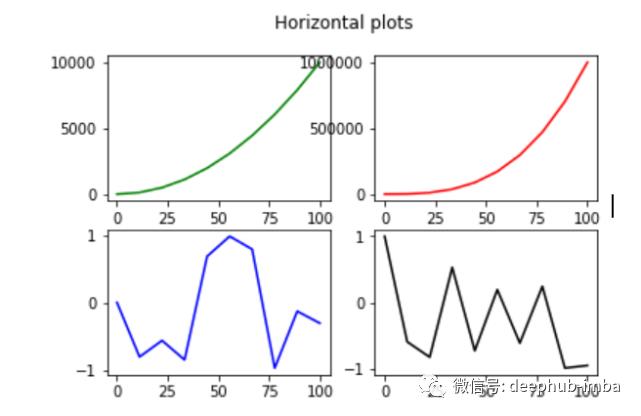
请输入图片描述
请输入图片描述
Figure对象
Matplotlib是一个面向对象的库,包括对象、方法等。我们所绘制的图也是Figure对象中的类之一。Figure对象是用于显示图的容器,可通过调用Figure()函数实现。
Figsize – (宽, 高)英寸
Dpi –用于调整每英寸网点数(可根据打印质量进行调整)
facecolor
edgecolor
linewidth
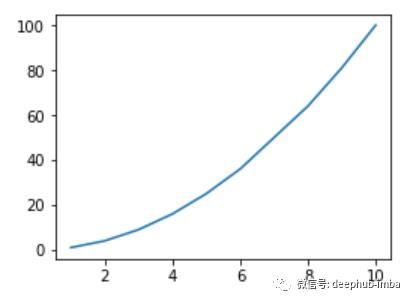
# let’s create a figure object
# change the size of the figure is ‘figsize = (a,b)’ a is width and ‘b’ is height in inches
# create a figure object and name it as fig
fig = plt.figure(figsize=(4,3))
# create a sample data
X = np.array()
Y = X**2
# plot the figure
plt.plot(X,Y)
请输入图片描述

请输入图片描述
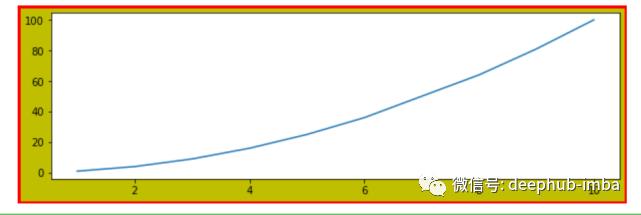
# let’s change the figure size and also add additional parameters like facecolor, edgecolor, linewidth
fig = plt.figure(figsize=(10,3),facecolor='y',edgecolor='r',linewidth=5)
请输入图片描述
Axes对象
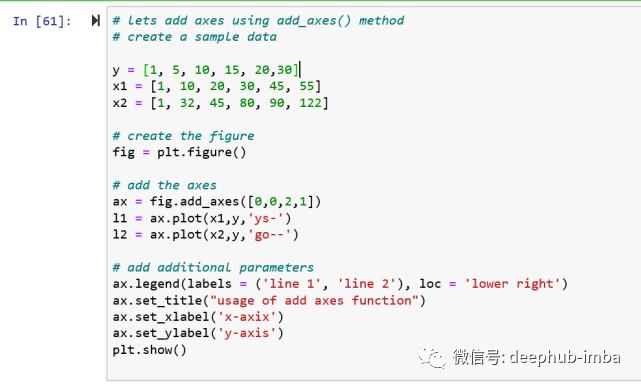
Axes是指绘制数据的区域,我们可以使用' add_axes() '将Axes添加到图中。该方法需要以下四个参数:,Left,Bottom,Width,Height
Left–Axes与图中左侧的距离
Bottom–Axes与图中底部的距离
Width–Axes的宽度
Height–Axes的高度
Axes的其他属性:
Set title using ‘ax.set_title()’
Set x-label using ‘ax.set_xlabel()’
Set y-label using ‘ax.set_ylabel()’
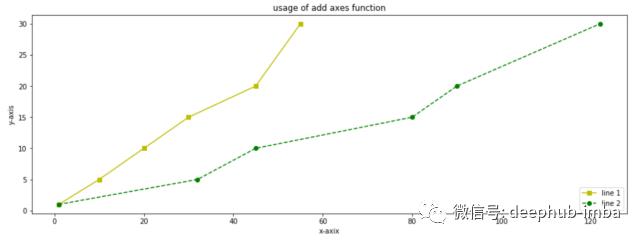
# lets add axes using add_axes() method
# create a sample data
y =
x1 =
x2 =
# create the figure
fig = plt.figure()
# add the axes
ax = fig.add_axes()
l1 = ax.plot(x1,y,'ys-')
l2 = ax.plot(x2,y,'go--')
# add additional parameters
ax.legend(labels = ('line 1', 'line 2'), loc = 'lower right')
ax.set_title("usage of add axes function")
ax.set_xlabel('x-axix')
ax.set_ylabel('y-axis')
plt.show()
请输入图片描述
请输入图片描述
Matplotlib中的绘图类型
Matplotlib有各种各样的绘图类型,包括条形图、折线图、饼状图、散点图、气泡图、瀑布图、圆形区域图、堆叠条形图等,我们将通过一些例子来介绍它们。这些图的许多属性都是通用的,如axis, color等,但有些属性却是特有的。
条形图
概述:
条形图使用水平或垂直方向的长条去表示数据。条形图用于显示两个或多个类别的值,通常x轴代表类别。每个长条的长度与对应类别的计数成正比。
函数:
用于显示条形图的函数是' plt .bar() '
bar()函数需要输入X轴和Y轴的数据
自定义:
plt.bar()函数具有以下参数,可用于配置绘图:
Width, Color, edge colour, line width, tick_label, align, bottom,
Error Bars – xerr, yerr
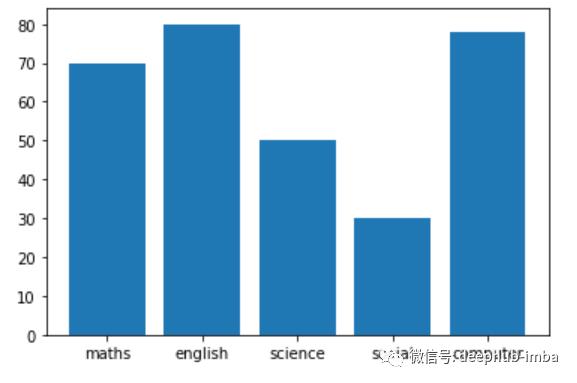
# lets create a simple bar chart
# x-axis is shows the subject and y -axis shows the markers in each subject
例子:
subject =
marks =
plt.bar(subject,marks)
plt.show()
请输入图片描述
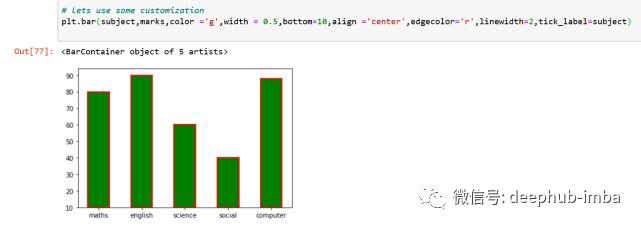
#let’s do some customizations
#width – shows the bar width and default value is 0.8
#color – shows the bar color
#bottom – value from where the y – axis starts in the chart i.e., the lowest value on y-axis shown
#align – to move the position of x-label, has two options ‘edge’ or ‘center’
#edgecolor – used to color the borders of the bar
#linewidth – used to adjust the width of the line around the bar
#tick_label – to set the customized labels for the x-axis
plt.bar(subject,marks,color ='g',width = 0.5,bottom=10,align ='center',edgecolor='r',linewidth=2,tick_label=subject)
请输入图片描述
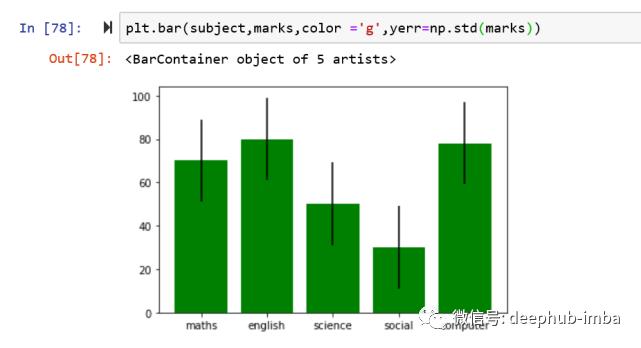
# errors bars could be added to represent the error values referring to an array value
# here in this example we used standard deviation to show as error bars
plt.bar(subject,marks,color ='g',yerr=np.std(marks))
请输入图片描述
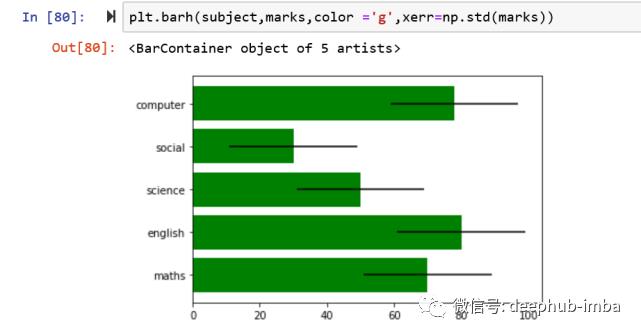
# to plot horizontal bar plot use plt.barh() function
plt.barh(subject,marks,color ='g',xerr=np.std(marks))
请输入图片描述
饼状图
概述:
饼状图表示每个值相对于所有值之和的比例。饼状图上的值以扇形的形式显示了每个值的百分比贡献。扇形的角度是根据值的比例计算的。当我们试图比较总体中的不同部分时,这种可视化效果是最好的。例如,一个销售经理想要知道一个月里不同付款类型所占比例,如现金、信用卡、借记卡、PayPal等应用的支付比例。
函数:
用于饼状图的函数是' plt.pie() '
为了绘制饼状图,我们需要输入一个列表,每个扇形都是先计算列表中的值所占比例,再转换成角度得到的
自定义:
plt.pie()函数具有以下参数,可用于配置绘图。
labels – 用于显示每个扇形所属的类别
explode – 用于突出扇形
autopct –用于显示扇形区域所占百分比
shadow –在扇形上显示阴影
colours –为扇形设置自定义颜色
startangle –设置扇形的角度
例子:
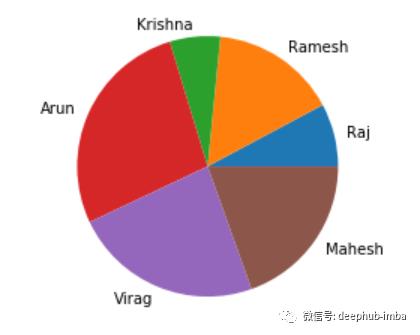
# Let’s create a simple pie plot
# Assume that we have a data on number of tickets resolved in a month
# the manager would like to know the individual contribution in terms of tickets closed in the week
# data
Tickets_Closed =
Agents =
# create pie chart
plt.pie(Tickets_Closed, labels = Agents)

请输入图片描述
请输入图片描述
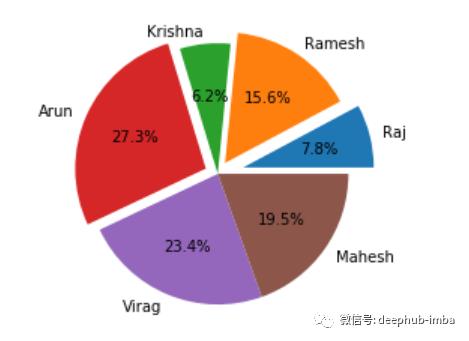
#Let’s add additional parameters to pie plot
#explode – to move one of the wedges of the plot
#autopct – to add the contribution %
explode =
plt.pie(Tickets_Closed, labels = Agents, explode=explode, autopct='%1.1f%%' )

请输入图片描述
请输入图片描述
散点图
概述:
散点图通过显示数据点来展示两列数据之间的关系。绘制散点图需要两个变量,一个变量表示X轴位置,另一个变量表示y轴位置。散点图用于表示变量之间的关联,通常建议在进行回归之前使用。散点图有助于理解数据的以下信息:
两列数据间的任何关系
+ ve(阳性)关系
-ve(阴性)关系
函数:
用于散点图的函数是“pl .scatter()”
自定义:
scatter()函数具有以下参数,用于配置绘图。
size – 设置点的大小
color –设置点的颜色
marker – 标记的类型
alpha – 点的透明度
norm –规范化数据(将数据归一化0至1)
例子:
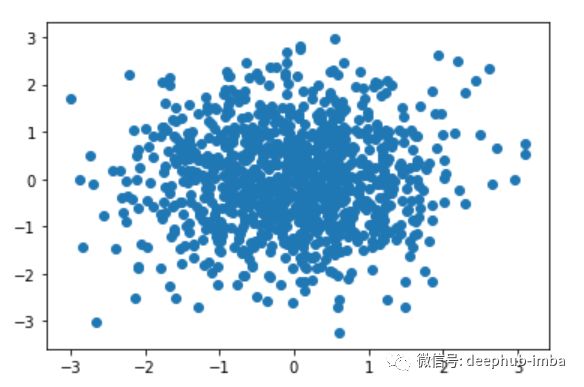
# let's create a simple scatter plot
# generate the data with random numbers
x = np.random.randn(1000)
y = np.random.randn(1000)
plt.scatter(x,y)

请输入图片描述
请输入图片描述
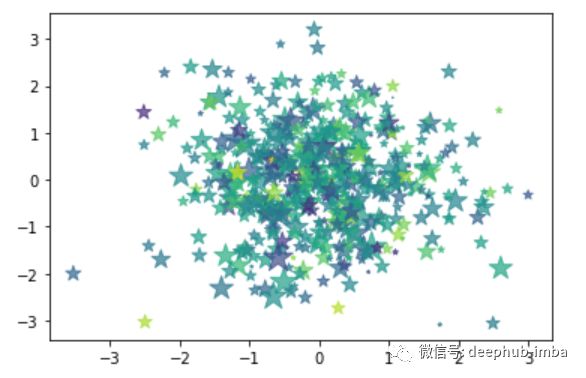
# as you observe there is no correlation exists between x and y
# let’s try to add additional parameters
# size – to manage the size of the points
#color – to set the color of the points
#marker – type of marker
#alpha – transparency of point
size = 150*np.random.randn(1000)
colors = 100*np.random.randn(1000)
plt.scatter(x, y, s=size, c = colors, marker ='*', alpha=0.7)

请输入图片描述
请输入图片描述
直方图
概述:
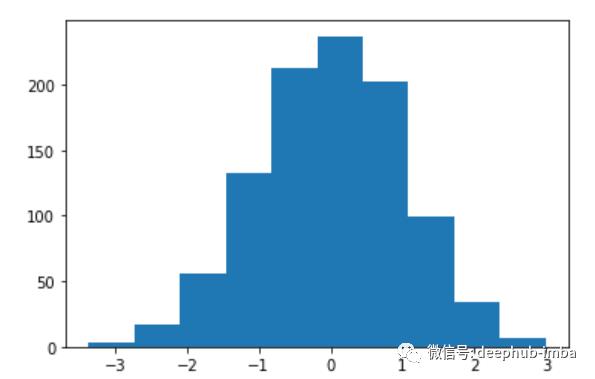
直方图是用来了解数据分布的。它是对连续数据概率分布的估计。它与上面讨论的条形图相似,但它用于表示连续变量的分布,而条形图用于表示离散变量的分布。每个分布都有四个不同的特征,包括
分布中心
分布散布
分布形状
分布峰值
直方图需要两个输入,x轴表示bin, y轴表示数据集中每个bin对应值的频率。每个bin都有一个最小值和最大值的范围。
函数:
绘制直方图使用的函数是“plt.hist()”
自定义:
函数的具体参数如下,可用于配置绘图:
bins – bin的个数
color-颜色
edgecolor-边缘的颜色
alpha – 颜色透明度
normed –正则化
xlim – X轴范围
ylim –Y轴范围
xticks, yticks-坐标轴的刻度
facecolor-柱的颜色
例子:
# let’s generate random numbers and use the random numbers to generate histogram
data = np.random.randn(1000)
plt.hist(data)

请输入图片描述
请输入图片描述
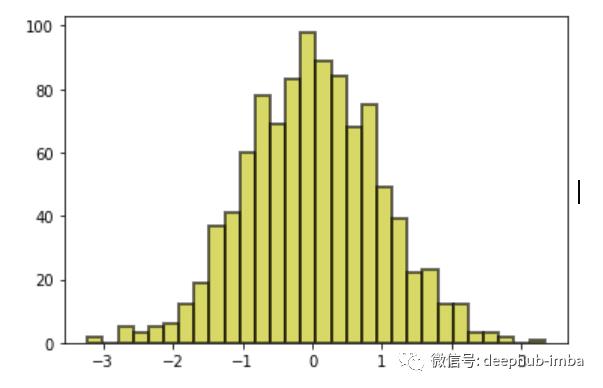
# let’s add additional parameters
# facecolor
# alpha
# edgecolor
# bins
data = np.random.randn(1000)
plt.hist(data, facecolor ='y',linewidth=2,edgecolor='k', bins=30, alpha=0.6)

请输入图片描述
请输入图片描述
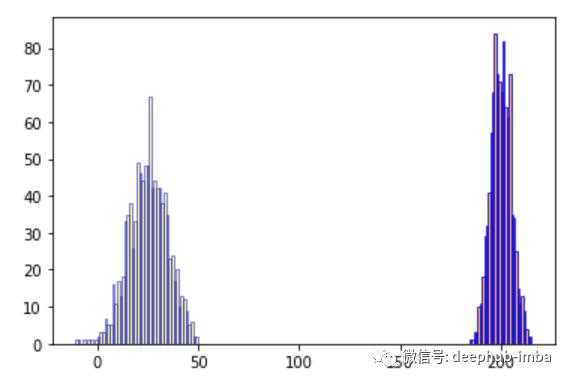
# lets create multiple histograms in a single plot
# Create random data
hist1 = np.random.normal(25,10,1000)
hist2 = np.random.normal(200,5,1000)
#plot the histogram
plt.hist(hist1,facecolor = 'yellow',alpha = 0.5, edgecolor ='b',bins=50)
plt.hist(hist2,facecolor = 'orange',alpha = 0.8, edgecolor ='b',bins=30)

请输入图片描述
请输入图片描述
保存绘图
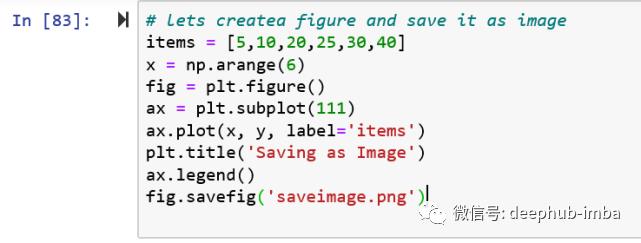
使用matplotlib中的“savefig()”函数可将图保存到本地。图可以以多种格式保存,如.png、.jpeg、.pdf以及其他支持的格式。
# let's create a figure and save it as image
items =
x = np.arange(6)
fig = plt.figure()
ax = plt.subplot(111)
ax.plot(x, y, label='items')
plt.title('Saving as Image')
ax.legend()
fig.savefig('saveimage.png')
请输入图片描述
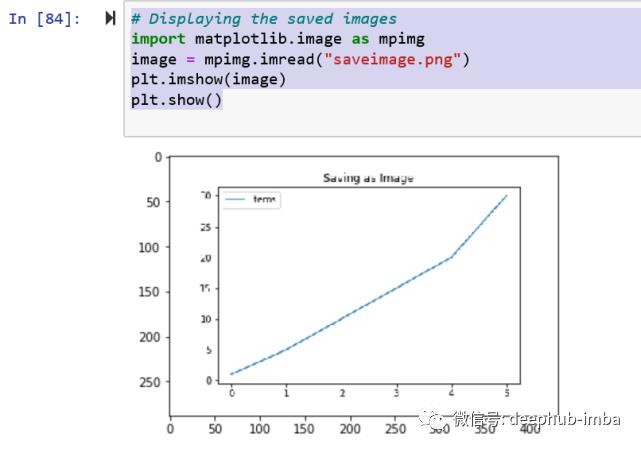
图像以“saveimage.png”为文件名保存。
#To display the image again, use the following package and commands
import matplotlib.image as mpimg
image = mpimg.imread("saveimage.png")
plt.imshow(image)
plt.show()
请输入图片描述
Matplotlib教程到此结束。
作者: Mr. Sridhar Anchoori
deephub翻译组:zhangzc
每日大数据和人工智能的重磅干货
大厂职位内推信息
好看就点在看!
以上是关于10分钟入门Matplotlib: 数据可视化介绍&使用教程的主要内容,如果未能解决你的问题,请参考以下文章