Pandas技巧:万能转格式轻松合并压缩数据,让数据分析更高效
Posted 大数据与机器学习文摘
tags:
篇首语:本文由小常识网(cha138.com)小编为大家整理,主要介绍了Pandas技巧:万能转格式轻松合并压缩数据,让数据分析更高效相关的知识,希望对你有一定的参考价值。
Pandas实用技巧
   import numpy as np
import pandas as pd
import random

n = 10
df = pd.DataFrame(
    {
        "col1": np.random.random_sample(n),
        "col2": np.random.random_sample(n),
        "col3": [[random.randint(0, 10) for _ in range(random.randint(3, 5))] for _ in range(n)],
    }
)
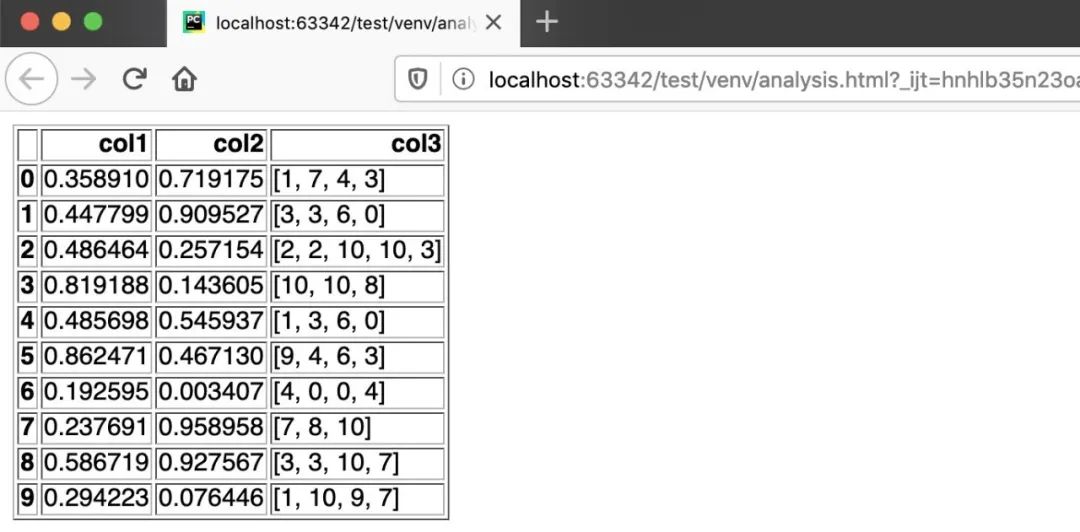
   df_html = df.to_html()
with open(‘analysis.html’, ‘w’) as f: f.write(df_html)
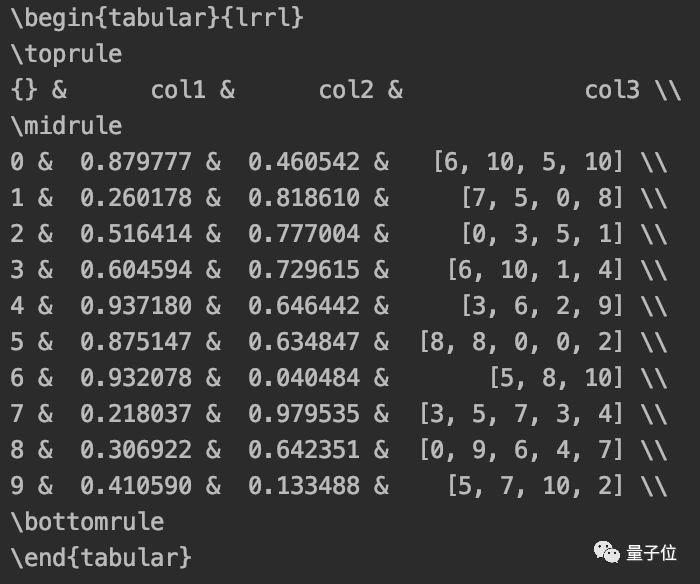
df.to_latex()
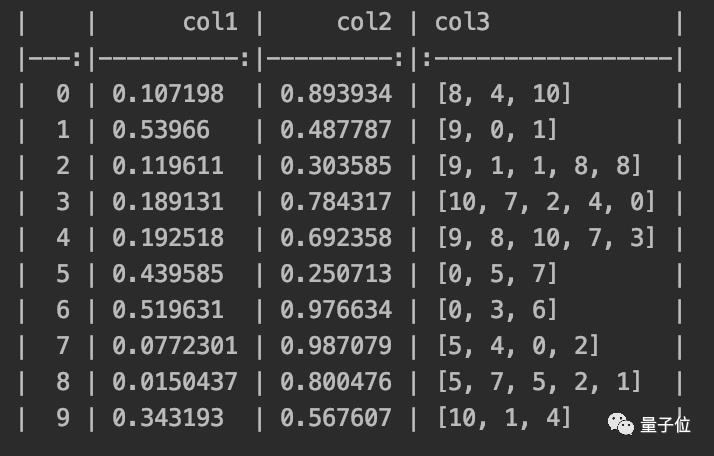
print(df.to_markdown())
df.to_excel(‘analysis.xlsx’)
df.to_string()
5个鲜为人知的Pandas技巧
import pandas as pd
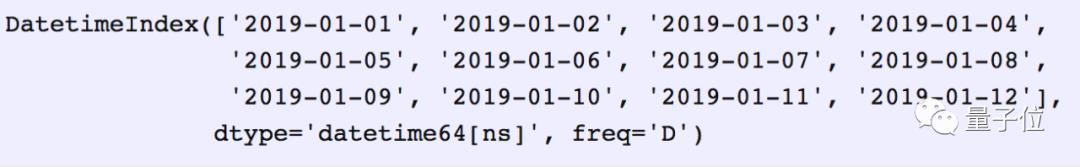
date_from = “2019-01-01”
date_to = “2019-01-12”
date_range = pd.date_range(date_from, date_to, freq=”D”)
print(date_range)
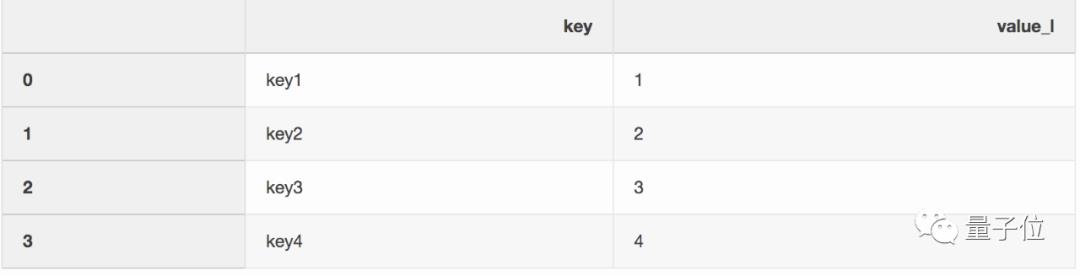
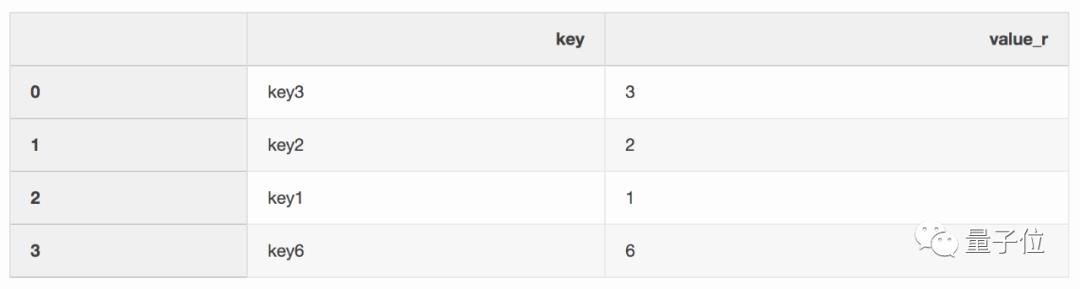
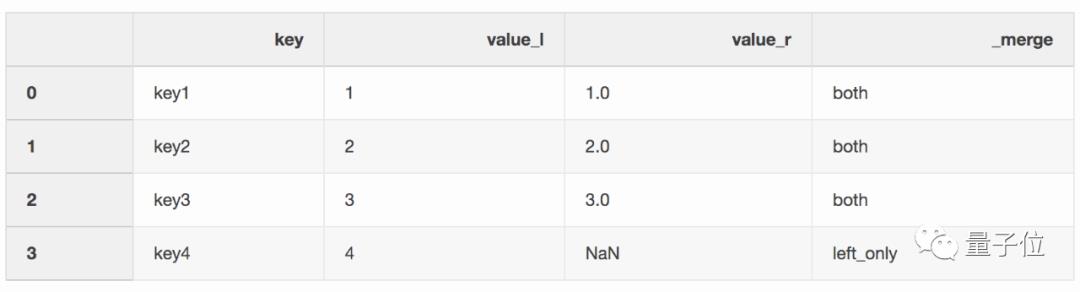
df_merge = left.merge(right, on = ‘key’, how = ‘left’, indicator = True)
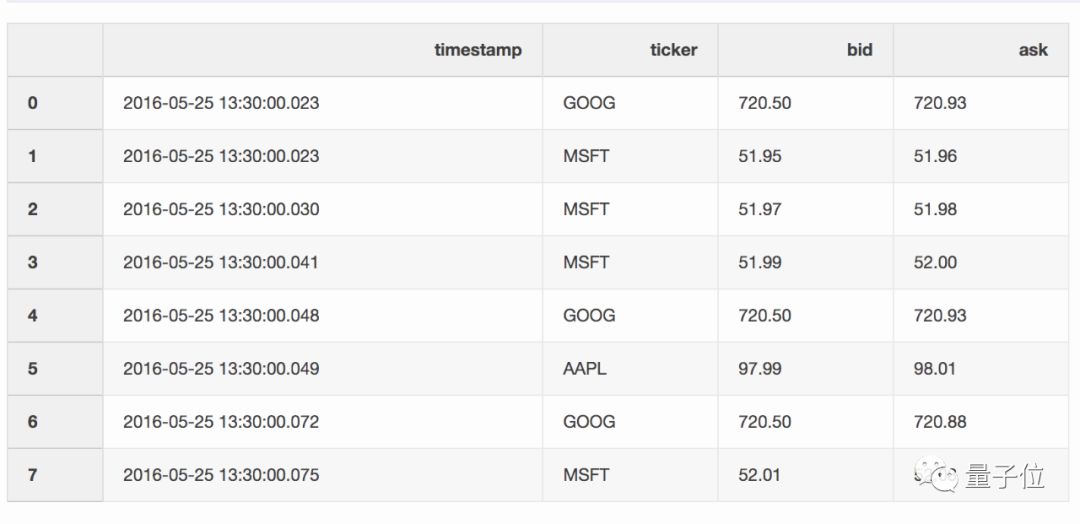
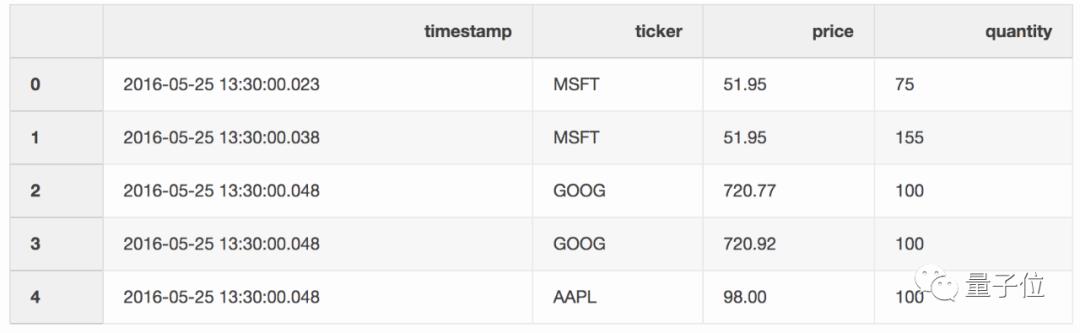
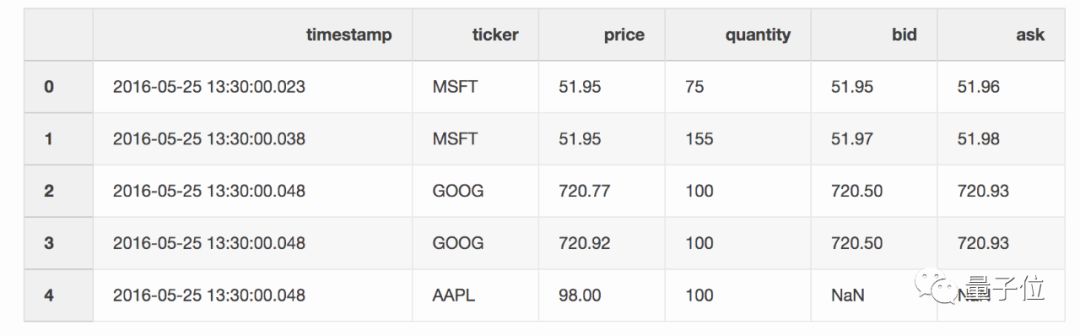
pd.merge_asof(trades, quotes, on=”timestamp”, by=’ticker’, tolerance=pd.Timedelta(‘10ms’), direction=‘backward’)
   import numpy as np
import pandas as pd

df = pd.DataFrame(np.array([[1, 2, 3], [4, 5, 6], [7, 8, 9]]), columns=["a", "b", "c"])

report_name =  example_report.xlsx
sheet_name =  Sheet1
writer = pd.ExcelWriter(report_name, engine= xlsxwriter )
df.to_excel(writer, sheet_name=sheet_name, index=False)
   # define the workbook
workbook = writer.book
worksheet = writer.sheets[sheet_name]
# create a chart line object
chart = workbook.add_chart({ type :  line })
# configure the series of the chart from the spreadsheet
# using a list of values instead of category/value formulas:
#     [sheetname, first_row, first_col, last_row, last_col]
chart.add_series({
     categories : [sheet_name, 1, 0, 3, 0],
     values :     [sheet_name, 1, 1, 3, 1],
})
# configure the chart axes
chart.set_x_axis({ name :  Index ,  position_axis :  on_tick })
chart.set_y_axis({ name :  Value ,  major_gridlines : { visible : False}})
# place the chart on the worksheet
worksheet.insert_chart( E2 , chart)
# output the excel file
writer.save()
   df = pd.DataFrame(pd.np.random.randn(50000,300))
df.to_csv(‘random_data.csv’, index=False)
df.to_csv(‘random_data.gz’, compression=’gzip’, index=False)
看完本文有收获?请转发分享给更多人
关注「大数据与机器学习文摘」,成为Top 1%
好文章,我在看❤️
以上是关于Pandas技巧:万能转格式轻松合并压缩数据,让数据分析更高效的主要内容,如果未能解决你的问题,请参考以下文章