从Scratch在Python中的朴素贝叶斯分类
Posted 相约机器人
tags:
篇首语:本文由小常识网(cha138.com)小编为大家整理,主要介绍了从Scratch在Python中的朴素贝叶斯分类相关的知识,希望对你有一定的参考价值。
作者 | pavan kalyan urandur
来源 | Medium
编辑 | 代码医生团队
在机器学习中,朴素贝叶斯分类器属于概率分类器的类别。概率分类器可以通过使用一组类别上的概率分布来预测给定观察,并且基于该分布,它将预测观察应该属于的最可能的类别。
朴素贝叶斯分类是一种基于着名和众所周知的贝叶斯概率定理对数据集进行分类的概率方法。朴素贝叶斯分类中的关键术语是先验概率,后验概率,似然概率和证据概率。
在执行朴素贝叶斯分类时,常用的概率分布是高斯分布,多项分布,伯努利分布等。在本文中,将使用高斯分布,因为它可以与大多数实时数据相关(按照中心限制定理如果你测量的东西有很多(小的,独立的)原因(或组件),那么测量将表现得像正态分布一样)并且它很容易实现,因为只需要数据的均值和标准偏差。甚至可以将此实现称为高斯朴素贝叶斯分类。
来看看Naive Bayes定理背后的数学公式。

P(c / x)表示给定输入特征x的类c的概率。这个术语称为后验概率函数,有兴趣发现。示例:给定输入向量或要素x属于类c的概率是多少。
P(x / c)表示同一组特征x可以贡献给特定类c的概率是多少,或者是给定一组结果(这里是c)的某些观察参数(这里是x)的概率的数量是在给定观察结果的情况下,将这组参数值(此处为c)视为可能性。该术语称为似然函数。
P(c)表示输入示例的哪一部分属于类c,数据集中的输入示例总数。示例:属于类c的数据集中存在的输入示例总数与输入示例总数的比率是多少。对于二元分类问题(具有类c1,c2),P(c1)= 1-P(c2)。该术语称为先验概率函数。
事实上,贝叶斯定理的分子足以预测类,因为分母独立于任何类c。
现在给定一个数据集,很容易找到先验概率函数P(c)。兴趣只转向似然函数,因为需要根据似然和先验函数的乘积来预测类别(后验概率)。
深入探讨可能的引擎术语P(x / c)并得出一些重要的假设和结论。假设数据集中有n个特征,因此整体x可以写成x = [X1,X2,X3 ...... Xn]由列连接,其中X1,X2,X3 ......。Xn表示数据集中存在的各个特征。这些专栏中的一个重要假设是“ 所有这些列都是独立的 ”。
现在x是各个特征X1,X2,X3 ...... Xn的组合,可以用以下方式写P(x / c):

从基本概率来看,知道如果两个事件A和B是不相交的或独立的,那么,

所以似然函数是:

贝叶斯定理的分子称为联合概率分布,对寻找P(x)的值不感兴趣,因为它独立于类标签c。根据联合概率分布(忽略分母P(x))的所有后验概率写成:


现在计算每个特征的似然函数,使用高斯分布,其通过均值和西格玛(标准差)参数化。
还可以计算整个数据集的似然函数,但参数将是平均向量和协方差向量。
因此,对于特定的特征,例如X1,类c的似然密度被建模为

这里X1是具有类标签c的特征向量。
最后把所有的一起,Naive Bayes分类涉及两个类问题的步骤,类标签为0和1:
根据类标签将训练数据集划分为子组。示例:对于标签0和1的两类问题,属于类0的所有训练示例都是分开的,并且类1是分开的。
分别计算分离数据集中存在的每个要素的均值和标准差。示例:对于原始训练集中的特征X1,对于0级和1级,将有2组平均值和标准偏差。
对于每个测试示例Xtest,我们计算两个联合概率,即P(c = 0 / Xtest)和P(c = 1 / Xtest)。最后,Xtest被分配给两个联合概率的最大值。
现在在python中实现上面的步骤。将使用numpy,pandas和matplotlib库。要使用的数据集是“Social_network_ads.csv”。
加载数据集并查看前五行:
#reading dataset
Data=pd.read_csv('Social_Network_Ads.csv')
Data.head(10)
"""output
    User ID  Gender  Age  EstimatedSalary  Purchased
0  15624510    Male   19            19000          0
1  15810944    Male   35            20000          0
2  15668575  Female   26            43000          0
3  15603246  Female   27            57000          0
4  15804002    Male   19            76000          0
5  15728773    Male   27            58000          0
6  15598044  Female   27            84000          0
7  15694829  Female   32           150000          1
8  15600575    Male   25            33000          0
9  15727311  Female   35            65000          0
"""
将Age和EstimatedSalary作为独立功能,并将其作为依赖功能购买(类标签为0和1)。现在划分训练和测试集大小。将75%的原始数据作为训练数据,25%作为测试数据。
#training and testing set size
train_size=int(0.75*Data.shape[0])
test_size=int(0.25*Data.shape[0])
print("Training set size : "+ str(train_size))
print("Testing set size : "+str(test_size))
"""output
Training set size : 300
Testing set size : 100 """
随机播放数据集并提取所需的功能。
#Getting features from dataset
Data=Data.sample(frac=1)
X=Data.iloc[:,[2, 3]].values
y=Data.iloc[:,4].values
X=X.astype(float)
执行特征缩放也很有用,因为年龄和工资这两个特征的尺度完全不同。功能扩展类已经实现。
#feature scaling
from FeatureScaling import FeatureScaling
fs=FeatureScaling(X,y)
X=fs.fit_transform_X()
现在将数据拆分为训练和测试集。
#training set split
X_train=X[0:train_size,:]
y_train=y[0:train_size]
#testing set split
X_test=X[train_size:,:]
y_test=y[train_size:]
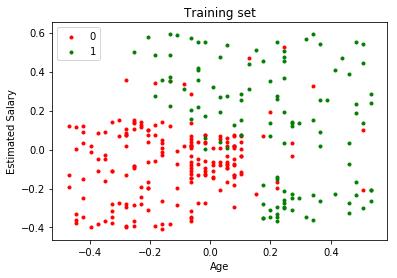
准备好了数据,然后继续使用Naive Bayes算法对测试数据进行分类。在此之前可以看到训练集。
#visualize the training set
from matplotlib.colors import ListedColormap
X_set, y_set = X_train, y_train
for i, j in enumerate(np.unique(y_set)):
    plt.scatter(X_set[y_set == j, 0], X_set[y_set == j, 1],
                c = ListedColormap(('red', 'green'))(i), label = j,marker='.')
plt.title('Training set')
plt.xlabel('Age')
plt.ylabel('Estimated Salary')
plt.legend()
plt.show()

目标是找到一个分隔红点和绿点的决策边界。那么实现每一步:
1.生成数据集函数将X_train和y_train作为参数,并根据类标签0和1拆分数据集。拆分数据存储在名为class_data_dic的字典中,该字典由0和1索引,即class_data_dic [0]获取所有输入培训具有标签0和class_data_dic [1]的示例获取具有标签1的所有输入训练示例。
def generate_data(class_data_dic,X_train,y_train):
            first_one=True
            first_zero=True
            for i in range(y_train.shape[0]):
                X_temp=X_train[i,:].reshape(X_train[i,:].shape[0],1)
                if y_train[i]==1:
                    if first_one==True:
                        class_data_dic[1]=X_temp
                        first_one=False
                    else:
                        class_data_dic[1]=
                        np.append(class_data_dic[1],X_temp,axis=1)
                elif y_train[i]==0:
                    if first_zero==True:
                        class_data_dic[0]=X_temp
                        first_zero=False
                    else:
                        class_data_dic[0]=
                        np.append(class_data_dic[0],X_temp,axis=1)
            return class_data_dic
2.计算每个单独分裂向量的均值和标准差。
mean_0=np.mean(class_data_dic[0],axis=0)
mean_1=np.mean(class_data_dic[1],axis=0)
std_0=np.std(class_data_dic[0],axis=0)
std_1=np.std(class_data_dic[1],axis=0)
还实现一些辅助函数
1.似然函数返回特定X的高斯分布向量
def likelyhood(x,mean,sigma):
                return np.exp(-(x-mean)**2/(2*sigma**2))*(1/(np.sqrt(2*np.pi)*sigma))
2.后验函数计算联合概率并返回产品。
def posterior(X,X_train_class,mean_,std_):
            product=np.prod(likelyhood(X,mean_,std_),axis=1)
            product=product*  (X_train_class.shape[0]/X_train.shape[0])
            return product
3.现在剩下的唯一步骤是采用每个测试示例并基于所有上述实现的函数预测类。如图所示进行矢量化。p_1表示X_test属于类1的联合概率,p_0表示X_test属于类0的联合概率。
p_1=posterior(X_test,class_data_dic[1],mean_1,std_1)   p_0=posterior(X_test,class_data_dic[0],mean_0,std_0)
y_pred=1*(p_1>p_0)
最后,y_pred包含测试集的预测类标签。现在评估y_pred和y_test,并将预测结果与实际结果进行比较。为此寻求Confusion矩阵的帮助,其中Confusion矩阵中的每个元素都是真阴性,假阴性,假阳性和真阳性。可以从这里阅读有关混淆矩阵的更多信息。
https://www.dataschool.io/simple-guide-to-confusion-matrix-terminology/
#getting the confusion matrix
tp=len([i for i in range(0,y_test.shape[0]) if y_test[i]==0 and y_pred[i]==0])
tn=len([i for i in range(0,y_test.shape[0]) if y_test[i]==0 and y_pred[i]==1])
fp=len([i for i in range(0,y_test.shape[0]) if y_test[i]==1 and y_pred[i]==0])
fn=len([i for i in range(0,y_test.shape[0]) if y_test[i]==1 and y_pred[i]==1])
confusion_matrix=np.array([[tp,tn],[fp,fn]])
print(confusion_matrix)
"""output
[[62  6]
 [ 8 24]]
"""
那么这表明了什么?混淆矩阵是用于评估分类模型的性能的度量。准确度不能仅仅是评估的度量标准,因为有时数据集可能会偏斜,在这种情况下,即使y_pred的所有元素都为0,该模型的准确性也有可能达到99%。因此,混淆矩阵提供了对模型行为的清晰理解。在100个测试示例中,62个示例在y_pred和y_test中都有类标签0,24个示例在y_pred和y_test中都有类标签1。因此,我们模型的整体精度将是(62 + 24)/ 100 = 86/100 = 0.86。另一方面,有6个例子,其中y_pred = 0和y_test = 1,即False Negative,在某些情况下是危险的,8个例子,其中y_pred = 1,y_test = 0,即False Positive。
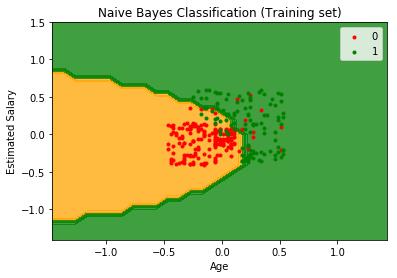
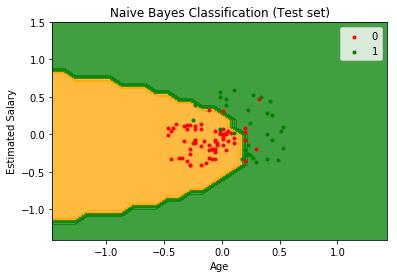
所以模型似乎很适合这个数据集。让可视化实际的决策边界,并理解朴素贝叶斯是一个优秀的非线性分类器。
训练和测试集的决策边界。
# Visualising the Training set results
from matplotlib.colors import ListedColormap
X_set, y_set = X_train, y_train
X1, X2 = np.meshgrid(np.arange(start = X_set[:, 0].min() - 1, stop = X_set[:, 0].max() + 1, step = 0.1),
                     np.arange(start = X_set[:, 1].min() - 1, stop = X_set[:, 1].max() + 1, step = 0.1))
plt.contourf(X1, X2, nb.predict(np.array([X1.ravel(), X2.ravel()]).T).reshape(X1.shape),
             alpha = 0.75, cmap = ListedColormap(('orange', 'green')))
plt.xlim(X1.min(), X1.max())
plt.ylim(X2.min(), X2.max())
for i, j in enumerate(np.unique(y_set)):
    plt.scatter(X_set[y_set == j, 0], X_set[y_set == j, 1],
                c = ListedColormap(('red', 'green'))(i), label = j,marker='.')
plt.title('Naive Bayes Classification our implementation(Training set)')
plt.xlabel('Age')
plt.ylabel('Estimated Salary')
plt.legend()
plt.show()

# Visualising the Test set results
from matplotlib.colors import ListedColormap
X_set, y_set = X_test, y_test
X1, X2 = np.meshgrid(np.arange(start = X_set[:, 0].min() - 1, stop = X_set[:, 0].max() + 1, step = 0.1),
                     np.arange(start = X_set[:, 1].min() - 1, stop = X_set[:, 1].max() + 1, step = 0.1))
plt.contourf(X1, X2, nb.predict(np.array([X1.ravel(), X2.ravel()]).T).reshape(X1.shape),
             alpha = 0.75, cmap = ListedColormap(('orange', 'green')))
plt.xlim(X1.min(), X1.max())
plt.ylim(X2.min(), X2.max())
for i, j in enumerate(np.unique(y_set)):
    plt.scatter(X_set[y_set == j, 0], X_set[y_set == j, 1],
                c = ListedColormap(('red', 'green'))(i), label = j,marker='.')
plt.title('Naive Bayes Classification our implementation(Test set)')
plt.xlabel('Age')
plt.ylabel('Estimated Salary')
plt.legend()
plt.show()
哇,这看起来很有趣,因为模型已经将测试集分类为完美的非线性决策边界。
在结束文章之前,使用sklearn库执行相同的操作。如果您正在学习它背后的数学并且需要更多的理解,那么实现该算法是完全可取的。但是,对于实际问题,始终建议使用现有库,因为它们提供了更优化的实现。
#lets do the same with sk learn and compare
# Fitting Naive Bayes to the Training set
from sklearn.naive_bayes import GaussianNB
classifier = GaussianNB()
classifier.fit(X_train, y_train)
# Predicting the Test set results
y_pred = classifier.predict(X_test)
from sklearn.metrics import confusion_matrix
cm=confusion_matrix(y_test,y_pred)
"""output
[[63 6
6 25]]"""
# Visualising the Training set results
from matplotlib.colors import ListedColormap
X_set, y_set = X_train, y_train
X1, X2 = np.meshgrid(np.arange(start = X_set[:, 0].min() - 1, stop = X_set[:, 0].max() + 1, step = 0.1),
                     np.arange(start = X_set[:, 1].min() - 1, stop = X_set[:, 1].max() + 1, step = 0.1))
plt.contourf(X1, X2, classifier.predict(np.array([X1.ravel(), X2.ravel()]).T).reshape(X1.shape),
             alpha = 0.75, cmap = ListedColormap(('orange', 'green')))
plt.xlim(X1.min(), X1.max())
plt.ylim(X2.min(), X2.max())
for i, j in enumerate(np.unique(y_set)):
    plt.scatter(X_set[y_set == j, 0], X_set[y_set == j, 1],
                c = ListedColormap(('red', 'green'))(i), label = j,marker='.')
plt.title('Naive Bayes Classification scikit-learn(Training set)')
plt.xlabel('Age')
plt.ylabel('Estimated Salary')
plt.legend()
plt.show()
# Visualising the Test set results
from matplotlib.colors import ListedColormap
X_set, y_set = X_test, y_test
X1, X2 = np.meshgrid(np.arange(start = X_set[:, 0].min() - 1, stop = X_set[:, 0].max() + 1, step = 0.1),
                     np.arange(start = X_set[:, 1].min() - 1, stop = X_set[:, 1].max() + 1, step = 0.1))
plt.contourf(X1, X2, classifier.predict(np.array([X1.ravel(), X2.ravel()]).T).reshape(X1.shape),
             alpha = 0.75, cmap = ListedColormap(('orange', 'green')))
plt.xlim(X1.min(), X1.max())
plt.ylim(X2.min(), X2.max())
for i, j in enumerate(np.unique(y_set)):
    plt.scatter(X_set[y_set == j, 0], X_set[y_set == j, 1],
                c = ListedColormap(('red', 'green'))(i), label = j,marker='.')
plt.title('Naive Bayes Classification scikit-learn (Test set)')
plt.xlabel('Age')
plt.ylabel('Estimated Salary')
plt.legend()
plt.show()


完整的实现代码可以在这里找到。
https://github.com/pavankalyan1997/Machine-learning-without-any-libraries/tree/master/5.Naive%20Bayes%20Classification

关于图书
《深度学习之TensorFlow:入门、原理与进阶实战》和《Python带我起飞——入门、进阶、商业实战》两本图书是代码医生团队精心编著的 AI入门与提高的精品图书。配套资源丰富:配套视频、QQ读者群、实例源码、 配套论坛:http://bbs.aianaconda.com 。更多请见:aianaconda.com
点击“阅读原文”配套图书资源
以上是关于从Scratch在Python中的朴素贝叶斯分类的主要内容,如果未能解决你的问题,请参考以下文章