R语言绘制密度提琴图
Posted 美格基因
tags:
篇首语:本文由小常识网(cha138.com)小编为大家整理,主要介绍了R语言绘制密度提琴图相关的知识,希望对你有一定的参考价值。

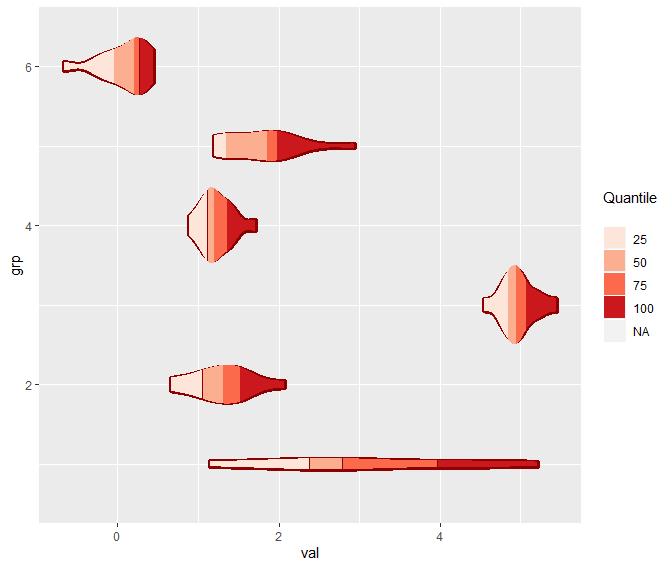
   library(ggplot2)


library(ggridges)


#详情 ?geom_density_ridges_gradient,这是文档中下方示例


ggplot(lincoln_weather, aes(x = `Mean Temperature [F]`, y = `Month`, fill = ..x..)) +


geom_density_ridges_gradient(scale = 3, rel_min_height = 0.01) +


scale_x_continuous(expand = c(0.01, 0)) +


scale_y_discrete(expand = c(0.01, 0)) +


scale_fill_gradientn(colours = terrain.colors(10)) +


labs(title = 'Temperatures in Lincoln NE in 2016') +


theme_ridges(font_size = 13, grid = TRUE) + theme(axis.title.y = element_blank())
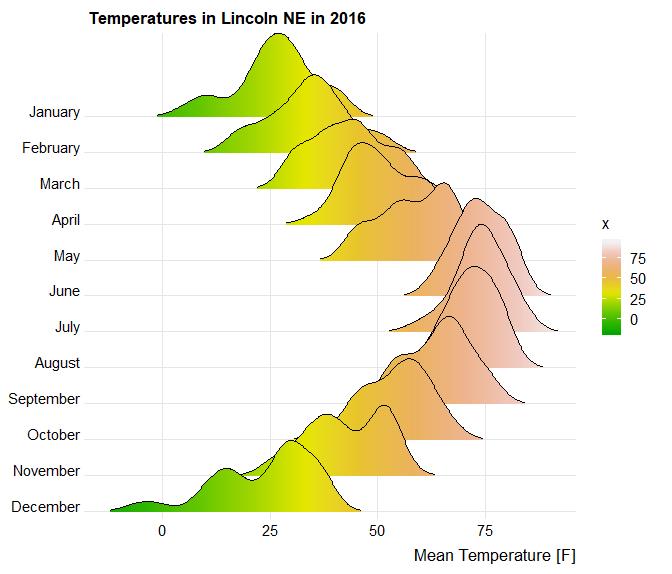
   #还是文档中的示例数据,简化一下方便展示


#“正方向”


ggplot(lincoln_weather, aes(x = `Mean Temperature [F]`, y = `Month`, fill = ..x..)) +


geom_density_ridges_gradient(scale = 0.5, rel_min_height = 0.01) +


scale_fill_gradientn(colours = terrain.colors(10))


#“反方向”


ggplot(lincoln_weather, aes(x = `Mean Temperature [F]`, y = `Month`, fill = ..x..)) +


geom_density_ridges_gradient(scale = -0.5, rel_min_height = 0.01) +


scale_fill_gradientn(colours = terrain.colors(10))
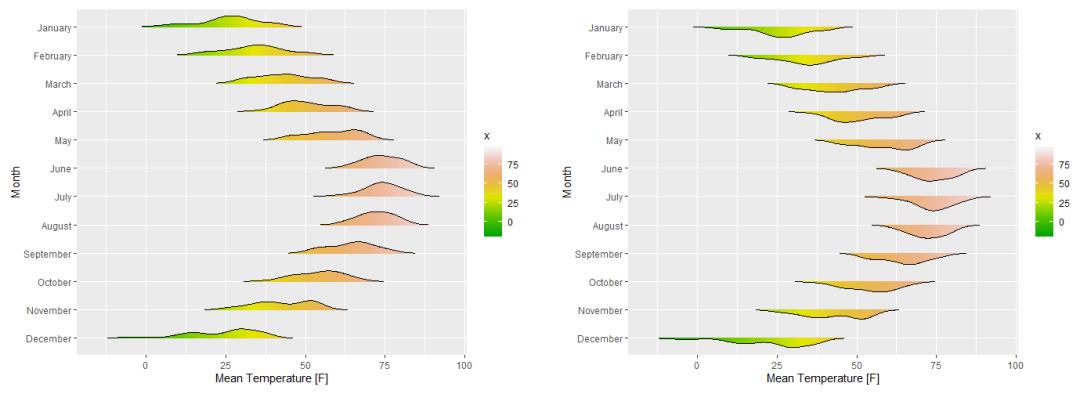
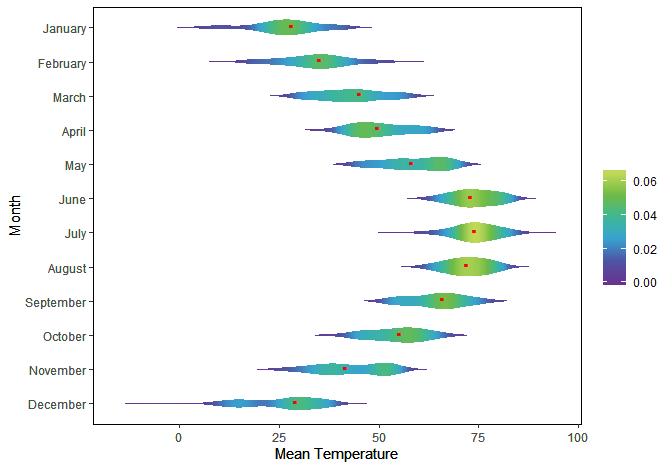
   #“密度提琴图”


library(ggplot2)


library(ggridges)


library(grid)


#计算中位数值


med <- aggregate(lincoln_weather$`Mean Temperature [F]`, by = list(lincoln_weather$`Month`), FUN = median)


#“正方向”


p1 <- ggplot(lincoln_weather, aes(x = `Mean Temperature [F]`, y = `Month`, fill = ..density..)) +


geom_density_ridges_gradient(scale = 0.3, gradient_lwd = NA, rel_min_height = NA,size = NA) +


scale_fill_gradientn(colours = colorRampPalette(c('#663490', '#5054A3', '#37A3D2', '#3EB897', '#6EBB46', '#C0D857'))(30)) +


theme(panel.grid = element_blank(), panel.background = element_rect(fill = 'transparent', color = 'black'), plot.background = element_blank()) +


labs(x = 'Mean Temperature', y = 'Month', fill = '')


#“反方向”


p2 <- ggplot(lincoln_weather, aes(x = `Mean Temperature [F]`, y = `Month`, fill = ..density..)) +


geom_density_ridges_gradient(scale = -0.3, gradient_lwd = NA, rel_min_height = NA,size = NA) +


scale_fill_gradientn(colours = colorRampPalette(c('#663490', '#5054A3', '#37A3D2', '#3EB897', '#6EBB46', '#C0D857'))(30)) +


theme(panel.grid = element_blank(), panel.background = element_blank(), plot.background = element_blank()) +


labs(x = 'Mean Temperature', y = 'Month', fill = '') +


#把中位数以红点的形式添在图中


annotate('text', label = '.', x = med$x, y = med$Group.1, size = 10, colour = 'red', vjust = -0.02)


grid.newpage()


print(p1, vp = viewport(x = 0.5, y = 0.5))


print(p2, vp = viewport(x = 0.5, y = 0.5))
 。
。


致尊敬的您:
美格基因专注微生物组学领域,不断拓展基因组学在环境、生态、农业和医学健康领域的应用,持续开发国际领先的产品和服务,致力于成为全球领先的微生物组学产品和服务提供者。
公司已开拓的业务领域有:16S/18S/ITS测序 ; 16S全长测序;GeoChip、宏基因组、宏转录组、宏病毒组测序;单菌框架图、完成图。
目前已为清华大学、中国科学院、中山大学、浙江大学、美国佐治亚理工学院、香港科技大学等国内外众多科研学术机构提供了全方位的科研服务,在行业内具备显著影响力。
如您有任何需求和疑问,欢迎随时咨询,美格基因竭诚为您服务!
以上是关于R语言绘制密度提琴图的主要内容,如果未能解决你的问题,请参考以下文章
R语言使用beanplot包绘制豆荚图实战:与箱图小提琴图对比绘制不对称的豆荚图
R语言使用ggplot2包使用geom_violin函数绘制小提琴图(水平小提琴图垂直小提琴图边缘不截断小提琴图)实战
R语言使用ggplot2包的快速可视化函数qplot绘制分组小提琴图实战
R语言使用ggplot2包geom_jitter()函数绘制分组(strip plot,一维散点图)带状图(添加箱图带缺口的小提琴图小提琴图)实战