R语言中text的设置
Posted 生信小猪
tags:
篇首语:本文由小常识网(cha138.com)小编为大家整理,主要介绍了R语言中text的设置相关的知识,希望对你有一定的参考价值。
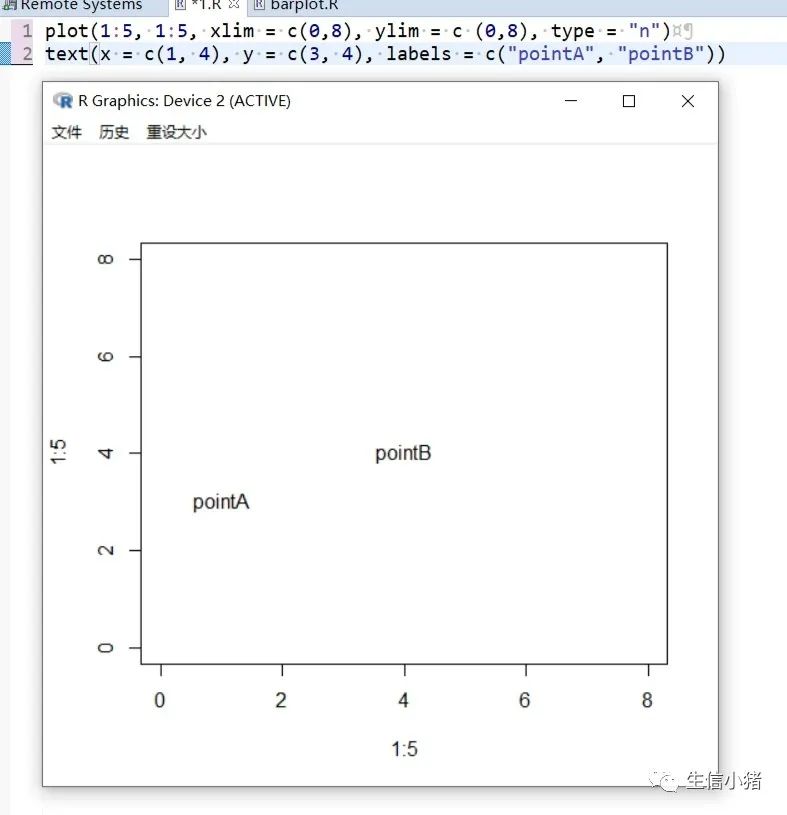
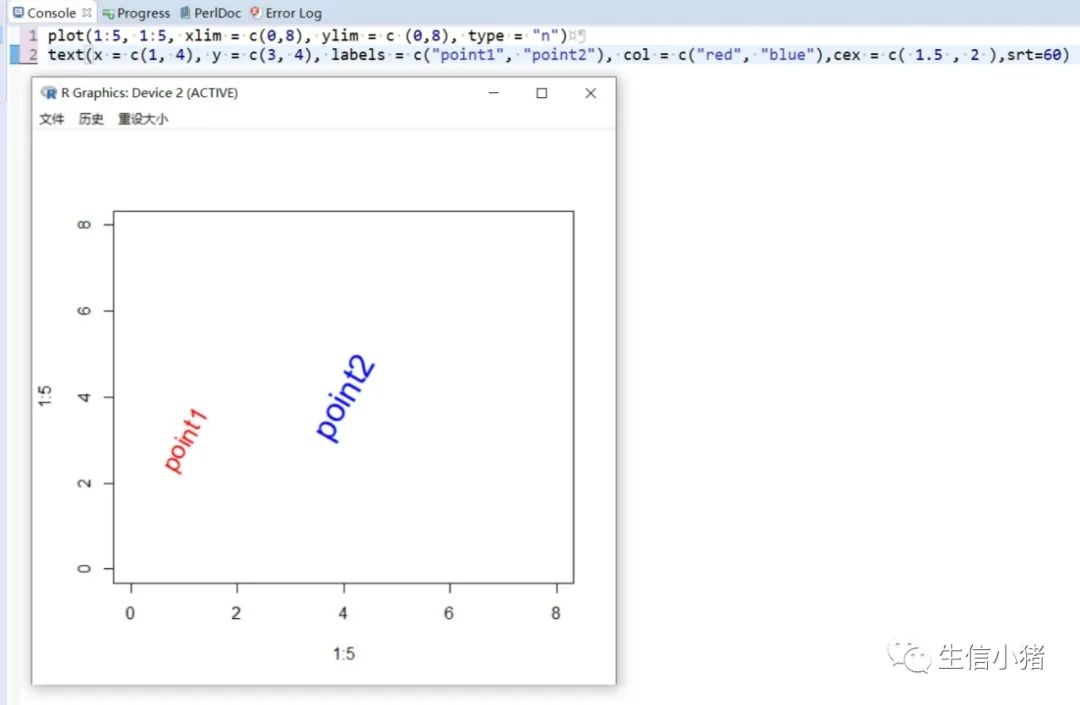
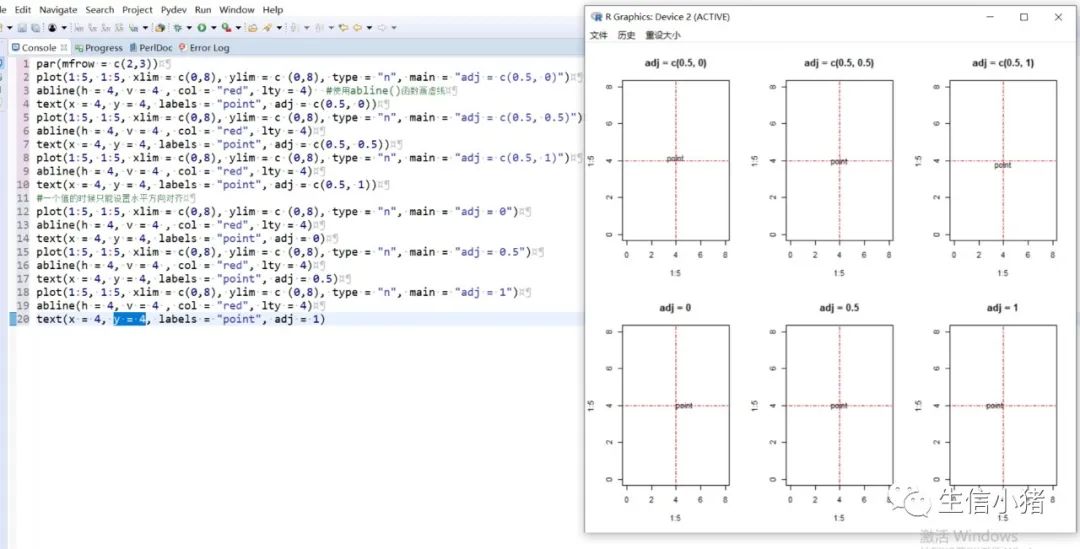
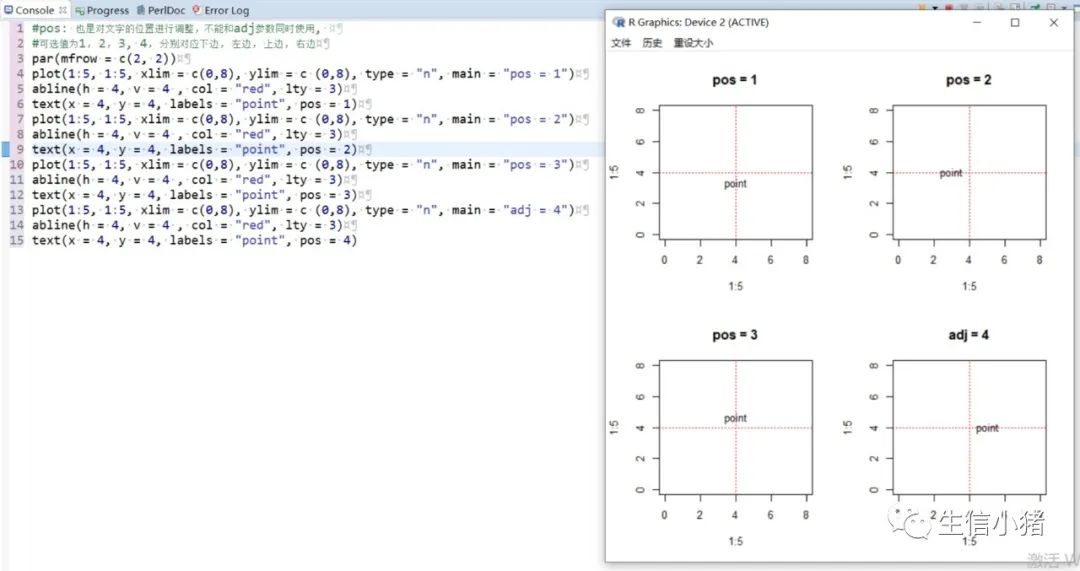
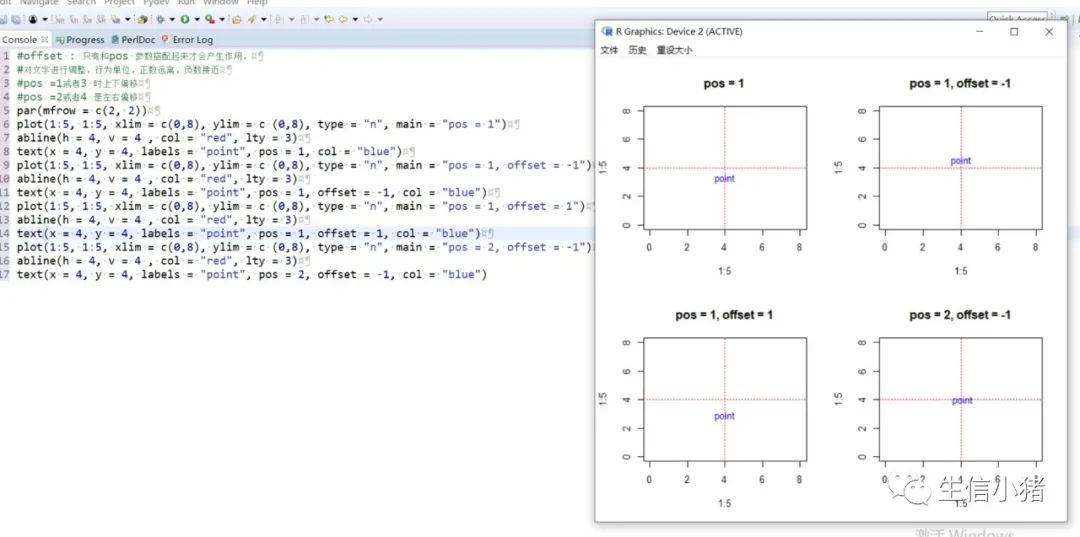
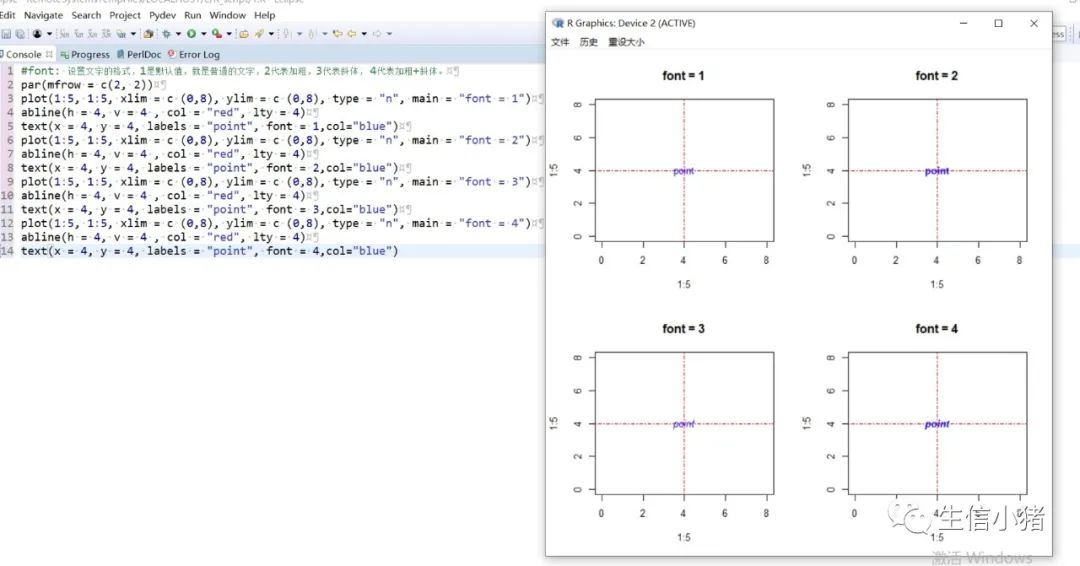
#text方法用来在一张图上添加文字,只需要指定对应的x和y坐标,#以及需要添加的文字内容就可以plot(1:5, 1:5, xlim = c(0,8), ylim = c (0,8), type = "n") #type = "n"表示不在图上绘制散点图text(x = 4, y = 4, labels = "point")#向量,设置多个text文字plot(1:5, 1:5, xlim = c(0,8), ylim = c (0,8), type = "n")text(x = c(1, 4), y = c(3, 4), labels = c("pointA", "pointB"))#col : 设置文字的颜色;cex : 设置文字的大小;#srt : 对文字进行旋转plot(1:5, 1:5, xlim = c(0,8), ylim = c (0,8), type = "n")text(x = c(1, 4), y = c(3, 4), labels = c("point1", "point2"), col = c("red", "blue"),cex = c( 1.5 , 2 ),srt=60)#adj : 调整文字的对齐位置,#两个值时,第一个调整的是水平位置对齐,第二个调整的是垂直位置对齐,#可选范围为[0, 1]par(mfrow = c(2,3))plot(1:5, 1:5, xlim = c(0,8), ylim = c (0,8), type = "n", main = "adj = c(0.5, 0)")abline(h = 4, v = 4 , col = "red", lty = 4) #使用abline()函数画虚线text(x = 4, y = 4, labels = "point", adj = c(0.5, 0))plot(1:5, 1:5, xlim = c(0,8), ylim = c (0,8), type = "n", main = "adj = c(0.5, 0.5)")abline(h = 4, v = 4 , col = "red", lty = 4)text(x = 4, y = 4, labels = "point", adj = c(0.5, 0.5))plot(1:5, 1:5, xlim = c(0,8), ylim = c (0,8), type = "n", main = "adj = c(0.5, 1)")abline(h = 4, v = 4 , col = "red", lty = 4)text(x = 4, y = 4, labels = "point", adj = c(0.5, 1))#一个值的时候只能设置水平方向对齐plot(1:5, 1:5, xlim = c(0,8), ylim = c (0,8), type = "n", main = "adj = 0")abline(h = 4, v = 4 , col = "red", lty = 4)text(x = 4, y = 4, labels = "point", adj = 0)plot(1:5, 1:5, xlim = c(0,8), ylim = c (0,8), type = "n", main = "adj = 0.5")abline(h = 4, v = 4 , col = "red", lty = 4)text(x = 4, y = 4, labels = "point", adj = 0.5)plot(1:5, 1:5, xlim = c(0,8), ylim = c (0,8), type = "n", main = "adj = 1")abline(h = 4, v = 4 , col = "red", lty = 4)text(x = 4, y = 4, labels = "point", adj = 1)#pos: 也是对文字的位置进行调整,不能和adj参数同时使用,#可选值为1, 2, 3, 4, 分别对应下边, 左边, 上边, 右边par(mfrow = c(2, 2))plot(1:5, 1:5, xlim = c(0,8), ylim = c (0,8), type = "n", main = "pos = 1")abline(h = 4, v = 4 , col = "red", lty = 3)text(x = 4, y = 4, labels = "point", pos = 1)plot(1:5, 1:5, xlim = c(0,8), ylim = c (0,8), type = "n", main = "pos = 2")abline(h = 4, v = 4 , col = "red", lty = 3)text(x = 4, y = 4, labels = "point", pos = 2)plot(1:5, 1:5, xlim = c(0,8), ylim = c (0,8), type = "n", main = "pos = 3")abline(h = 4, v = 4 , col = "red", lty = 3)text(x = 4, y = 4, labels = "point", pos = 3)plot(1:5, 1:5, xlim = c(0,8), ylim = c (0,8), type = "n", main = "adj = 4")abline(h = 4, v = 4 , col = "red", lty = 3)text(x = 4, y = 4, labels = "point", pos = 4)#offset : 只有和pos 参数搭配起来才会产生作用,#对文字进行调整,行为单位,正数远离,负数接近#pos =1或者3 时上下偏移#pos =2或者4 是左右偏移par(mfrow = c(2, 2))plot(1:5, 1:5, xlim = c(0,8), ylim = c (0,8), type = "n", main = "pos = 1")abline(h = 4, v = 4 , col = "red", lty = 3)text(x = 4, y = 4, labels = "point", pos = 1, col = "blue")plot(1:5, 1:5, xlim = c(0,8), ylim = c (0,8), type = "n", main = "pos = 1, offset = -1")abline(h = 4, v = 4 , col = "red", lty = 3)text(x = 4, y = 4, labels = "point", pos = 1, offset = -1, col = "blue")plot(1:5, 1:5, xlim = c(0,8), ylim = c (0,8), type = "n", main = "pos = 1, offset = 1")abline(h = 4, v = 4 , col = "red", lty = 3)text(x = 4, y = 4, labels = "point", pos = 1, offset = 1, col = "blue")plot(1:5, 1:5, xlim = c(0,8), ylim = c (0,8), type = "n", main = "pos = 2, offset = -1")abline(h = 4, v = 4 , col = "red", lty = 3)text(x = 4, y = 4, labels = "point", pos = 2, offset = -1, col = "blue")#font: 设置文字的格式,1是默认值,就是普通的文字,2代表加粗,3代表斜体, 4代表加粗+斜体。par(mfrow = c(2, 2))plot(1:5, 1:5, xlim = c (0,8), ylim = c (0,8), type = "n", main = "font = 1")abline(h = 4, v = 4 , col = "red", lty = 4)text(x = 4, y = 4, labels = "point", font = 1,col="blue")plot(1:5, 1:5, xlim = c (0,8), ylim = c (0,8), type = "n", main = "font = 2")abline(h = 4, v = 4 , col = "red", lty = 4)text(x = 4, y = 4, labels = "point", font = 2,col="blue")plot(1:5, 1:5, xlim = c (0,8), ylim = c (0,8), type = "n", main = "font = 3")abline(h = 4, v = 4 , col = "red", lty = 4)text(x = 4, y = 4, labels = "point", font = 3,col="blue")plot(1:5, 1:5, xlim = c (0,8), ylim = c (0,8), type = "n", main = "font = 4")abline(h = 4, v = 4 , col = "red", lty = 4)text(x = 4, y = 4, labels = "point", font = 4,col="blue")
require(RColorBrewer)par(mfrow=c(2,2),mar=c(5,4,4,4)+0.1)barplot(VADeaths,main="beside = F,default",beside = F,width = 1, col = brewer.pal(8, "Set2"))legend("right",legend = rownames(VADeaths),fill = brewer.pal(8, "Set2"),bty='n',xpd=T,inset = -0.4,cex = 1.2)barplot(VADeaths,main="beside = TRUE,default",beside = TRUE,width = 1, col = brewer.pal(8, "Set2"),border = brewer.pal(8, "Set2"))legend("right",legend = rownames(VADeaths),fill = brewer.pal(8, "Set2"), border = brewer.pal(8, "Set2"),bty='n',xpd=T,inset = -0.4,cex = 1.2)p1<-barplot(VADeaths,main="beside = F,default",axisnames = F,beside = F,width = 1, col = brewer.pal(8, "Set2"))legend("right",legend = rownames(VADeaths),fill = brewer.pal(8, "Set2"),bty='n',xpd=T,inset = -0.4,cex = 1.2)axis(side = 1,at=p1,labels =F )text(x=p1, y=-5, labels = colnames(VADeaths),cex=1, xpd=TRUE, srt=45,adj=c(1,1))box(bty='l')p2<-barplot(VADeaths,main="beside = TRUE,default",axisnames = F,beside = TRUE,width = 1, col = brewer.pal(8, "Set2"),border = brewer.pal(8, "Set2"))legend("right",legend = rownames(VADeaths),fill = brewer.pal(8, "Set2"), border = brewer.pal(8, "Set2"),bty='n',xpd=T,inset = -0.4,cex = 1.2)axis(side = 1,at=p2[3,],labels =F )text(x=p2[3,], y=-3, labels = colnames(VADeaths),cex=1, xpd=TRUE, srt=45,adj=c(1,1))box(bty='l') #bty='l',绘制边框的类型
#读入数据,处理数据require("RColorBrewer")setwd("H:/shengxinwenjian/R 基础+绘图资料")x<-read.table("new_tax_abundance.txt",sep=" ",header = TRUE,check.names=FALSE,comment.char="")mycol<-c(brewer.pal(9, "Set1"),brewer.pal(12, "Paired"),brewer.pal(12, "Set3"))x<-x[order(x[,2],decreasing =T),] #[order(x[,2],将文件 new_tax_abundance.txt按第二例排个序a<-x[,2:ncol(x)] #把第一列删掉,然后将剩余的列赋给变量arownames(a)<-x[,1] #将a的列名设为new_tax_abundance.txt文件的第一列t<-as.matrix(a)#修改参数,调整图片dev.off() #关闭绘图设备,初始化parpar(mar=c(18, 5, 4, 1.1))p<-barplot(t,main="abundance",xaxs="i",ylim=c(0,1),axisnames=F,border = NA ,space=0,col=mycol[1:nrow(t)],ylab="Relative abundance ") #想要每一列中间隔,可以调整space的值axis(side=1,p,labels=F)text(x=p-0.25, y=-0.04, labels=colnames(t),cex=1, xpd=TRUE, srt=45,adj=1)box(bty="l")legend("bottom",ncol=3,xpd=T,bty = "n",rownames(t),fill=mycol[1:nrow(t)], border = NA,inset=c(0,-1),cex=1)
下面是截取了new_tax_abundance.txt文件的一部分
#OTU ID 2my101 2my102 2my201 2my202 2my301 2my302 2w101 2w102 2w201 2w202 2w301 2w302 2yc101 2yc102 2yc201 2yc202 2yc301 2yc302 1my101 1my102 1my201 1my202 1my301 1my302 1w101 1w102 1w201 1w202 1w301 1w302 1yc101 1yc102 1yc201 1yc202 1yc301 1yc3020319-7L14 0 5.55E-05 6.40E-05 5.86E-05 0 9.79E-05 0.000112328 0 7.32E-05 0 4.92E-05 0 0.005495495 0.007561016 0.013159827 0.015386575 0.004614111 0.007686685 0.000112943 0.00025355 0.000105474 0.000323402 0 0.000431389 0 0 0 0 0 0 0.002864939 0.006720517 0.002772643 0.007471714 0.002630074 0.008217302Acidimicrobiia 0.045025218 0.038095767 0.043830477 0.036355467 0.056052325 0.056198468 0.023195732 0.028347517 0.045471187 0.029587043 0.024201879 0.022364576 0.066396396 0.076416301 0.105513615 0.119398803 0.070789131 0.078816206 0.037346585 0.035395538 0.037443308 0.047944375 0.034760202 0.040629044 0.045187677 0.028009696 0.039856631 0.034286089 0.038139535 0.02455516 0.067735334 0.06907916 0.057301294 0.068739771 0.050543168 0.078216541Acidobacteriia 0.010197157 0.009695086 0.010914983 0.014143664 0.00958218 0.011034179 0.023139568 0.020326945 0.021307754 0.02229545 0.029957204 0.015509103 0.004459459 0.003280147 0.005463678 0.004356133 0.004180305 0.002481005 0.0084331 0.006845842 0.008332454 0.007236124 0.007730332 0.007804228 0.020713767 0.014678158 0.025878136 0.016913596 0.03448062 0.020937129 0.004911323 0.002584814 0.003612838 0.003131004 0.00320183 0.00334779Actinobacteria 0.003979826 0.002904825 0.003986527 0.002344254 0.004482356 0.002642331 0.01067116 0.006796057 0.050596764 0.006520367 0.017069211 0.006574511 0.288963964 0.118224273 0.090444438 0.039893007 0.251685925 0.04337328 0.065017694 0.038286004 0.039500053 0.041799733 0.062000421 0.03941331 0.02830002 0.0067331 0.024802867 0.007211223 0.027906977 0.003973903 0.215552524 0.091954766 0.296000672 0.130719419 0.324413951 0.107814045Alphaproteobacteria 0.102063274 0.111882031 0.11876439 0.110199457 0.181169529 0.108800431 0.160853693 0.148411192 0.208098411 0.171212227 0.175807959 0.155933918 0.147117117 0.149719242 0.176247687 0.128951726 0.169499546 0.095119952 0.145922747 0.074137931 0.151249868 0.08707604 0.158918805 0.090042747 0.182795699 0.141260436 0.20516129 0.136357677 0.23627907 0.18173191 0.184924966 0.102487884 0.202655016 0.12801537 0.214636935 0.135433311Anaerolineae 0.04350298 0.027475577 0.034322504 0.027447303 0.026688316 0.035157684 0.030103903 0.033306802 0.058431574 0.044520788 0.030399921 0.026410429 0.007747748 0.00959026 0.007784273 0.004992995 0.018338131 0.007664533 0.044386718 0.031693712 0.031220335 0.049601811 0.028817838 0.05015883 0.028827759 0.04248586 0.032616487 0.025567064 0.033054264 0.039323843 0.016234652 0.008594507 0.013107041 0.012595175 0.01406518 0.010347714Bacteroidia 0.003888125 0.014413114 0.010403343 0.013889703 0.027900382 0.009615149 0.007469812 0.004714382 0.007908033 0.004977915 0.005115844 0.004495392 0.004684685 0.005114805 0.00305496 0.002241753 0.004771858 0.001772146 0.013703787 0.006237323 0.019196287 0.007478676 0.016039125 0.009569003 0.007190448 0.007339079 0.007598566 0.006358988 0.011658915 0.005278766 0.007844475 0.004781906 0.005461267 0.004625347 0.00434534 0.005021685Blastocatellia_(Subgroup_4) 0.128069693 0.113325192 0.144772747 0.1216863 0.07919592 0.112617131 0.147486661 0.135186432 0.104708208 0.147234102 0.143391215 0.106091256 0.026846847 0.013676544 0.007431777 0.002445548 0.035059352 0.015484128 0.060725849 0.060091278 0.070034806 0.047782674 0.080774085 0.046393976 0.085097962 0.113385403 0.095268817 0.111118395 0.077457364 0.139383155 0.046043656 0.032180937 0.028482608 0.024051804 0.020125786 0.016054173Chloroflexia 0.002200825 0.001313647 0.002622154 0.000586063 0.002904384 0.002006214 0.0042123 0.002571481 0.013399722 0.003715908 0.006394805 0.001517195 0.024009009 0.012675821 0.022001586 0.011463508 0.021019837 0.00593669 0.010051954 0.005983773 0.005748339 0.010389295 0.006731174 0.010157261 0.005805132 0.003231888 0.006236559 0.003408942 0.00979845 0.002372479 0.034174625 0.013311793 0.035792304 0.019284139 0.032246998 0.010043369Dehalococcoidia 0.008821641 0.011730314 0.009827748 0.010568677 0.008072815 0.013529714 0.004942432 0.005755219 0.004905909 0.008132931 0.004574745 0.006743088 0.003423423 0.007171846 0.005874923 0.008916062 0.003628189 0.009436679 0.004141254 0.006947262 0.003744331 0.008448882 0.002892301 0.008157183 0.004881588 0.004847832 0.004229391 0.005965648 0.004403101 0.004448399 0.003478854 0.008142165 0.001428331 0.006475486 0.00217267 0.006695579Deltaproteobacteria 0.076148556 0.096599319 0.081308092 0.105393737 0.067464038 0.089252073 0.075877562 0.070593277 0.05513656 0.06548412 0.060307934 0.053438975 0.024054054 0.02162673 0.012043592 0.009680296 0.023267737 0.016082228 0.06189293 0.060395538 0.06228246 0.05457412 0.054164914 0.054198204 0.068804011 0.080325882 0.078637993 0.094073686 0.058108527 0.061032028 0.034856753 0.026171244 0.032431524 0.023055575 0.025728988 0.021760633Gammaproteobacteria 0.090215497 0.103204559 0.108062591 0.110004102 0.128661925 0.088126636 0.11305813 0.094899896 0.083180786 0.081820094 0.102759605 0.112384806 0.03027027 0.051148051 0.03959698 0.04567571 0.034428363 0.04445872 0.10590317 0.134229209 0.122508174 0.12256943 0.105910812 0.126357896 0.111550894 0.100457851 0.101362007 0.096564835 0.122852713 0.09970344 0.048499318 0.046849758 0.04142161 0.040276098 0.033047456 0.050901621Gemmatimonadetes 0.059000459 0.063277087 0.051718257 0.053429448 0.051775791 0.055024099 0.030721707 0.036000735 0.024236655 0.032111057 0.031236165 0.086480108 0.028648649 0.060932896 0.098786828 0.120443256 0.0442087 0.178477283 0.052857466 0.08301217 0.061966037 0.074948458 0.053901977 0.087297541 0.022099083 0.03433881 0.022437276 0.050413006 0.026852713 0.03594306 0.025511596 0.087883683 0.021004873 0.073080481 0.014179531 0.108346648Gitt-GS-136 0.03565337 0.033562759 0.037371024 0.037488523 0.03069042 0.038778656 0.018927268 0.029143452 0.015742842 0.026922807 0.016577303 0.027646662 0.039009009 0.085700784 0.099756191 0.127397784 0.045470679 0.115100902 0.008056622 0.01627789 0.00680308 0.026438129 0.007519983 0.023922507 0.016755723 0.027336386 0.013405018 0.029566015 0.011968992 0.034519573 0.018758527 0.062875606 0.019324483 0.056927346 0.010748999 0.085977326Holophagae 0.012948189 0.021462404 0.01272704 0.020746645 0.015985547 0.014312627 0.020387532 0.02026572 0.00929926 0.020963332 0.017757883 0.030062935 0.004144144 0.002863179 0.006756161 0.011438033 0.003312695 0.00569302 0.006964837 0.010243408 0.010389199 0.008933986 0.007993269 0.01031413 0.014644765 0.029423647
以上是关于R语言中text的设置的主要内容,如果未能解决你的问题,请参考以下文章