R语言可视化:折线图绘制
Posted bioinfomics
tags:
篇首语:本文由小常识网(cha138.com)小编为大家整理,主要介绍了R语言可视化:折线图绘制相关的知识,希望对你有一定的参考价值。


02.折线图绘制
清除当前环境中的变量
rm(list=ls())
设置工作目录
setwd("C:/Users/Dell/Desktop/R_Plots/02lineplot/")
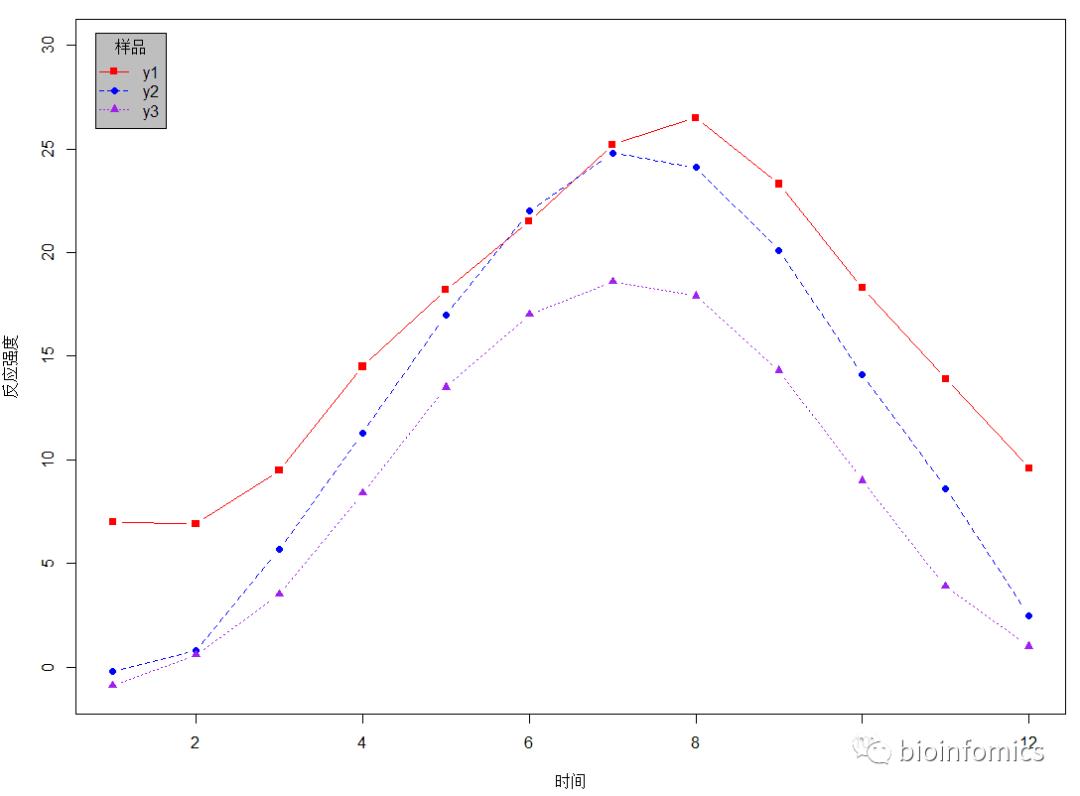
base plot函数绘制普通折线图
# 读取示例数据
data <- read.table("demo1_lineplot.txt", header = T, check.names = F)
# 查看数据
head(data)
## x y1 y2 y3
## 1 1 7.0 -0.2 -0.9
## 2 2 6.9 0.8 0.6
## 3 3 9.5 5.7 3.5
## 4 4 14.5 11.3 8.4
## 5 5 18.2 17.0 13.5
## 6 6 21.5 22.0 17.0

dim(data)
## [1] 12 4

attach(data)
plot(x, y1, type = "b", pch = 15, lty = 1, col = "red", xlab = "时间", ylab = "反应强度", ylim = c(-1,30))
lines(x, y2, type = "b", pch = 16, lty = 2, col = "blue")
lines(x, y3, type = "b", pch = 17, lty = 3, col = "purple")
legend("topleft", inset = 0.02, title = "样品", c("y1","y2","y3"),
       lty = c(1,2,3), pch = c(15,16,17), col = c("red","blue","purple"),
       bg = "gray")
detach(data)

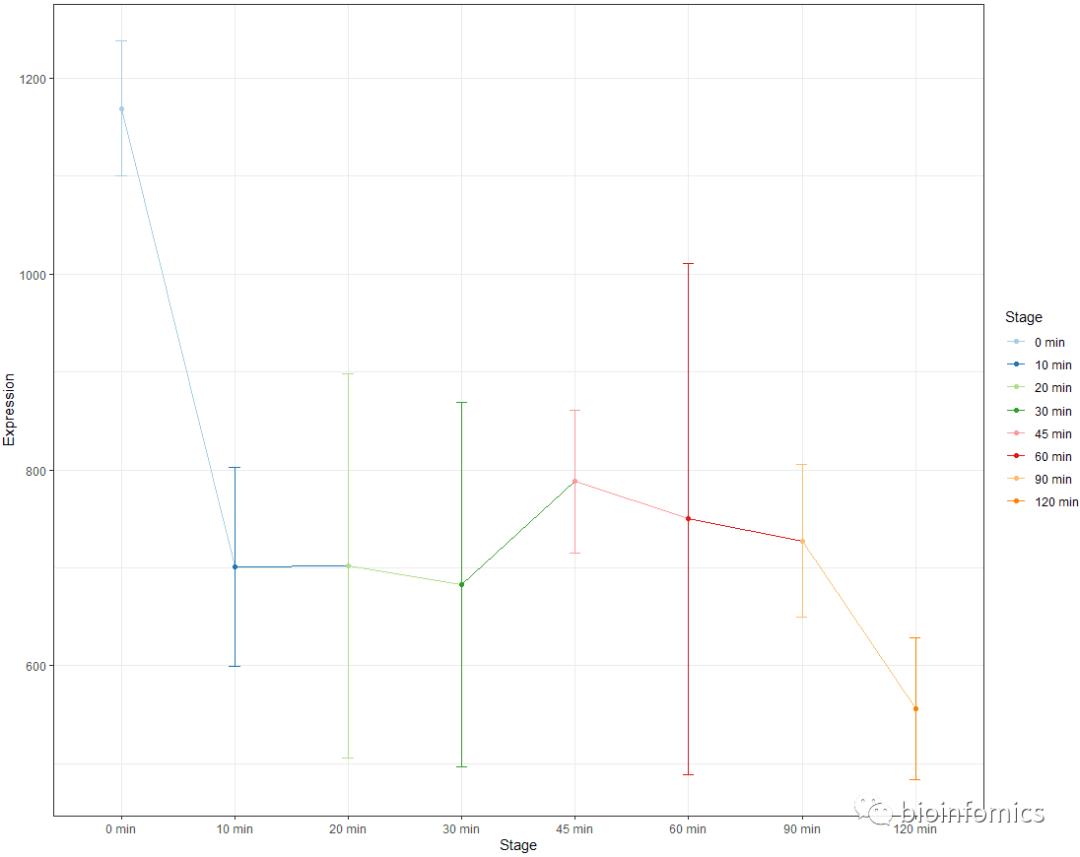
ggplot2包绘制带误差棒的折线图
library(ggplot2)
# 读取示例数据
data2 <- read.table("demo2_lineplot.txt", header = T, row.names = 3, sep="	", check.names = F)
data2$Stage <- factor(data2$Stage,levels = c("0 min","10 min","20 min","30 min","45 min","60 min","90 min","120 min"))
# 查看数据
head(data2)
## Stage GeneSymbol Expression Log10(Expression)
## 0min_1 0 min EGT2 1207.380 3.081844
## 0min_2 0 min EGT2 1209.970 3.082775
## 0min_3 0 min EGT2 1089.770 3.037335
## 10min_1 10 min EGT2 801.201 2.903741
## 10min_2 10 min EGT2 704.513 2.847889
## 10min_3 10 min EGT2 597.385 2.776254

#+++++++++++++++++++++++++
# Function to calculate the mean and the standard deviation
# for each group
#+++++++++++++++++++++++++
# data : a data frame
# varname : the name of a column containing the variable
#to be summariezed
# groupnames : vector of column names to be used as
# grouping variables
# 定义函数计算平均值和标准差
data_summary <- function(data, varname, groupnames){
  require(plyr)
  summary_func <- function(x, col){
    c(mean = mean(x[[col]], na.rm=TRUE),
      sd = sd(x[[col]], na.rm=TRUE))
  }
  data_sum <- ddply(data, groupnames, .fun=summary_func, varname)
  data_sum <- rename(data_sum, c("mean" = varname))
  return(data_sum)
}

data2 <- data_summary(data2, varname="Expression",
                      groupnames=c("Stage"))
head(data2)
## Stage Expression sd
## 1 0 min 1169.0400 68.66205
## 2 10 min 701.0330 101.95255
## 3 20 min 701.8853 196.06879
## 4 30 min 682.8983 186.25895
## 5 45 min 788.3107 72.94692
## 6 60 min 749.8397 261.03729

# Standard deviation of the mean
ggplot(data2, aes(x=Stage, y=Expression, group=1, color=Stage)) +
      geom_errorbar(aes(ymin=Expression-sd, ymax=Expression+sd), width=.1) +
      geom_line() + geom_point()+
      scale_color_brewer(palette="Paired")+theme_bw()

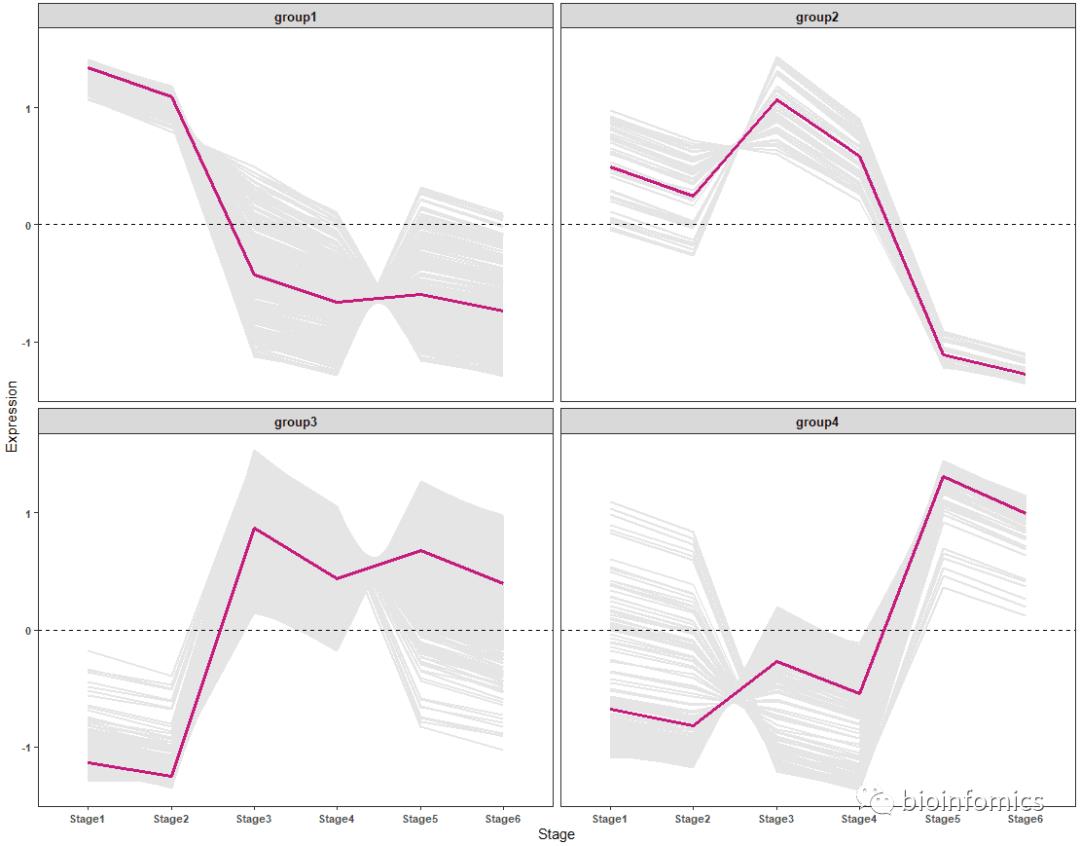
ggplot2包绘制聚类趋势折线图
# 读取示例数据
data3 <- read.table("demo3_lineplot.txt",header = T,check.names = F)
# 查看数据
head(data3)
## Gene Stage1 Stage2 Stage3 Stage4 Stage5 Stage6
## 1 Gene01 1.155864 0.9021231 -1.085794 -1.265632 0.2614499 0.03198916
## 2 Gene02 1.145877 0.8973008 -1.095785 -1.266790 0.2721922 0.04720437
## 3 Gene03 1.125560 0.8994570 -1.124195 -1.255849 0.2777603 0.07726622
## 4 Gene04 1.114566 0.8681610 -1.115066 -1.283721 0.3224320 0.09362759
## 5 Gene05 1.129178 0.8700930 -1.097511 -1.288186 0.3142035 0.07222275
## 6 Gene06 1.138877 0.8809866 -1.092992 -1.281036 0.2962881 0.05787733
## Group
## 1 group1
## 2 group1
## 3 group1
## 4 group1
## 5 group1
## 6 group1

library(reshape2)
# 将宽数据格式转换为长数据格式
data3 = melt(data3)
## Using Gene, Group as id variables

head(data3)
## Gene Group variable value
## 1 Gene01 group1 Stage1 1.155864
## 2 Gene02 group1 Stage1 1.145877
## 3 Gene03 group1 Stage1 1.125560
## 4 Gene04 group1 Stage1 1.114566
## 5 Gene05 group1 Stage1 1.129178
## 6 Gene06 group1 Stage1 1.138877

names(data3) <- c("Gene","Group","Stage","Expression")

ggplot(data3,aes(x=Stage, y=Expression, group=Gene)) + geom_line(color="gray90",size=0.8) +
      geom_hline(yintercept =0,linetype=2) +
      stat_summary(aes(group=1),fun.y=mean, geom="line", size=1.2, color="#c51b7d") +
      facet_wrap(.~Group) + theme_bw() +
      theme(panel.grid.major = element_blank(), panel.grid.minor = element_blank(),
            axis.text = element_text(size=8, face = "bold"),
            strip.text = element_text(size = 10, face = "bold"))

sessionInfo()
## R version 3.6.0 (2019-04-26)
## Platform: x86_64-w64-mingw32/x64 (64-bit)
## Running under: Windows 10 x64 (build 18363)
##
## Matrix products: default
##
## locale:
## [1] LC_COLLATE=Chinese (Simplified)_China.936
## [2] LC_CTYPE=Chinese (Simplified)_China.936
## [3] LC_MONETARY=Chinese (Simplified)_China.936
## [4] LC_NUMERIC=C
## [5] LC_TIME=Chinese (Simplified)_China.936
##
## attached base packages:
## [1] stats graphics grDevices utils datasets methods base
##
## other attached packages:
## [1] reshape2_1.4.3 plyr_1.8.4 ggplot2_3.2.0
##
## loaded via a namespace (and not attached):
## [1] Rcpp_1.0.1 knitr_1.23 magrittr_1.5
## [4] tidyselect_0.2.5 munsell_0.5.0 colorspace_1.4-1
## [7] R6_2.4.0 rlang_0.4.0 stringr_1.4.0
## [10] dplyr_0.8.3 tools_3.6.0 grid_3.6.0
## [13] gtable_0.3.0 xfun_0.8 withr_2.1.2
## [16] htmltools_0.3.6 yaml_2.2.0 lazyeval_0.2.2
## [19] digest_0.6.20 assertthat_0.2.1 tibble_2.1.3
## [22] crayon_1.3.4 RColorBrewer_1.1-2 purrr_0.3.2
## [25] glue_1.3.1 evaluate_0.14 rmarkdown_1.13
## [28] labeling_0.3 stringi_1.4.3 compiler_3.6.0
## [31] pillar_1.4.2 scales_1.0.0 pkgconfig_2.0.2
END


以上是关于R语言可视化:折线图绘制的主要内容,如果未能解决你的问题,请参考以下文章