R语言进阶之Lattice绘图
Posted 生信与临床
tags:
篇首语:本文由小常识网(cha138.com)小编为大家整理,主要介绍了R语言进阶之Lattice绘图相关的知识,希望对你有一定的参考价值。
第一部分:前言
由Deepayan Sarkar编写的“lattice”包是在R语言基础绘图系统上开发的绘图包。它最大的特点就是优化基础绘图的默认值并能更简单地去展示多元关系,最特别的就是它支持trelli绘图方式来揭示条件关系。其典型使用方法如下;graph_type(formula, data=)
这里的graph_type是指待绘制的图表类型,如下表所示:
图形类型 |
描述 |
公式 |
barchart |
条形图 |
x~A or A~x |
bwplot |
箱线图 |
x~A or A~x |
cloud |
3D 散点图 |
z~x*y|A |
contourplot |
3D 等高线图 |
z~x*y |
densityplot |
核密度图 |
~x|A*B |
dotplot |
点图 |
~x|A |
histogram |
直方图 |
~x |
levelplot |
3D 层次图 |
z~y*x |
parallel |
平行坐标图 |
data frame |
splom |
散点图矩阵 |
data frame |
stripplot |
条纹图 |
A~x or x~A |
xyplot |
散点图 |
y~x|A |
wireframe |
3D 网格图 |
z~y*x |
formula主要是用来指定图中展示的变量及其关系,比如公式 ~x|A就是指将A变量作为因子,绘制的变量x在不同层次A中的关系;而y~x | A*B 则是以因子A和B的不同组合作为不同层次,绘制各个层次之下的y和x之间的关系;另外 ~x表示只绘制变量x。
第二部分:实例展示
接下来我将以mtcars数据集为例介绍几种常见的实例,希望能给大家带来帮助。
# Lattice包绘图实例library(lattice) # 加载R包attach(mtcars) # 固定数据集# 构建gear变量为因子并以不同的gear值作为标签gear.f<-factor(gear,levels=c(3,4,5),labels=c("3gears","4gears","5gears"))# 构建cyl变量为因子并以不同的cyl值作为标签cyl.f <-factor(cyl,levels=c(4,6,8),labels=c("4cyl","6cyl","8cyl"))# 绘制核密度图densityplot(~mpg, main="Density Plot", xlab="Miles perGallon")
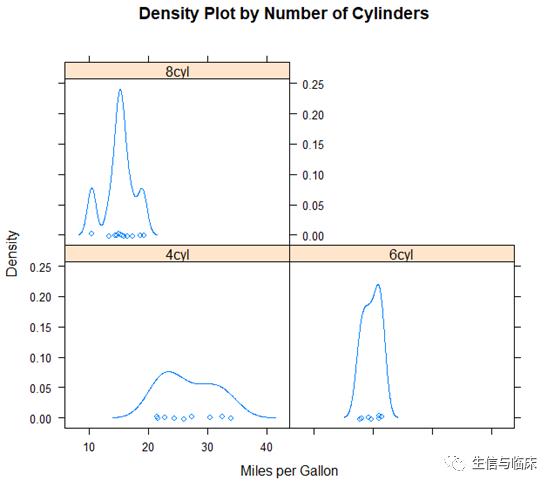
# 按cyl因子层次绘制核密度图densityplot(~mpg|cyl.f, main="Density Plot by Number ofCylinders",xlab="Miles per Gallon")
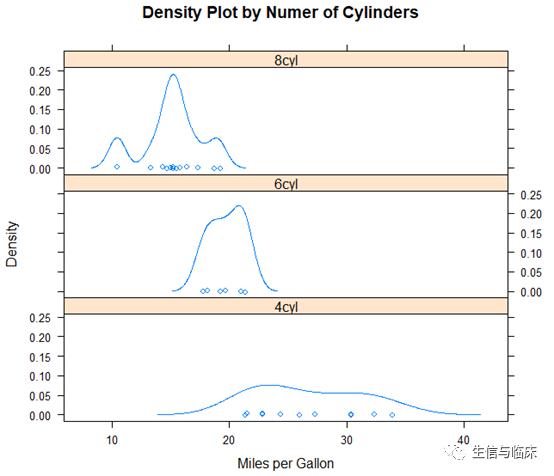
# 按cyl因子层次绘制核密度图,并用layout( )进行排版densityplot(~mpg|cyl.f, main="Density Plot by Numer ofCylinders",xlab="Miles per Gallon", layout=c(1,3))
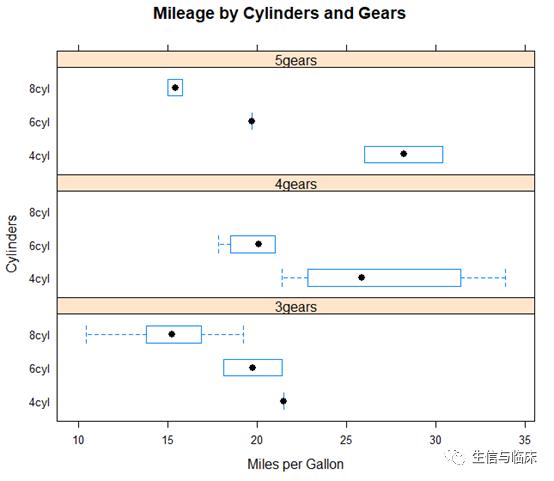
# 按因子gear和cyl的不同组合绘制箱线图bwplot(cyl.f~mpg|gear.f, ylab="Cylinders", xlab="Miles perGallon",main="Mileage by Cylinders and Gears", layout=(c(1,3)))
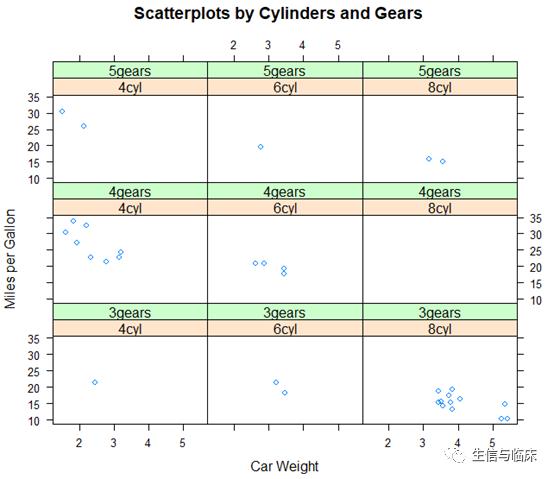
# 按因子gear和cyl的不同组合绘制变量mpg与wt之间的散点图xyplot(mpg~wt|cyl.f*gear.f, main="Scatterplots by Cylinders andGears", ylab="Miles per Gallon", xlab="Car Weight")
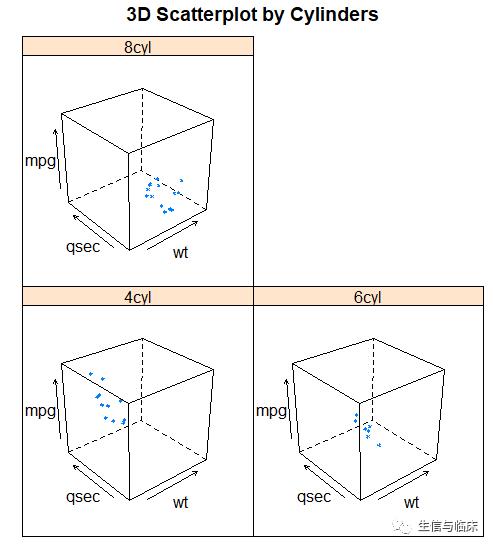
# 按因子cyl的不同层次绘制3d散点图cloud(mpg~wt*qsec|cyl.f, main="3D Scatterplot by Cylinders")
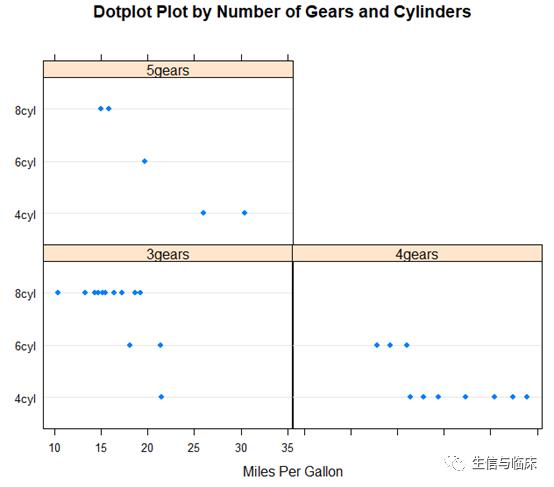
# 按因子gear绘制因子cyl与mpg之间的点图dotplot(cyl.f~mpg|gear.f, main="Dotplot Plot by Number of Gears andCylinders", xlab="Miles Per Gallon")
# 绘制散点图矩阵splom(mtcars[c(1,3,4,5,6)], main="MTCARS Data")
第三部分:自定义Lattice绘图
与R语言基础绘图系统不同的是,lattice绘图不受函数par( )里的选项的影响。
# 自定义 Lattice绘图实例library(lattice)panel.smoother <- function(x, y) {panel.xyplot(x, y) # 绘制点panel.loess(x, y) # 绘制平滑曲线}attach(mtcars)hp <- cut(hp,3) # 将马力这个变量分成3块xyplot(mpg~wt|hp, scales=list(cex=.8, col="red"),panel=panel.smoother,xlab="Weight", ylab="Miles perGallon",main="MGP vs Weight by HorsePower")
以上是关于R语言进阶之Lattice绘图的主要内容,如果未能解决你的问题,请参考以下文章