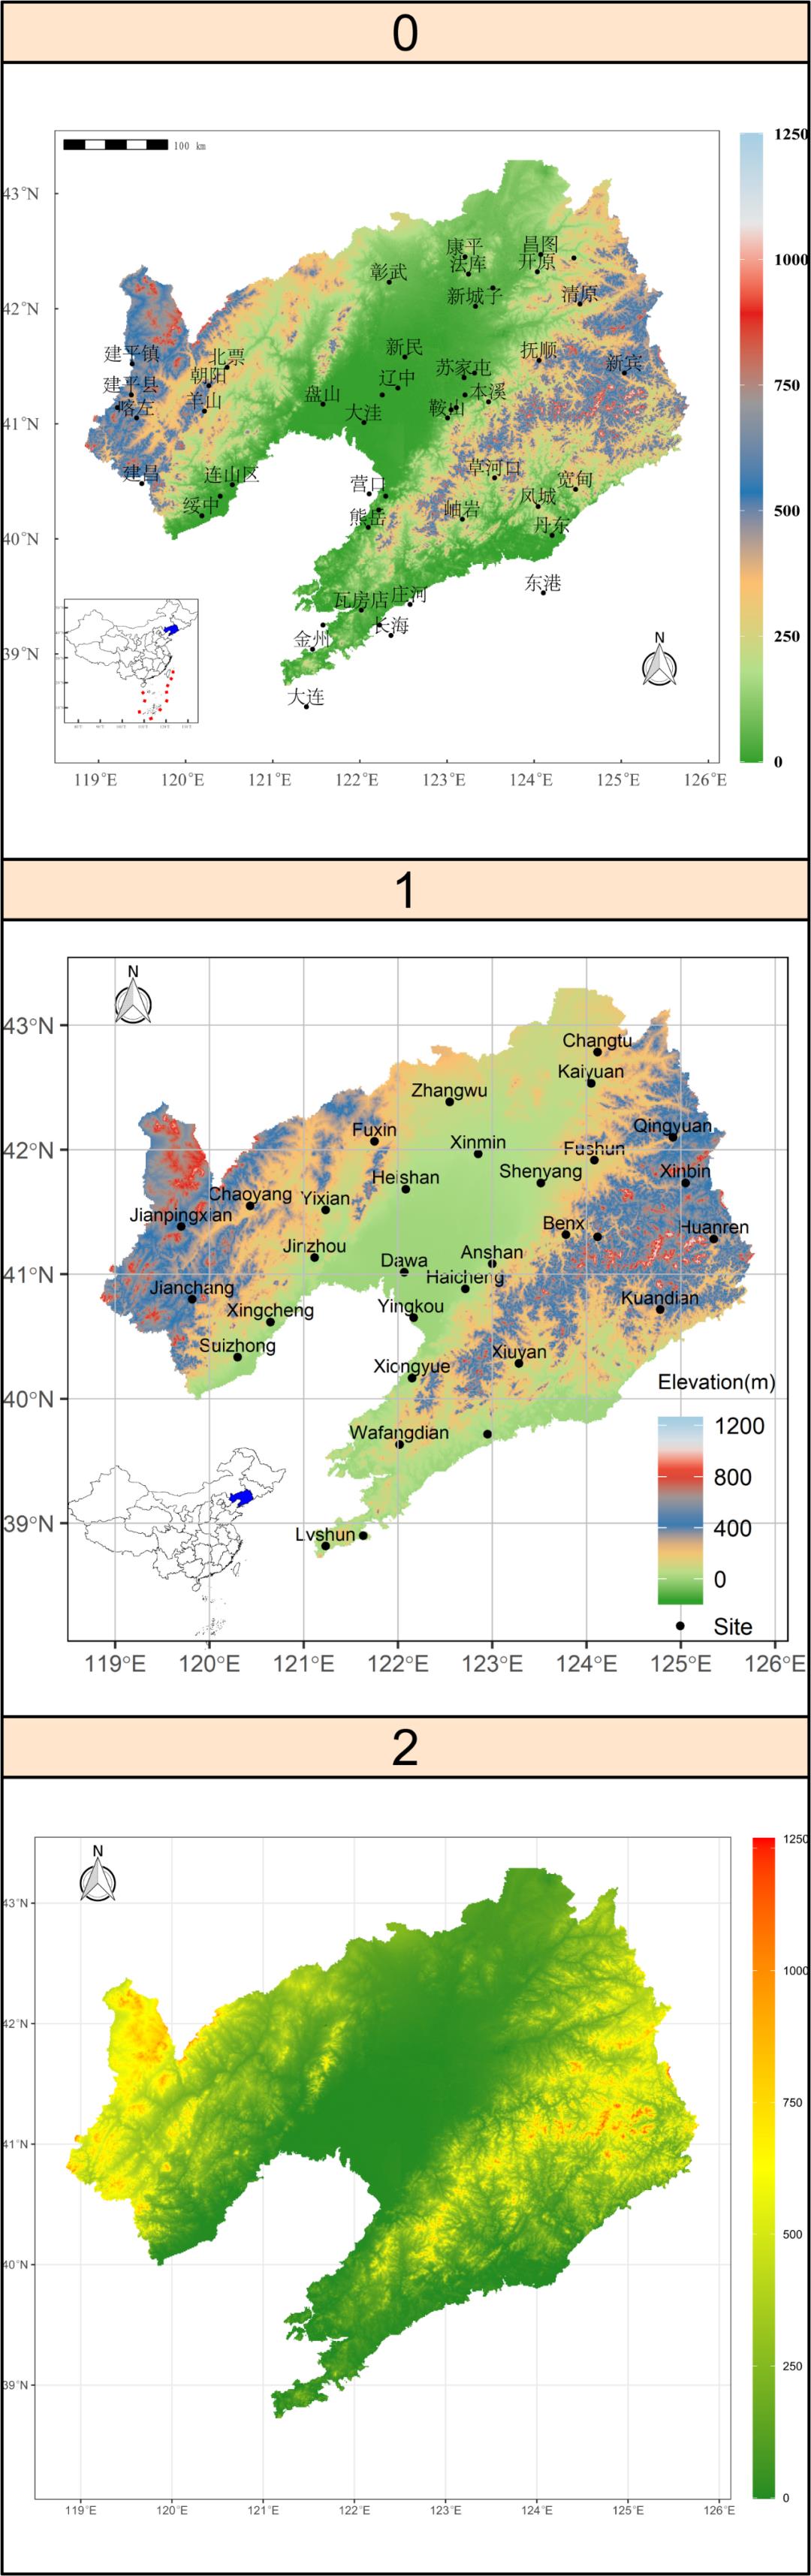
R语言绘制研究区域DEM图
Posted 气象水文科研猫
tags:
篇首语:本文由小常识网(cha138.com)小编为大家整理,主要介绍了R语言绘制研究区域DEM图相关的知识,希望对你有一定的参考价值。
气象水文科研猫公众号交流邮箱:leolovehydrometeor@hotmail.com欢迎投稿&批评指正如有侵权且本公众号未能正确引用原文,请联系删除,谢谢理解、配合。
#作者:沈阳农业大学陈涛涛副教授#作者:沈阳农业大学陈涛涛副教授#作者:沈阳农业大学陈涛涛副教授library(tidyverse)library(sf)library(raster)library(rgdal)library(glue)library(data.table)library(ggsn)library(cowplot)## read dem filemyfile <- "F:/Rpeng/29/dem/sheng/china92/w001001.adf"dem <- new("GDALReadOnlyDataset", myfile) %>% asSGDF_GRODcrs.geo <- CRS("+proj=longlat +ellps=WGS84 +datum=WGS84")## get the boundary of Three River Plainsjpy <-read_sf("F:/Rpeng/29/dem/CN-sheng-A.shp",options = "ENCODING=gb2312",stringsAsFactors = FALSE) %>%filter(name == "辽宁") %>% st_transform(crs = crs.geo)bdf <-sjpy %>% getElement("geometry") %>% st_transform(crs = crs.geo) %>% as_Spatial()## mask dem using the boundarydem.sj <- raster(dem)dem.sj <- dem.sj %>% crop(bdf) %>%raster::aggregate(fact = 0.01 / res(dem.sj)) %>% #设置分辨率mask(bdf) %>% as.data.frame(xy = TRUE)pal8 <- c("#228B22","#FFFF00","#FF0000") #http://www.mamicode.com/info-detail-1448036.htmllibrary(ggplot2)library(ggspatial)G1 <- ggplot(dem.sj) + geom_raster(aes(x, y, fill = band1), na.rm = TRUE) +scale_fill_gradientn(colours = pal8, na.value = "transparent",breaks = c(0,250,500,750,1000,1250),labels = c(0,250,500,750,1000,1250),limits = c(0,1250))+scale_size_manual(values = c(1),breaks = c("a"),labels = c("Site")) +north(sjpy,location ="bottomright" ,0.1)+ylim(38.3,43.3)+coord_sf(crs = crs.geo)+annotation_scale(location = "tl")+theme_bw()+theme(legend.key.height = grid::unit(3.6, "cm"))G1# China mini map ------------------------------------------------------------------------------China <- read_sf("F:/Rpeng/29/dem/CN-sheng-A.shp",options = "ENCODING=gb2312",stringsAsFactors = FALSE) %>% st_transform(crs = crs.geo)G.China <- ggplot(China)+geom_sf(fill="white",color="black",size=0.1)+geom_sf(data=sjpy,fill="blue",color="black",size=0.1)+coord_sf(crs = crs.geo)+theme_void()G.China# insert mini China map into the plot ---------------------------------------------------------Gs <- cowplot::ggdraw()+cowplot::draw_grob(ggplotGrob(G.China),x = 0,y = 0,scale = 0.3,hjust = 0.24, vjust = 0.3)+draw_plot(G1)GsSitesinRegion <- read.csv('F:/Rpeng/29/dem/ln2.csv',header = T)pal8 <- c("#33A02C", "#B2DF8A", "#FDBF6F", "#1F78B4", "#999999", "#E31A1C", "#E6E6E6", "#A6CEE3")G1 <- ggplot(dem.sj) + geom_raster(aes(x, y, fill =band1), na.rm = TRUE) +geom_point(data = SitesinRegion,aes(x=X,y=Y,size="a"))+scale_size_manual(values = c(1),breaks = c("a"),labels = c("Site")) +geom_text(data = SitesinRegion,aes(x=X,y=Y,label=sss),size=5,check_overlap =TRUE,nudge_y=0.1)+scale_fill_gradientn(colours = pal8, na.value = "transparent",breaks = c(0,250,500,750,1000,1250),labels = c(0,250,500,750,1000,1250),limits = c(0,1250))+scale_size_manual(values = c(1),breaks = c("a"),labels = c("Site")) +north(sjpy,location ="bottomright" ,0.1)+annotation_scale(location = "tl")+ylim(38.3,43.3)+coord_sf(crs = crs.geo)+theme_bw()+theme(legend.key.height = grid::unit(3.6, "cm"))+theme(panel.grid.major=element_line(colour=NA),panel.background = element_rect(fill = "transparent",colour = NA),plot.background = element_rect(fill = "transparent",colour = NA),panel.grid.minor = element_blank())+ # 去除地图网格theme(axis.ticks.length=unit(-0.1, "cm"),axis.text.x = element_text(margin=unit(c(0.5,0.5,0.5,0.5), "cm")),axis.text.y = element_text(margin=unit(c(0.5,0.5,0.5,0.5), "cm")) )+theme(axis.text.x = element_text(angle=0,hjust=1), # 旋转坐标轴label的方向text = element_text(size = 16, face = "bold", family="serif"),panel.spacing = unit(0,"lines") )G1# China mini map ------------------------------------------------------------------------------China <- read_sf("F:/Rpeng/29/dem/CN-sheng-A.shp",options = "ENCODING=gb2312",stringsAsFactors = FALSE) %>% st_transform(crs = crs.geo)G.China <- ggplot(China)+geom_sf(fill="white",color="black",size=0.1)+geom_sf(data=sjpy,fill="blue",color="black",size=0.1)+coord_sf(crs = crs.geo)+theme_bw() + # 去除地图灰色背景theme(panel.grid.major=element_line(colour=NA),panel.background = element_rect(fill = "transparent",colour = NA),plot.background = element_rect(fill = "transparent",colour = NA),panel.grid.minor = element_blank())+ # 去除地图网格theme(axis.ticks.length=unit(-0.1, "cm"),axis.text.x = element_text(margin=unit(c(0.5,0.5,0.5,0.5), "cm")),axis.text.y = element_text(margin=unit(c(0.5,0.5,0.5,0.5), "cm")) )+theme(axis.text.x = element_text(angle=0,hjust=1), # 旋转坐标轴label的方向text = element_text(size = 4, face = "bold", family="serif"),panel.spacing = unit(0,"lines") )+ #分面间隔设为零scale_y_continuous(expand = c(0,0))+ #这个可以图形去掉与X轴间隙scale_x_continuous(expand = c(0,0)) #这个可以去掉图形与Y轴间隙G.Chinaintegrated_plot = ggdraw()+draw_plot(G1)+draw_plot(G.China, x =0.07, y =0.11,width = 0.22, height = 0.33)integrated_plotpdf("F:/Rpeng/29/integrated_plot.pdf",family="GB1", width=9, height=9)integrated_plotdev.off()
Python绘制DEM图往期推文超链接:
《》
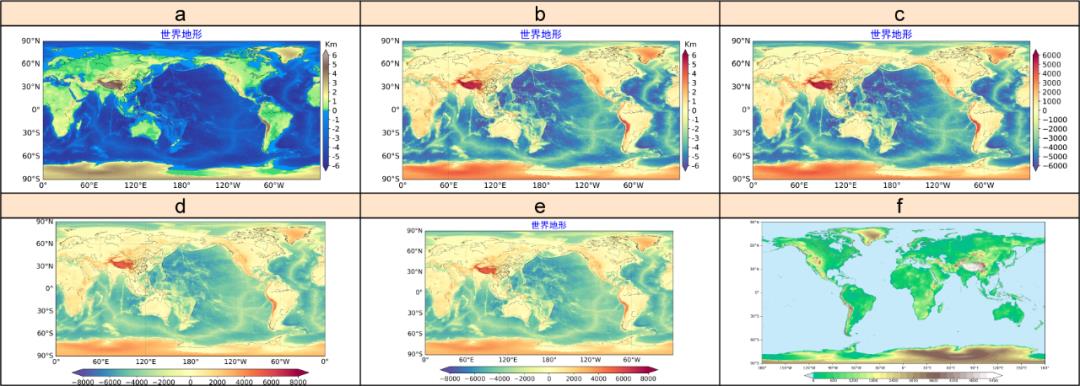
ArcGis绘制DEM图:
Matlab绘制DEM图:
推荐谷歌教程:https://www.google.com.hk/search?q=dem+map+in+matlab&tbm=isch&ved=2ahUKEwjZ7-2K7MrrAhXyADQIHcvFDcMQ2-cCegQIABAAhttps://www.google.com.hk/search?q=tif+map+dem+in+matlab&tbm=isch&ved=2ahUKEwjehe7N7srrAhXbGzQIHYeTCR0Q2-cCegQIABAA&oq=tif+map+dem+in+matlab&gs_lcp=CgNpbWcQAzoCCAA6BQgAELEDOgQIABAMOgQIABATOggIABAMEB4QEzoICAAQCBAeEBM6CAgAEAUQHhATOgoIABAMEAUQHhATUIZmWJe8AWCqwAFoAHAAeACAAegFiAGgPJIBDDItMTQuMS4xLjMuMpgBAKABAaoBC2d3cy13aXotaW1nwAEB&sclient=img&ei=m8RPX57MFdu30PEPh6em6AE&safe=strict
Matlab绘制DEM图往期推文:
1 《》
2 《》
3 《》
https://topotoolbox.wordpress.com/2019/02/06/some-new-functions-and-features-in-topotoolbox/https://ww2.mathworks.cn/help/map/ref/geoshow.htmlhttps://www.eoas.ubc.ca/~rich/mapug.htmlhttps://www.ngdc.noaa.gov/mgg/global/https://www.cnblogs.com/ruo-li-suo-yi/p/7528554.html
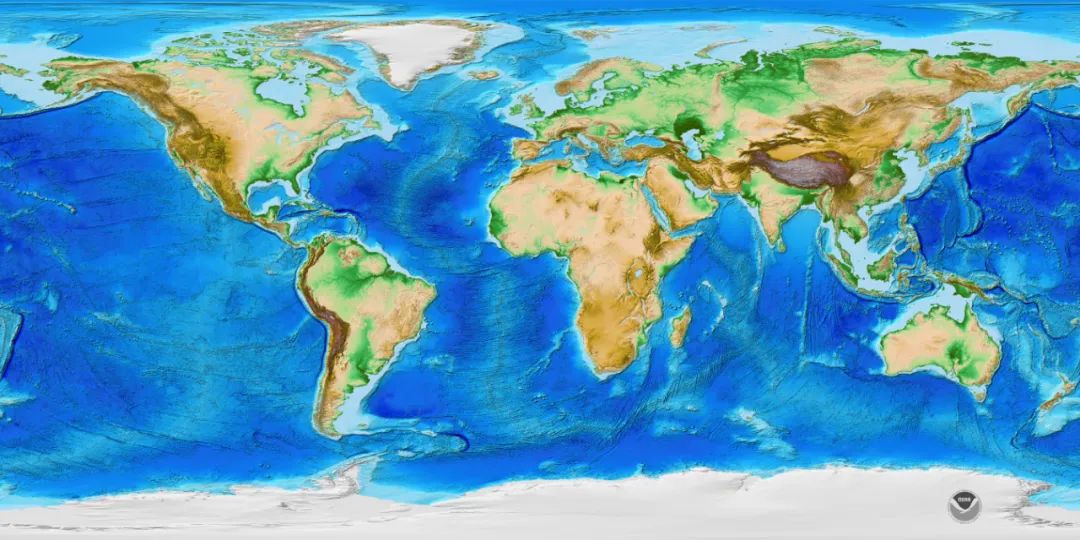
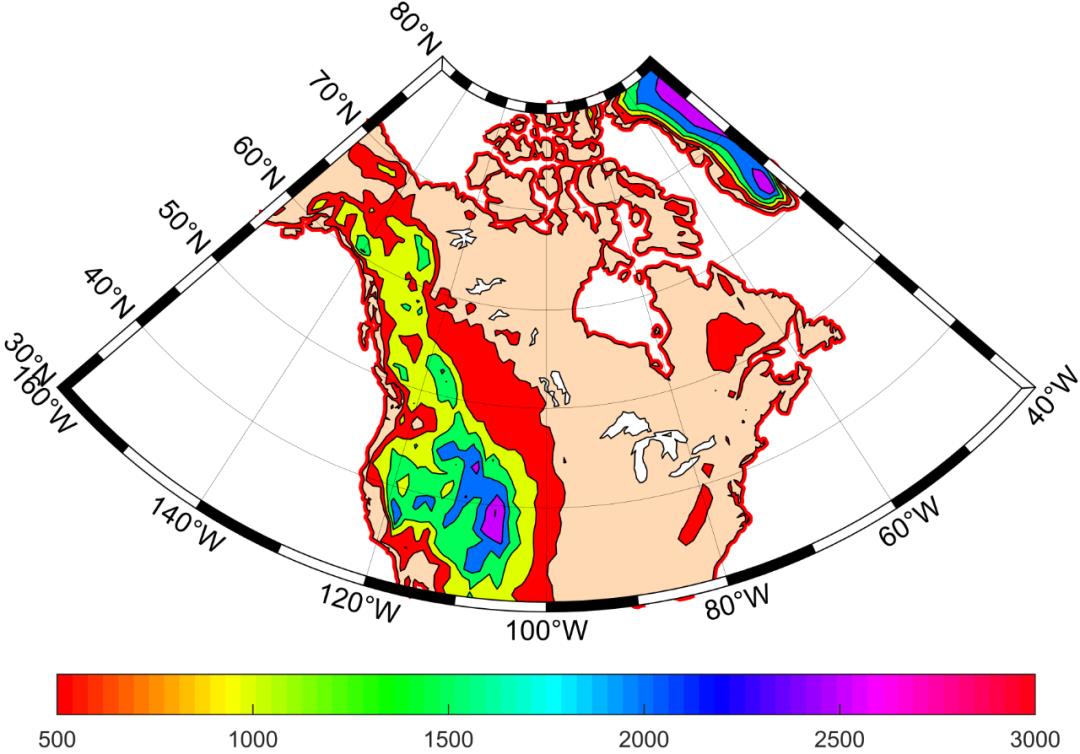
clc;clear;close allm_proj('lambert','long',[-160,-40],'lat',[30,80]);m_coast('color','r','linewidth',3);m_coast('patch',[1.0,0.85,0.7]);m_elev('contourf',[500:500:6000]);m_grid('linestyle','-','box','fancy','fontsize',11,'tickdir','in','xtick',[-160:20:-40],'ytick',[30:10:80]);colormap('copper');colorbar('location','southoutside');
只要你点下方【分享】【赞】【在看】
我们就是好朋友,Thanks♪(・ω・)ノ
以上是关于R语言绘制研究区域DEM图的主要内容,如果未能解决你的问题,请参考以下文章