Perl 版Circos -绘图篇-scatter plot绘图
Posted 作图丫
tags:
篇首语:本文由小常识网(cha138.com)小编为大家整理,主要介绍了Perl 版Circos -绘图篇-scatter plot绘图相关的知识,希望对你有一定的参考价值。
正如之前介绍的一样,plot绘图包括scatter, line, histogram, heatmap等绘图模式。今天小编从scatter散点图开始介绍plot的绘图内容。
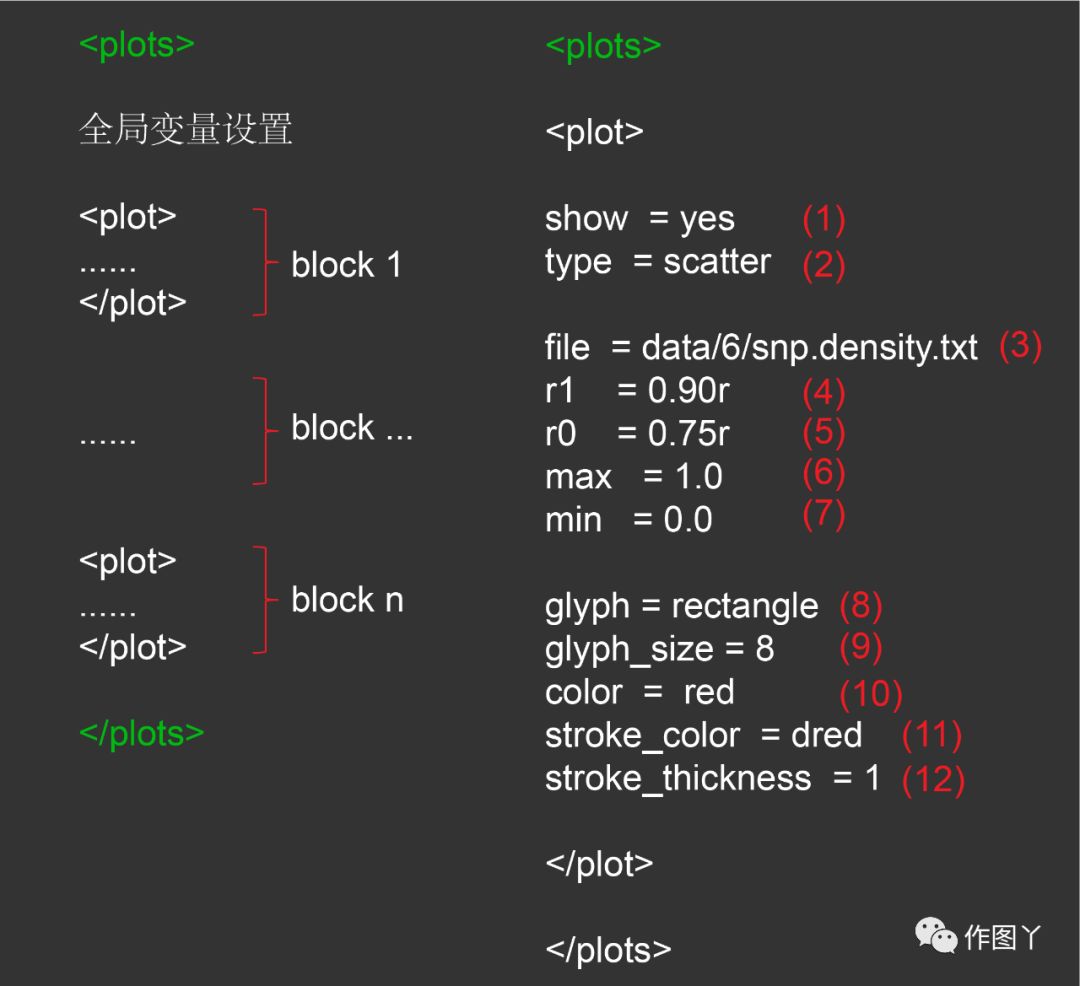
首先大家来看看具体block图:

从图中可以很明显的看到这个”<plots> </plots>”来定义 block,这与其他的绘图block定义是相似的,只不过是换关键词而已,并且plot中通过“type”可以定义绘图模式。在这个block中会有一个或多个<plot> </plot>”来声明每个plot的模式类型(type)、位置(r0,r1)、填充颜色(color)的信息。
(1) show是plot是否绘制的设置。
(2) type是绘制类型的选择,包括scatter, line, histogram, heatmap等。
(3) file是展示的位置区段文件,第四列可以是SNP、Indel、GC含量以及比对read数量或密度,格式如图:

(4)r1代表环形外圈的值。
(5)r0代表环形内圈的值。
(6)max代表绘制散点的最大值,超过最大值将不会绘制出来。
(7)min代表绘制散点的最小值,同样的低于最小值也不会绘制出来。
(8)glyph代表绘制点的类型,包括 circle,rectangle 和 triangle三种。
(9)glyph_size代表绘制点的大小。
(10)color代表图形内部区域填充的颜色。
(11)stroke_color代表图形边框的颜色。
(12)stroke_thickness代表图形边框的粗细。
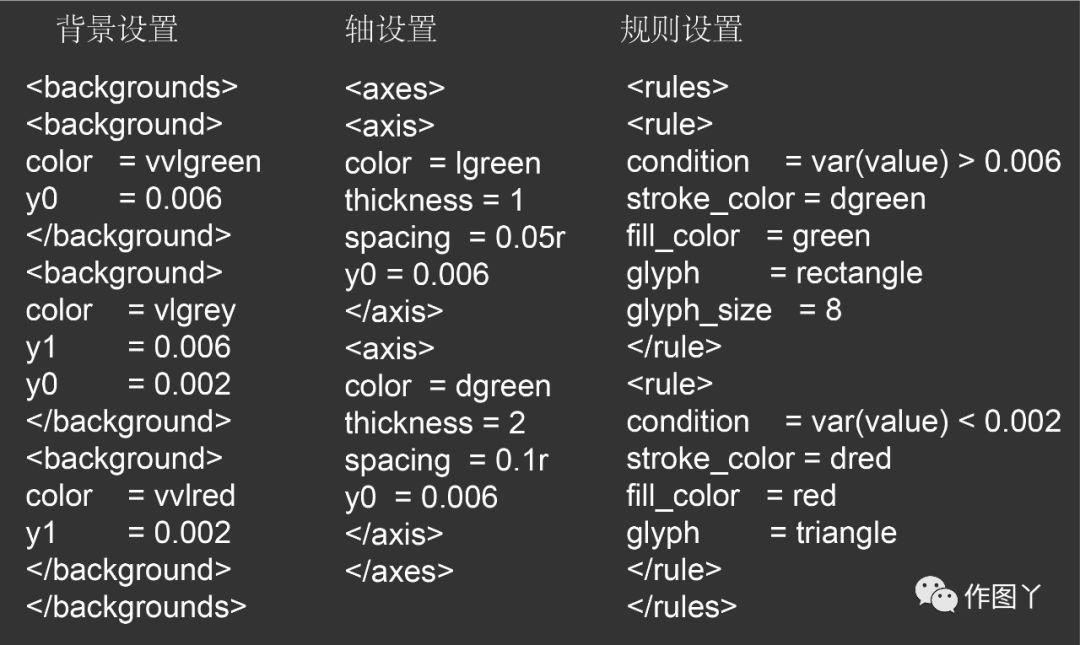
此外,在plot block中还可以插入不同的backgroud,axis和rule等block来控制背景、坐标轴和显示图形的规则。
三个block具体如下图:

backgrounds 定义环形区域的背景色,每个区域是由y0和y1来定义。由于scatter中可以设置min和max,因此背景色的区域划分需要根据min,max,y0和y1这四个值得大小来进行划分。具体解释如下:
<backgrounds><background>#最外圈背景区域,没有定义y1,因此y1为max或数据最大值,颜色为vvlgreencolor = vvlgreeny0 = 0.006</background><background>#次外圈背景区域,定义了y0和y1,区域为0.002~0.006,颜色为vlgreycolor = vlgreyy1 = 0.006y0 = 0.002</background><background>#最内的背景区域,没有定义y0,因此y0为min或数据最小值,区域为min~0.002,颜色为vvlredcolor = vvlredy1 = 0.002</background></backgrounds>
axis 定义了Y轴的刻度,同背景一样,有y0和y1来定义区域,spacing来定义刻度间隔。color定义颜色,thickness来定义刻度粗细。如下代码所示:
<axes><axis>color = lgreenthickness = 1spacing = 0.05ry0 = 0.006</axis><axis>color = dgreenthickness = 2spacing = 0.1ry0 = 0.006</axis><axis>color = lgreythickness = 1spacing = 0.05ry1 = 0.006y0 = 0.002</axis><axis>color = dgreythickness = 2spacing = 0.1ry1 = 0.006y0 = 0.002</axis><axis>color = lredthickness = 1spacing = 0.05ry1 = 0.002</axis><axis>color = dredthickness = 2spacing = 0.1ry1 = 0.002</axis></axes>
上述代码定义了三个区域:
最外圈0.006~max或数据最大值,定义了两种刻度线,一种是0.1r,颜色为dgreen,粗细为2;另一种为0.05r,颜色为lgreen,粗细为1。
次外圈为0.002~0.006,定义了两种刻度,一种是0.1r,颜色为dgrey,粗细为2;另一种为0.05r,颜色为lgrey,粗细为1。
最内圈数据最小值或min~0.002,定义了两种刻度,一种是0.1r,颜色为dred,粗细为2;另一种为0.05r,颜色为lred,粗细为1。
rule代表规则模块,同其他模块一样也是由多个rule构成;在每个rule中,conditioon设置规则,满足规则的往下继续执行。如下代码所示:
<rules><rule>condition = var(value) > 0.006stroke_color = dgreenfill_color = greenglyph = rectangleglyph_size = 8</rule><rule>condition = var(value) < 0.002stroke_color = dredfill_color = redglyph = triangle</rule></rules>
整体来看设置了两个rule block,分别是var(value) > 0.006和var(value) < 0.002,满足规则的分别进行stroke_color,fill_color,glyph等设置。
最终展现的scatter图如下:
今天的scatter 图绘制是不是也挺简单的呢?在了解了circos绘图的思想后这些block的理解还是挺容易的,不过还是需要调整设置练习一下最好,那样会记忆更加深刻。
以上是关于Perl 版Circos -绘图篇-scatter plot绘图的主要内容,如果未能解决你的问题,请参考以下文章