Flask+Echarts+sqlite搭建股票实时行情监控
Posted 机智出品
tags:
篇首语:本文由小常识网(cha138.com)小编为大家整理,主要介绍了Flask+Echarts+sqlite搭建股票实时行情监控相关的知识,希望对你有一定的参考价值。
从小白出发带你领略Python爬虫之美
一、系统环境:
Windows7+Python3.6+Echart3
二、结果展示:
股票实时行情.gif
三、实现过程:
PART ONE:tushare数据获取sqlite存储[monitor.py]
step 1:需要的库
from sqlalchemy import create_engine
import tushare as ts
import time
import pandas as pd
step2:获取行情并存储
这里我们使用的是Tushare隔3S获取一次股票实时行情数据,并存储至sqlite。
def stoc(i):
    df = ts.get_realtime_quotes('600031')
    data=[i]
    s1 = pd.Series(data, index=range(0,1,1))
    df['id'] = s1
    engine = create_engine('sqlite:///test.db', convert_unicode=True)
    #追加数据到现有表
    df.to_sql('tick_data',engine,if_exists='append')

i=0
while True:
    stoc(i)
    time.sleep(3)
    i=i+1
    print('insert %s datas'%i)
PART TWO:路由器[app.py]
step 1:需要的库
import sqlite3
from flask import *
import os
step 2:设置
app = Flask(__name__)
app.config['USERNAME']='finance'#账号密码
app.config['PASSWORD']='finance'
app.secret_key=os.urandom(24)
step 3:URL
@app.route('/login', methods=['GET', 'POST'])
def login():
    error = None
    if request.method == 'POST':
        if request.form['username'] != app.config['USERNAME']:
            error = 'Invalid username'
        elif request.form['password'] != app.config['PASSWORD']:
            error = 'Invalid password'
        else:
            session['logged_in'] = True
            flash('You were logged in')
            return redirect(url_for('index'))
    return render_template('login.html', error=error)

@app.route('/logout')
def logout():
    session.pop('logged_in', None)
    flash('You were logged out')
    return redirect(url_for('login'))

def get_db():
    db = sqlite3.connect('test.db')
    db.row_factory = sqlite3.Row
    return db

def query_db(query, one=False):#, args=()
    db = get_db()
    cur = db.execute(query)#, args
    db.commit()
    rv = cur.fetchall()
    db.close()
    return (rv[0] if rv else None) if one else rv

@app.route("/", methods=["GET"])
def index():
    if session.get('logged_in'):
        return render_template("index.html")
    else:
        return redirect(url_for('login'))

@app.route("/finance", methods=["POST"])
def finance():
    if request.method == "POST":
        res = query_db("SELECT * FROM tick_data ")
        print(int(request.form['id']))
    return jsonify(time = [x[32] for x in res],
                   price = [x[4] for x in res]) # 返回json格式

if __name__ == "__main__":
    app.run(debug=True)
PART THREE:页面[index.html]
<!DOCTYPE html>
<html style="height: 100%" lang="en">
<head>
    <meta charset="utf-8">
    <title>My Finance</title>
    <script ></script>
    <script ></script>
    <!-- 引入 vintage 主题 -->
    <script ></script>
</head>
<body style="height: 100%; margin: 0">
    <div id="main" style="height: 100%"></div>
    <script type="text/javascript">
    var myChart = echarts.init(document.getElementById('main'), 'dark');
    myChart.setOption({
        title: {
            top: 5,
            left: 'center',
            text: 'My Finance',
            textStyle: {
            color: '#00FFFF',
            fontSize: 18
            }
        },
        tooltip: {
            trigger: 'axis',
            axisPointer: {
            animation: false,
            type: 'cross',
            lineStyle: {
                color: '#376df4',
                width: 2,
                opacity: 1
                }
            }
        },
        legend: {
            top: 30,
            left: 'center',
            data:['price']
        },
        toolbox: {
        show : true,
        orient : 'vertical',
        top : '35%',
        right : 45,
        feature : {
            mark : {show: true},
            dataView : {show: true, readOnly: false},
            magicType : {show: true, type: ['line', 'bar']},
            restore : {show: true},
            saveAsImage : {show: true}
            }
        },
        xAxis: {
            data: [],
            axisLine: { lineStyle: { color: '#8392A5' } }
        },
        yAxis: {
        //maxInterval: 0.1
        //interval:0.1,
        min:'dataMin',
        axisLine: { lineStyle: { color: '#8392A5' } }
        //max:'dataMax'
        //splitNumber:5
        },
        dataZoom: [
            {
                "show": true,
                textStyle: {
                color: '#8392A5'
                },
                "type": "slider",
                handleIcon: 'M10.7,11.9v-1.3H9.3v1.3c-4.9,0.3-8.8,4.4-8.8,9.4c0,5,3.9,9.1,8.8,9.4v1.3h1.3v-1.3c4.9-0.3,8.8-4.4,8.8-9.4C19.5,16.3,15.6,12.2,10.7,11.9z M13.3,24.4H6.7V23h6.6V24.4z M13.3,19.6H6.7v-1.4h6.6V19.6z',
                handleSize: '80%',
                dataBackground: {
                    areaStyle: {
                    color: '#8392A5'
                    },
                    lineStyle: {
                    opacity: 0.8,
                    color: '#8392A5'
                    }
                },
                handleStyle: {
                    color: '#fff',
                    shadowBlur: 3,
                    shadowColor: 'rgba(0, 0, 0, 0.6)',
                    shadowOffsetX: 2,
                    shadowOffsetY: 2
                },
                "start": 50,
                "end": 100,
                "orient": "horizontal"
            }
        ],
        series: [{
            name: 'price',
            type: 'line',
            //smooth:true,
            sampling:'average',
            areaStyle: {
                normal: {
                    color: new echarts.graphic.LinearGradient(0, 0, 0, 1, [{
                        offset: 0,
                        color: 'rgba(0, 136, 212, 0.3)'
                    }, {
                        offset: 0.8,
                        color: 'rgba(0, 136, 212, 0.1)'
                    },{
                        offset: 1,
                        color: 'rgba(0, 136, 212, 0)'
                    }], false),
                    shadowColor: 'rgba(0, 0, 0, 0.1)',
                    shadowBlur: 10
                }
            },
            itemStyle: {
                normal: {
                    color: 'rgb(0,136,212)',
                    borderColor: 'rgba(0,136,212,0.2)',
                    borderWidth: 12
                }
            },
            data: []
        }]
    });
    var time = [],
        price = [],
        lastID = 0;
    //准备好统一的 callback 函数
    var update_mychart = function (data) { //data是json格式的response对象
        myChart.hideLoading(); // 隐藏加载动画
        dataLength = data.time.length;
        if (dataLength == lastID){clearInterval(timeTicket);};//取得数据和上次长度一样停止ajax
        lastID = dataLength;
        time = time.slice(dataLength).concat(data.time);
        price = price.slice(dataLength).concat(data.price.map(parseFloat));
        // 填入数据
        myChart.setOption({
            xAxis: {
                data: time
            },
            series: [{
                name: 'price',
                data: price
            }]
        })
    }
    myChart.showLoading(); // 首次显示加载动画
    $.get('/finance').done(update_mychart);
    var timeTicket = setInterval(function () {
        $.post('/finance',{id: lastID}).done(update_mychart);
    }, 3000);
    </script>
</body>
</html>
先运行monitor.py获取一些数据,再运行app.py,然后打开http://127.0.0.1:5000,就可以看到如下界面:
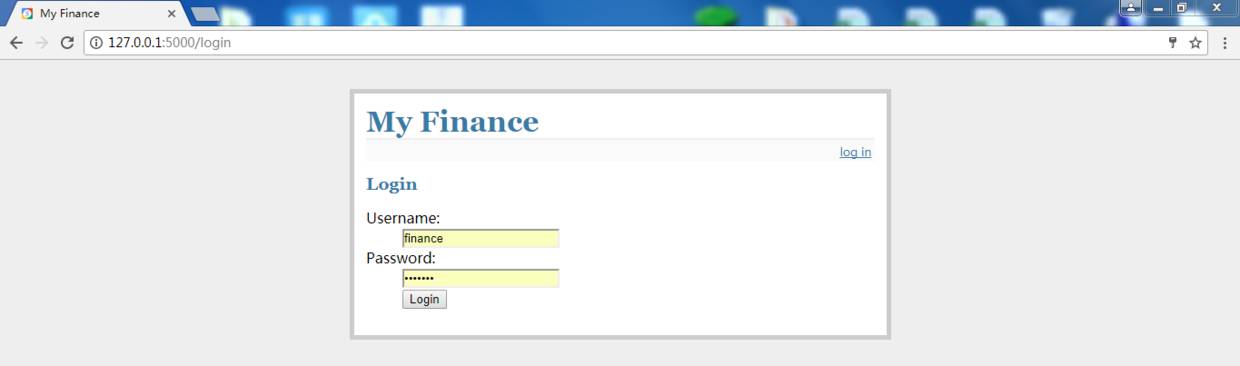
Login.PNG
My Finance.PNG
以上是关于Flask+Echarts+sqlite搭建股票实时行情监控的主要内容,如果未能解决你的问题,请参考以下文章
flask+sqlite3+echarts2+ajax数据可视化报错:UnicodeDecodeError: 'utf8' codec can't decode byte解决方
基于ECharts的股票行情分时K线MACDDIFDEA图表 (绝无仅有)