QCustomPlot(三):图形绘制基础之样式修改
Posted
tags:
篇首语:本文由小常识网(cha138.com)小编为大家整理,主要介绍了QCustomPlot(三):图形绘制基础之样式修改相关的知识,希望对你有一定的参考价值。
参考技术A 图形的外观由许多因素决定,所有这些因素都可以修改。以下是最重要的:轴的外观可以通过改变它们所用的笔和它们的标签使用的字体来修改。具体可以查看 QCPAxis 的文档。以下是最重要属性的快速摘要: setBasePen , setTickPen , setTickLength , setSubTickLength , setSubTickPen , setTickLabelFont , setLabelFont , setTickLabelPadding , setLabelPadding . 您可以使用 setRangeReversed 反转轴(例如,使值从左到右减少而不是增加)。如果您想在轴端装饰(例如箭头),请使用 setLowerEnding 或 setUpperEnding 。
通过访问轴的相应 QCPGrid 实例来修改网格。例如,更改与左轴相连的水平网格线的外观是通过访问 customPlot ->yAxis ->grid() . 网格线的外观基本上是它们所用的笔,可以通过 yAxis ->grid() ->setPen() 设置。刻度 0 处的网格线可以用不同的笔绘制,它可以配置为 setZeroLinePen . 如果您不想用特殊的笔画零线,只需将其设置为Qt::NoPen,刻度 0 处的网格线将使用普通网格笔绘制。
子网格线默认设置为不可见。它们可以用 grid() ->setSubGridVisible (true) 激活。
这是一个创建具有指数包络的衰减余弦函数图像的示例:
如您所见,对图形应用填充就像设置一个非 Qt::NoBrush 画刷. 填充将从图表(此处为图表 0)到平行于键(此处为 x)轴的零值线。如果我们想要在此图和另一个图之间进行通道填充,我们将另外调用 graph ->setChannelFillGraph (otherGraph). 要删除通道填充,只需0作为其他图形传递,填充将像以前一样一直到达零值线。要完全移除填充,请调用graph ->setBrush (Qt::NoBrush)。
现在,让我们看一个更复杂的示例,用于创建演示屏幕截图,其中包含四个轴上的五个图形、纹理填充、垂直误差线、图例、作为小数分隔符的点等。
如您所见,您可以自由定义哪个轴应该在图表中扮演哪个角色。例如,索引为 0 的图形使用左轴 ( yAxis ) 作为其键,底部轴 ( xAxis ) 作为其值。因此,该图相对于左轴向上站立:
为了显示图 1 的误差线,我们创建了一个 QCPErrorBars 实例,它可以附加到其他绘图表(如 QCPGraph )并为它们提供误差线。有关所用方法的进一步说明,请查看相应的文档。
接下来,我们将看看如何绘制与日期和/或时间相关的数据。它基本上归结为在各自的轴上安装不同类型的轴 QCPAxisTickerDateTime 的ticker 。
您传递给dateTicker ->setDateTimeFormat() 的字符串与传递给QDateTime::toString的字符串具有相同的日期格式选项,请参阅 Qt 文档。QCustomPlot 中的所有日期/时间坐标都以自 1970 年 1 月 1 日午夜 1 日以来的秒数处理,UTC(称为 Unix/Epoch 时间)。这也是您在调用日期/时间类QDateTime::toTime_t/或setTime_t时使用的单位。
对于亚秒级精度,轴ticker使用浮点数。因此,小于 1.0 的值表示相应的秒数。您可以使用 QCPAxisTickerDateTime ::dateTimeToKey 和 keyToDateTime 和 QDateTime 之间进行转换,这与 Qt 版本无关( QDateTime::toMSecsSinceEpoch 仅在 Qt 4.7 中引入)。
到目前为止,我们只查看了图表。由于它们是如此占主导地位的用例,QCustomPlot 为它们提供了一个专门的接口。我们一直在使用它: QCustomPlot ::addGraph 、 QCustomPlot ::graph 等等。但这还不是全部。QCustomPlot 有一个更通用的接口,用于 在绘图内绘制数据的类 ,称为 Plottables 。这个接口是围绕抽象基类 QCPAbstractPlottable 构建的。所有 Plottables 都派生自此类,也是熟悉的 QCPGraph 类。QCustomPlot 提供了许多其他的可绘图类:
与图表不同,其他绘图表需要在 new QCustomPlot 之外创建。这意味着有 addGraph 函数的方式没有 addCurve 或 addBars 函数。绘图表应属于的 QCustomPlot 实例是从绘图表的构造函数中传递的轴推断出来的。QCustomPlot 然后取得绘图表的所有权。可以使用 QCustomPlot ::plottable (int index)访问现有的绘图表, 并且可以使用 QCustomPlot ::plottableCount 检索绘图中的绘图表总数(包括图形)
这是一个创建包含三个条形图的条形图的快速示例:
有关其他绘图表的更多详细信息可以在示例项目和其他教程中找到。此外,每种可绘图类型在相应类的文档页面上都有详细描述。
当然,绝对有可能编写自己的绘图表以使任何数据看起来 完全 符合您的需要。您应该查看 QCPAbstractPlottable 文档以获取如何开始对其进行子类化的指南。您还可以查看现有的绘图表以了解它们是如何工作的。为此,建议先看看 QCPBars 或 QCPCurve 开始。 QCPGraph 功能非常丰富,因此可能不适合作为起点。
QCustomPlot(一):基础
QCustomPlot(二):图形绘制基础
基于QtQuick的QCustomPlot实现
文章目录
前言
QtQuick开发需要C++基础和JS基础
掌握必要的C++基础是学习和使用QtQuick框架的重要基石
QCustomPlot能做什么
可以在QWidget大放异彩,绘制各种图表和曲线
也可以在QtQuick大展拳脚
- 基于QtQuick的QCustomPlot实现
- 继承QQuickPaintedItem类 实现绘制
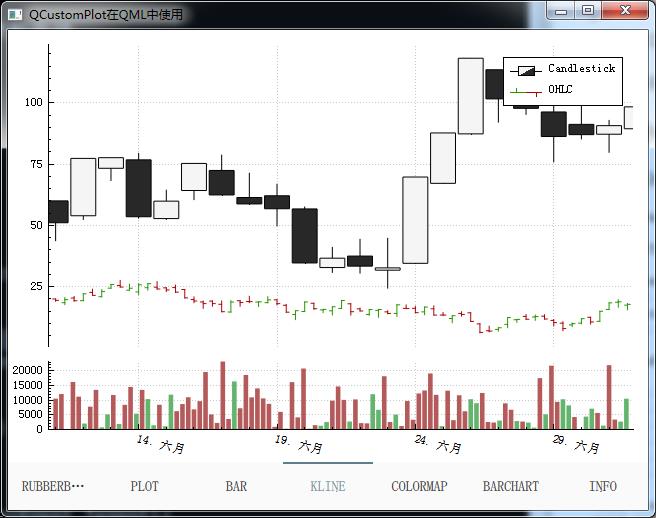
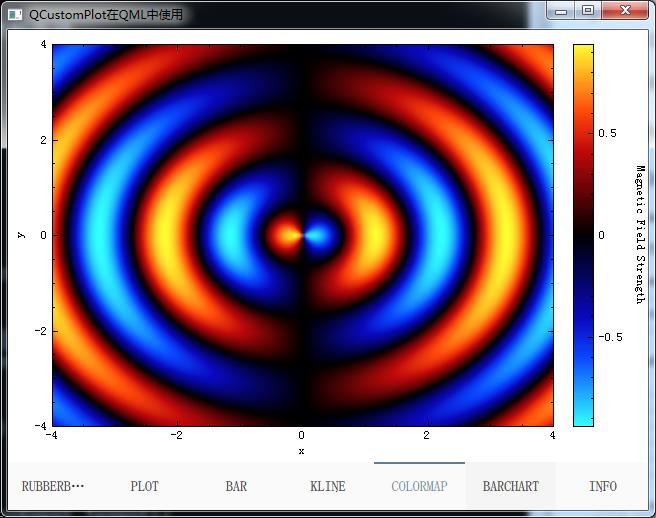
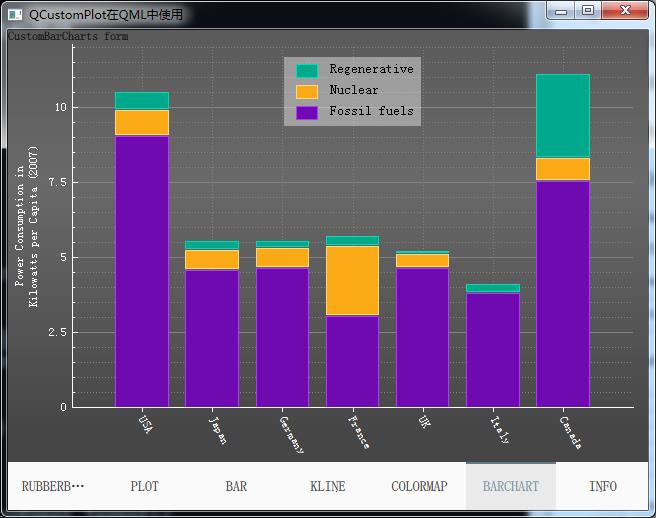
效果图


class DDuiBasePlotItem : public QQuickPaintedItem

    Q_OBJECT
public:
    DDuiBasePlotItem( QQuickItem* parent = 0 );
    virtual ~DDuiBasePlotItem();
    void paint( QPainter* painter );
    virtual void initCustomPlotUI()

    QCustomPlot *getPlot();
protected:
    virtual void hoverMoveEvent(QHoverEvent *event);
    virtual void mousePressEvent( QMouseEvent* event );
    virtual void mouseReleaseEvent( QMouseEvent* event );
    virtual void mouseMoveEvent( QMouseEvent* event );
    virtual void mouseDoubleClickEvent( QMouseEvent* event );
    virtual void wheelEvent( QWheelEvent *event );

    void routeMouseEvents( QMouseEvent* event );
    void routeWheelEvents( QWheelEvent* event );
public slots:
    void graphClicked( QCPAbstractPlottable* plottable );
    void onCustomReplot();
    void updateCustomPlotSize();
private:
    QCustomPlot*         m_CustomPlot;
;
///
/// \\brief DDuiCTPWidget::connectQuoteServer
/// 初始化
///
int main(int argc, char *argv[])

    QApplication a(argc, argv);
    qmlRegisterType<CustomPlotItem>("CustomPlot", 1, 0, "CustomPlotItem");
    qmlRegisterType<CustomPlotBarItem>("CustomPlot", 1, 0, "CustomPlotBarItem");
    qmlRegisterType<CustomKLine>("CustomPlot", 1, 0, "CustomKLine");//CustomColorMap
    qmlRegisterType<CustomColorMap>("CustomPlot", 1, 0, "CustomColorMap");
    qmlRegisterType<CustomBarChart>("CustomPlot", 1, 0, "CustomBarChart");

    QQmlApplicationEngine engine;
    engine.load(QUrl(QLatin1String("qrc:/main.qml")));

    return a.exec();
QML方面实现
import QtQuick 2.7
import QtQuick.Controls 2.0
import QtQuick.Layouts 1.0
import QtQuick.XmlListModel 2.0

ApplicationWindow
    visible: true
    width: 640
    height: 480
    title: qsTr("QCustomPlot在QML中使用")
    SwipeView
        id: swipeView
        anchors.fill: parent
        currentIndex: tabBar.currentIndex
        interactive: false

        DDRubberband

        PlotView


        CustomPlotBar


        CustomKLine


        CustomColorMap


        CustomBarCharts
        Page
            Label
                text: qsTr("This is implementation of http://www.qcustomplot.com/index.php/support/forum/172\\n" +
                           "Adding random data on 500 ms tick to plot")
                anchors.centerIn: parent

            XmlListModel
                id: xmlModel
                source: "qrc:/combox.xml"
                query: "/rss/item"
                XmlRole  name: "title"; query: "title/string()"
                XmlRole  name: "pubDate"; query: "pubDate/string()"

            ComboBox
                textRole: "title"
                model: xmlModel


    footer: TabBar
        id: tabBar
        currentIndex: swipeView.currentIndex
        TabButton
            text: qsTr("RubberBand")

        TabButton
            text: qsTr("Plot")

        TabButton
            text: qsTr("Bar")

        TabButton
            text: qsTr("KLine")

        TabButton
            text: qsTr("ColorMap")

        TabButton
            text: qsTr("BarChart")

        TabButton
            text: qsTr("Info")
注意事项
* 需要QCustomPlot源码
* 需要自己继续基于例子进行开发自己需要的图表
应用场景
- 方便QCustomPlot业务移植到QtQuick应用程序上面
源文件下载
源码下载链接源码
以上是关于QCustomPlot(三):图形绘制基础之样式修改的主要内容,如果未能解决你的问题,请参考以下文章