matlab中griddata函数怎么用
Posted
tags:
篇首语:本文由小常识网(cha138.com)小编为大家整理,主要介绍了matlab中griddata函数怎么用相关的知识,希望对你有一定的参考价值。
不要把help中直接粘上,最好举个例子
知道一系列点的坐标如下(1.486,3.059,0.1);(2.121,4.041,0.1);(2.570,3.959,0.1);(3.439,4.396,0.1);(4.505,3.012,0.1);(3.402,1.604,0.1);(2.570,2.065,0.1);(2.150,1.970,0.1);(1.794,3.059,0.2);(2.121,3.615,0.2);(2.570,3.473,0.2);(3.421,4.160,0.2);(4.271,3.036,0.2);(3.411,1.876,0.2);(2.561,2.562,0.2);(2.179,2.420,0.2);(2.757,3.024,0.3);(3.439,3.970,0.3);(4.084,3.036,0.3);(3.402,2.077,0.3);(2.879,3.036,0.4);(3.421,3.793,0.4);(3.953,3.036,0.4);(3.402,2.219,0.4);(3.000,3.047,0.5);(3.430,3.639,0.5);(3.822,3.012,0.5);(3.411,2.385,0.5);(3.103,3.012,0.6);(3.430,3.462,0.6);(3.710,3.036,0.6);(3.402,2.562,0.6);(3.224,3.047,0.7);(3.411,3.260,0.7);(3.542,3.024,0.7);(3.393,2.763,0.7)怎样用MATLAB绘制成三维曲面呢?使用griddata插值
A=[1.486,3.059,0.1;2.121,4.041,0.1;2.570,3.959,0.1;3.439,4.396,0.1;
4.505,3.012,0.1;3.402,1.604,0.1;2.570,2.065,0.1;2.150,1.970,0.1;
1.794,3.059,0.2;2.121,3.615,0.2;2.570,3.473,0.2;3.421,4.160,0.2;
4.271,3.036,0.2;3.411,1.876,0.2;2.561,2.562,0.2;2.179,2.420,0.2;
2.757,3.024,0.3;3.439,3.970,0.3;4.084,3.036,0.3;3.402,2.077,0.3;
2.879,3.036,0.4;3.421,3.793,0.4;3.953,3.036,0.4;3.402,2.219,0.4;
3.000,3.047,0.5;3.430,3.639,0.5;3.822,3.012,0.5;3.411,2.385,0.5;
3.103,3.012,0.6;3.430,3.462,0.6;3.710,3.036,0.6;3.402,2.562,0.6;
3.224,3.047,0.7;3.411,3.260,0.7;3.542,3.024,0.7;3.393,2.763,0.7];
x=A(:,1);y=A(:,2);z=A(:,3);
scatter(x,y,5,z)%散点图
figure
[X,Y,Z]=griddata(x,y,z,linspace(1.486,4.271)',linspace(1.604,4.276),'v4');%插值
pcolor(X,Y,Z);shading interp%伪彩色图
figure,contourf(X,Y,Z) %等高线图
figure,surf(X,Y,Z)%三维曲面 参考技术A x = rand(1,12);
y = rand(1,12);
z = rand(1,12); % now use some random z axis data
xi = linspace(min(x),max(x),30); % x interpolation points
yi = linspace(min(y),max(y),30); % x interpolation points
[Xi,Yi] = meshgrid(xi,yi); % create grid of x and y
Zi = griddata(x,y,z,Xi,Yi); % grid the data at Xi,Yi points
% Zi = griddata(x,y,z,Xi,Yi, 'linear') % same as above(default)
% Zi = griddata(x,y,z,Xi,Yi, 'cubic') % triangle based cubic interpolation
% Zi = griddata(x,y,z,Xi,Yi, 'nearest') % triangle based nearest neighbor
% Zi = griddata(x,y,z,Xi,Yi, 'invdist') % inverse distance method
mesh(Xi,Yi,Zi)
hold on
plot3(x,y,z, 'ko') % show original data as well
hold off
title('Figure 18.10: Griddata Example')
怎么用matlab画隶属度函数啊,求指教
1、首先在电脑上点击打开Matlab软件,如下图所示。

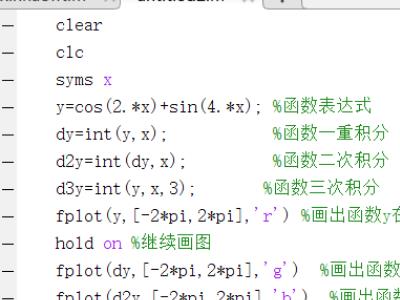
2、然后在页面中新建一个脚本文件,在新建脚本文件中输入下图所示程序,利用fplot函数画带参数的函数图像。
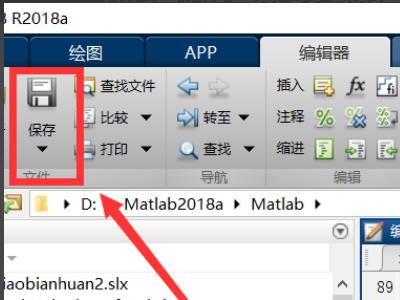
3、点击左上角的“保存”。
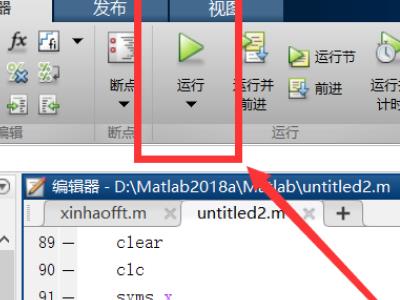
4、接着点击编辑器菜单中的“运行”菜单。
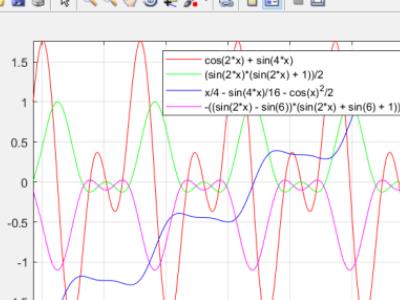
5、最后在弹出的figure页面中,就能看到所画出的图像了。
在fuzzy logic toolbox里有 fuzzy membership function可以编辑隶属度函数,非常方便,但是我们写论文一般要把相应的曲线导入到word里,怎样将隶属度函数曲线导入到word里呢?
方法如下:
plotmf(fismat,varType,varIndex)
Examples
a = readfis('tipper');
plotmf(a,'input',1)plotmf(模糊名,‘输入还是输出’,第几个输入或输出)。
就可以画出来图像,然后和平时的方法一样再进行edit》copy figure就可以了。 参考技术B 看软件帮助
以上是关于matlab中griddata函数怎么用的主要内容,如果未能解决你的问题,请参考以下文章