echart的使用心得
Posted 小吴3
tags:
篇首语:本文由小常识网(cha138.com)小编为大家整理,主要介绍了echart的使用心得相关的知识,希望对你有一定的参考价值。
前言:由于本人在最近的公司中接触了一些与数据可视化有关的项目,所以特意花了一些时间去学习了echarts,以下是我个人在使用与学习echarts的一些心得体会。
1.首先我们需要知道的是什么是Echarts?
它是一个商业级数据图表,它是一个纯javascript的图标库,兼容绝大部分的浏览器,底层依赖轻量级的canvas类库ZRender,提供直观,生动,可交互,可高度个性化定制的数据可视化图表。创新的拖拽重计算、数据视图、值域漫游等特性大大增强了用户体验,赋予了用户对数据进行挖掘、整合的能力。
2.Echarts应该如何使用呢?
2.1
<div id="main" style="width: 600px;height:400px;"></div>
var myChart = echarts.init(document.getElementById(\'main\'));
var option = {
    xAxis: {
        type: \'category\',
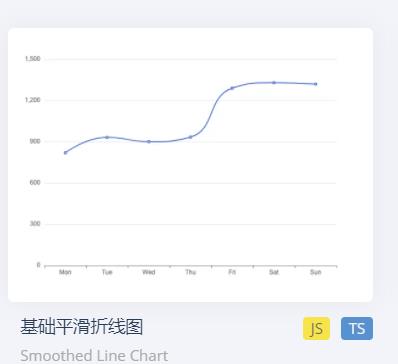
        data: [\'Mon\', \'Tue\', \'Wed\', \'Thu\', \'Fri\', \'Sat\', \'Sun\']
    },
    yAxis: {
        type: \'value\'
    },
    series: [{
        data: [820, 932, 901, 934, 1290, 1330, 1320],
        type: \'line\'
    }]
};
2.5
myChart.setOption(option);
3.看到这里可能有些小伙伴可能就有点蒙蔽了,什么xAxis,yAxis,series是啥呢?
其实在我们日常的开发主要用到以下几个属性:
-
-
系列列表。每个系列通过
type决定自己的图表类型 -
大白话:图标数据,指定什么类型的图标,可以多个图表重叠。
-
-
xAxis:直角坐标系 grid 中的 x 轴
-
boundaryGap: 坐标轴两边留白策略 true,这时候刻度只是作为分隔线,标签和数据点都会在两个刻度之间的带(band)中间。
-
-
yAxis:直角坐标系 grid 中的 y 轴
-
grid:直角坐标系内绘图网格。
-
title:标题组件
-
tooltip:提示框组件
-
legend:图例组件
-
color:调色盘颜色列表
数据堆叠,同个类目轴上系列配置相同的
stack
option = {
    // color设置我们线条的颜色 注意后面是个数组
    color: [\'pink\', \'red\', \'green\', \'skyblue\'],
    // 设置图表的标题
    title: {
        text: \'折线图堆叠123\'
    },
    // 图表的提示框组件
    tooltip: {
        // 触发方式
        trigger: \'axis\'
    },
    // 图例组件
    legend: {
       // series里面有了 name值则 legend里面的data可以删掉
    },
    // 网格配置  grid可以控制线形图 柱状图 图表大小
    grid: {
        left: \'3%\',
        right: \'4%\',
        bottom: \'3%\',
        // 是否显示刻度标签 如果是true 就显示 否则反之
        containLabel: true
    },
    // 工具箱组件  可以另存为图片等功能
    toolbox: {
        feature: {
            saveAsImage: {}
        }
    },
    // 设置x轴的相关配置
    xAxis: {
        type: \'category\',
        // 是否让我们的线条和坐标轴有缝隙
        boundaryGap: false,
        data: [\'星期一\', \'周二\', \'周三\', \'周四\', \'周五\', \'周六\', \'周日\']
    },
     // 设置y轴的相关配置
    yAxis: {
        type: \'value\'
    },
    // 系列图表配置 它决定着显示那种类型的图表
    series: [
        {
            name: \'邮件营销\',
            type: \'line\',

            data: [120, 132, 101, 134, 90, 230, 210]
        },
        {
            name: \'联盟广告\',
            type: \'line\',

            data: [220, 182, 191, 234, 290, 330, 310]
        },
        {
            name: \'视频广告\',
            type: \'line\',

            data: [150, 232, 201, 154, 190, 330, 410]
        },
        {
            name: \'直接访问\',
            type: \'line\',

            data: [320, 332, 301, 334, 390, 330, 320]
        }
    ]
};
4.有的时候我们项目需要展示的功能大部分是和echarts官网实例给的不一样,需要我们对人家的官方实例进行修改与配置我们项目需要的属性,下面我来演示一下我自己配置的时候的思路,一般的话主要分为2个步骤:
步骤1: 首先的话我们需要修改折线图大小,显示边框设置颜色:#012f4a,并且显示刻度标签。这个grid属性是设置图表大小的
// 设置网格样式
    grid: {
      top: \'20%\',
      left: \'3%\',
      right: \'4%\',
      bottom: \'3%\',
      show: true,// 显示边框
      borderColor: \'#012f4a\',// 边框颜色
      containLabel: true // 包含刻度文字在内
    },
步骤2: 修改图例组件中的文字颜色 #4c9bfd, 距离右侧 right 为 10%
 // 图例组件
    legend: {
      textStyle: {
        color: \'#4c9bfd\' // 图例文字颜色
      },
      right: \'10%\' // 距离右边10%
    },
-
刻度去除
-
x轴刻度标签字体颜色:#4c9bfd
-
剔除x坐标轴线颜色(将来使用Y轴分割线)
-
 xAxis: {
      type: \'category\',
      data: ["周一", "周二"],
	  axisTick: {
         show: false // 去除刻度线
       },
       axisLabel: {
         color: \'#4c9bfd\' // 文本颜色
       },
       axisLine: {
         show: false // 去除轴线
       },
       boundaryGap: false  // 去除轴内间距
    },
-
刻度去除
-
字体颜色:#4c9bfd
-
yAxis: {
      type: \'value\',
      axisTick: {
        show: false  // 去除刻度
      },
      axisLabel: {
        color: \'#4c9bfd\' // 文字颜色
      },
      splitLine: {
        lineStyle: {
          color: \'#012f4a\' // 分割线颜色
        }
      }
    },
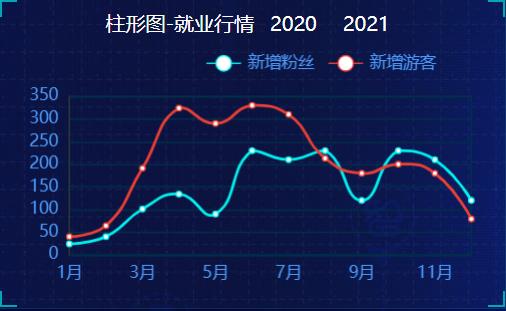
需求5: 两条线形图定制
- 颜色分别:#00f2f1 #ed3f35
- 把折线修饰为圆滑 series 数据中添加 smooth 为 true
color: [\'#00f2f1\', \'#ed3f35\'],
    series: [{
      name:\'新增粉丝\',
      data: [820, 932, 901, 934, 1290, 1330, 1320],
      type: \'line\',
      // 折线修饰为圆滑
      smooth: true,
      },{
      name:\'新增游客\',
      data: [100, 331, 200, 123, 233, 543, 400],
      type: \'line\',
      smooth: true,
    }]
步骤6: 配置数据,把data里面的数据替换为我们自己项目的数据(一般都是通过后端接口请求的数据)
// x轴的文字
xAxis: {
  type: \'category\',
  data: [\'1月\', \'2月\', \'3月\', \'4月\', \'5月\', \'6月\', \'7月\', \'8月\', \'9月\', \'10月\', \'11月\', \'12月\'],
// 图标数据
    series: [{
      name:\'新增粉丝\',
      data:  [24, 40, 101, 134, 90, 230, 210, 230, 120, 230, 210, 120],
      type: \'line\',
      smooth: true
    },{
      name:\'新增游客\',
      data: [40, 64, 191, 324, 290, 330, 310, 213, 180, 200, 180, 79],
      type: \'line\',
      smooth: true
      }
    }]
步骤7:如果需要大小屏幕适配的话,可以加一下这行代码
// 监听浏览器缩放,图表对象调用缩放resize函数
  window.addEventListener("resize", function() {
    myChart.resize();
  });
完整代码:
// 折线图1模块制作
(function() {
  var yearData = [
    {
      year: "2020", // 年份
      data: [
        // 两个数组是因为有两条线
        [24, 40, 101, 134, 90, 230, 210, 230, 120, 230, 210, 120],
        [40, 64, 191, 324, 290, 330, 310, 213, 180, 200, 180, 79]
      ]
    },
    {
      year: "2021", // 年份
      data: [
        // 两个数组是因为有两条线
        [123, 175, 112, 197, 121, 67, 98, 21, 43, 64, 76, 38],
        [143, 131, 165, 123, 178, 21, 82, 64, 43, 60, 19, 34]
      ]
    }
  ];
  // 1. 实例化对象
  var myChart = echarts.init(document.querySelector(".line .chart"));
  // 2.指定配置
  var option = {
    // 通过这个color修改两条线的颜色
    color: ["#00f2f1", "#ed3f35"],
    tooltip: {
      trigger: "axis"
    },
    legend: {
      // 如果series 对象有name 值,则 legend可以不用写data
      // 修改图例组件 文字颜色
      textStyle: {
        color: "#4c9bfd"
      },
      // 这个10% 必须加引号
      right: "10%"
    },
    grid: {
      top: "20%",
      left: "3%",
      right: "4%",
      bottom: "3%",
      show: true, // 显示边框
      borderColor: "#012f4a", // 边框颜色
      containLabel: true // 包含刻度文字在内
    },

    xAxis: {
      type: "category",
      boundaryGap: false,
      data: [
        "1月",
        "2月",
        "3月",
        "4月",
        "5月",
        "6月",
        "7月",
        "8月",
        "9月",
        "10月",
        "11月",
        "12月"
      ],
      axisTick: {
        show: false // 去除刻度线
      },
      axisLabel: {
        color: "#4c9bfd" // 文本颜色
      },
      axisLine: {
        show: false // 去除轴线
      }
    },
    yAxis: {
      type: "value",
      axisTick: {
        show: false // 去除刻度线
      },
      axisLabel: {
        color: "#4c9bfd" // 文本颜色
      },
      axisLine: {
        show: false // 去除轴线
      },
      splitLine: {
        lineStyle: {
          color: "#012f4a" // 分割线颜色
        }
      }
    },
    series: [
      {
        name: "新增粉丝",
        type: "line",
        // true 可以让我们的折线显示带有弧度
        smooth: true,
        data: yearData[0].data[0]
      },
      {
        name: "新增游客",
        type: "line",
        smooth: true,
        data: yearData[0].data[1]
      }
    ]
  };

  // 3. 把配置给实例对象
  myChart.setOption(option);
  // 4. 让图表跟随屏幕自动的去适应
  window.addEventListener("resize", function() {
    myChart.resize();
  });

  // 5.点击切换效果
  $(".line h2").on("click", "a", function() {
    // alert(1);
    // console.log($(this).index());
    // 点击 a 之后 根据当前a的索引号 找到对应的 yearData的相关对象
    // console.log(yearData[$(this).index()]);
    var obj = yearData[$(this).index()];
    option.series[0].data = obj.data[0];
    option.series[1].data = obj.data[1];
    // 需要重新渲染
    myChart.setOption(option);
  });
})();
参考视频:https://www.bilibili.com/video/BV1v7411R7mp?p=53&share_source=copy_web
以上为本人学习总结的心得,希望对各位有所帮助!如果哪里有错误,还请各位大佬指正哈!
Echarts百度Echarts的使用入门+两个简单的小例子+心得
Echarts对于展示结果,有一个很好的表达方式。
1.首先,在官网将js下载到本地,引用到页面上
这里是在开发环境,所以下载最后源代码这个


managerResult.jsp

 1 <%@ page language="java" contentType="text/html; charset=utf-8"
 2     pageEncoding="utf-8"%>
 3 <!DOCTYPE html>
 4 <html  lang="en">
 5     <head>
 6         <meta charset="utf-8">
 7         <meta http-equiv="X-UA-Compatible" content="IE=edge,chrome=1">
 8         <meta name="format-detection" content="telephone=no" />
 9         <meta name="apple-mobile-web-app-capable" content="yes" />
10         <meta name="viewport" content="width=device-width,initial-scale=1, minimum-scale=1, maximum-scale=1, user-scalable=no" />
11         <meta name="description" content="">
12         <meta name="keywords" content="">
13         <title>Echarts图表统计结果</title>
14         <link rel="stylesheet" type="text/css" href="../quest/css/bootstrap.min.css"/>
15     </head>
16     <body>
17         <div class="container">
18             <div class="row">
19                 <input type="hidden"  name=\'allNum\'  value="${allNum}"/>
20                 <input type="hidden"  name=\'listNum\' value="${listNum}"/>
21                 <textarea  style="display: none;" name="condition">${condition}</textarea>
22                 <textarea  style="display: none;" name="questOptions">${questOptions}</textarea>
23                 <div id="mainPie" style="width: 800px;height:400px;"></div>
24                 <div id="mainBar" style="width: 1000px;height:600px;"></div>
25             </div>
26         </div>
27     </body>
28     <script type="text/javascript" src="/resources/bootstrap-3.3.5-dist/js/jquery-1.10.2.min.js"></script>
29     <script type="text/javascript" src="/resources/bootstrap-3.3.5-dist/js/bootstrap.min.js"></script>
30     <script type="text/javascript" src= "../quest/js/echarts.js"></script>
31     <script type="text/javascript" src= "../quest/js/managerResult.js"></script>
32 </html>
页面中分别为 柱状图和 饼状图 放置了两个div作为容器
2.managerResult.js
步骤就3步
1》var myChartBar = echarts.init(document.getElementById(\'mainBar\')); 获取容器
2》配置option
3》myChartBar.setOption(optionBar); 初始化图表进行展示

  1 $(document).ready(function(){
  2       //获取饼状图容器 并 初始化echarts实例
  3     var myChartPie = echarts.init(document.getElementById(\'mainPie\'));
  4
  5
  6     //饼状图 配置
  7     var optionPie = {
  8             title : {//标题
  9                 text: \'问卷统计调查结果\',
 10                 subtext: \'多条件组合\',
 11                 x:\'center\'
 12             },
 13             tooltip : {//光标在上显示信息
 14                 trigger: \'item\',
 15                 formatter: "{a} <br/>{b} : {c} ({d}%)",
 16                 backgroundColor : \'#986c11\',
 17             },
 18             toolbox: {//工具按钮
 19                 show : true,
 20                 feature : {
 21                     mark : {show: true},
 22                     dataView : {show: true, readOnly: false},
 23                     magicType : {
 24                         show: true,
 25                         type: [\'pie\', \'funnel\']
 26                     },
 27                     restore : {show: true},
 28                     saveAsImage : {show: true}
 29                 }
 30             },
 31             legend: {//图例
 32                 orient: \'vertical\',
 33                 left: \'left\' ,
 34                 data: [\'统计项\',\'未统计项\']
 35             },
 36             series : [//系列列表  图表类型+数据源
 37                 {
 38                     name: \'问卷统计\',
 39                     type: \'pie\',
 40                     radius : \'55%\',
 41                     center: [\'50%\', \'60%\'],
 42                     data:[
 43                         {value:335, name:\'统计项\'},
 44                         {value:310, name:\'未统计项\'}
 45                     ],
 46                     itemStyle: {
 47                         emphasis: {
 48                             shadowBlur: 100,
 49                             shadowOffsetX: 10,
 50                             shadowColor: \'rgba(0, 0, 0, 0.5)\'
 51                         }
 52                     },
 53                     label: {
 54                         normal: {
 55                             show: true,
 56                             position: \'outside\',
 57                             formatter :\'{a}\\n{b} : {c} ({d}%)\',
 58                             textStyle:{
 59                                 fontSize : 2,
 60                                 fontStyle : \'normal\'
 61                             }
 62                         },
 63                     }
 64
 65                 }
 66             ]
 67         };
 68
 69
 70     // 使用刚指定的配置项和数据显示图表。
 71     myChartPie.setOption(optionPie);
 72
 73
 74
 75     //获取饼状图容器 并 初始化echarts实例
 76     var myChartBar = echarts.init(document.getElementById(\'mainBar\'));
 77
 78         //柱状图配置
 79         var optionBar = {
 80                 title:{
 81                     show : true,
 82                     text : \'多条件分量统计\',
 83                     x:\'center\'
 84                 },
 85                 color: [\'#3398DB\'],
 86                 tooltip : {
 87                     trigger: \'axis\',
 88                     axisPointer : {            // 坐标轴指示器,坐标轴触发有效
 89                         type : \'shadow\'        // 默认为直线,可选为:\'line\' | \'shadow\'
 90                     }
 91                 },
 92                  toolbox: {
 93                     show : true,
 94                     feature : {
 95                         dataView : {show: true, readOnly: false},
 96                         magicType : {show: true, type: [\'line\', \'bar\']},
 97                         restore : {show: true},
 98                         saveAsImage : {show: true}
 99                     }
100                 },
101                 grid: {//网格配置
102                     show : true,
103                     left: \'3%\',
104                     right: \'15%\',
105                     bottom: \'3%\',
106                     shadowBlur : 10,
107                     containLabel: true
108                 },
109                 xAxis : [
110                     {
111                         name : \'筛选条件类目\',
112                         type : \'category\',
113                         data : [
114                             {
115                                 value: \'周一\',
116                                 textStyle: {
117                                     fontSize: 4,
118                                     baseline : \'middle\',
119                                 }
120                             }, \'Tue\', \'Wed\', \'Thu\', \'Fri\', \'Sat\', \'Sun\'],
121                         axisTick: {
122                             alignWithLabel: true
123                         },
124                         axisLabel :{
125                             rotate : 50
126                         }
127
128                     }
129                 ],
130                 yAxis : [
131                     {
132                         name : \'统计人数\',
133                         type : \'value\'
134                     }
135                 ],
136                 series : [
137                     {
138                         name:\'问卷人数\',
139                         type:\'bar\',
140                         barWidth: \'30%\',
141                         label: {
142                             normal: {
143                                 show: true,
144                                 position: \'top\',
145                                 formatter :\'{b} : {c}\',
146                                 textStyle:{
147                                     fontSize : 2,
148                                     fontStyle : \'normal\'
149                                 }
150                             }
151                         },
152                         data:[10, 52, 200, 334, 390, 330, 220]
153                     }
154                 ]
155             };
156
157
158         myChartBar.setOption(optionBar);
159
160
161
162
163 });
**********************************************************************如果想动态从后台获取数据的话,往下看***************************************************************
***********************************************************************************************************************************************************************************
先看看js中,ajax从后台获取的数据,赋值给图表的data即可
4》带有ajax的Echarts 实例化过程

 1  var condition = $("textarea[name=\'condition\']").text();
 2     var questOptions = $("textarea[name=\'questOptions\']").text();
 3     //全局变量,便于给图表赋值
 4     var XData;//X轴类目
 5     var VData;//实际数据
 6
 7     //ajax从后台获取数据给全局变量
 8     $.ajax({url:"/questionnaire/barDate.jhtml",
 9         type:"get",
10         async:false,
11         traditional:false,
12         data:{questOptions:questOptions,condition:condition},
13         success:function(data){
14             //后台拼接组装好的json数据传给前台这里,直接转化一下根据键名获取键值,赋值给全局变量
15             XData = JSON.parse(data).X;
16             VData = JSON.parse(data).V;
17         }
18     });
19
20     //获取饼状图容器 并 初始化echarts实例
21     var myChartBar = echarts.init(document.getElementById(\'mainBar\'));
22
23         //柱状图配置
24         var optionBar = {
25                 title:{
26                     show : true,
27                     text : \'多条件分量统计\',
28                     x:\'center\'
29                 },
30                 color: [\'#3398DB\'],
31                 tooltip : {
32                     trigger: \'axis\',
33                     axisPointer : {            // 坐标轴指示器,坐标轴触发有效
34                         type : \'shadow\'        // 默认为直线,可选为:\'line\' | \'shadow\'
35                     }
36                 },
37                  toolbox: {
38                     show : true,
39                     feature : {
40                         dataView : {show: true, readOnly: false},
41                         magicType : {show: true, type: [\'line\', \'bar\']},
42                         restore : {show: true},
43                         saveAsImage : {show: true}
44                     }
45                 },
46                 grid: {//网格配置
47                     show : true,
48                     left: \'3%\',
49                     right: \'15%\',
50                     bottom: \'15%\',
51                     shadowBlur : 10,
52                     containLabel: true
53                 },
54                 xAxis : [
55                     {
56                         name : \'筛选条件类目\',
57                         type : \'category\',
58                         data : XData,
59                         axisTick: {
60                             alignWithLabel: true
61                         },
62                         axisLabel :{
63                             rotate : 50
64                         }
65
66                     }
67                 ],
68                 yAxis : [
69                     {
70                         name : \'统计人数\',
71                         type : \'value\'
72                     }
73                 ],
74                 series : [
75                     {
76                         name:\'问卷人数\',
77                         type:\'bar\',
78                         barWidth: \'30%\',
79                         label: {
80                             normal: {
81                                 show: true,
82                                 position: \'top\',
83                                 formatter :\'{b} : {c}\',
84                                 textStyle:{
85                                     fontSize : 2,
86                                     fontStyle : \'normal\'
87                                 }
88                             }
89                         },
90                         data:VData
91                     }
92                 ]
93             };
94
95
96         myChartBar.setOption(optionBar);
5》后台部分代码【只看json数据 组装部分】

1 @RequestMapping(value= "/barDate" ,produces = "text/html;charset=UTF-8") 2 @ResponseBody 3 public String barDate(HttpServletRequest request,String condition,String questOptions) throws UnsupportedEncodingException{ 4 5 //勾选项 6 questOptions = questOptions.replaceAll("category=", ""); 7 String [] questArr = questOptions.equals("")? new String[0]:questOptions.split(";"); 8 //填空题 9 Map<String,Object> mapList = doMap(condition); 10 System.out.println("勾选项:"+questArr); 11 12 13 JSONObject jsonObject = new JSONObject(); 14 JSONArray array1 = new JSONArray(); 15 JSONArray array2 = new JSONArray(); 16 Map<String,Object> newList = new HashMap<String, Object>(); 17 //填空题 18 mapList.forEach((key,value)->{ 19 boolean flag = false; 20 if(value != null){ 21 if(key.contains("Arr")){ 22 String newKey = key.substring(0,key.lastIndexOf("Arr")); 23 if(key.contains("age")){ 24 Date[] date = (Date[]) value; 25 if(date[0] != null && date[1] != null){ 26 array1.add("年龄段:"+date[0]+"-"+date[1]); 27 flag = true; 28 }else if(date[0] != null || date[1] != null){ 29 array1.add("年龄:"+date[0] == null ? date[1] : date[0]); 30 flag = true; 31 } 32 }else{ 33 Double [] v = (Double[]) value; 34 if(v[0] != null && v[1] != null){ 35 array1.add(newKey+"段:"+v[0]+"-"+v[1]); 36 flag = true; 37 }else if(v[0] != null || v[1] != null){ 38 array1.add(newKey+":"+v[0] == null ? v[1] : v[0]); 39 flag = true; 40 } 41 } 42 } 43 if(key.contains("userName")){ 44 array1.add("姓名:"+value); 45 flag = true; 46 } 47 if(key.contains("sex")){ 48 array1.add("性别:"+value); 49 flag = true; 50 } 51 if(key.contains("memopause")){ 52 array1.add("是否绝经:"+value); 53 flag = true; 54 } 55 56 if(flag){ 57 newList.put(key, value); 58 List<Questionnaire> list = questionnaireService.findQuests(newList, new String[0]); 59 newList.clear(); 60 array2.add(list.size()); 61 flag = false; 62 } 63 64 } 65 }); 66 //获取资源文件中键值对 67 ResourceBundle bundle = ResourceBundle.getBundle("quest"); 68 69 if(questArr.length >0){ 70 for (String string : questArr) { 71


