CNN基础——激活函数
Posted AI浩
tags:
篇首语:本文由小常识网(cha138.com)小编为大家整理,主要介绍了CNN基础——激活函数相关的知识,希望对你有一定的参考价值。
目录
1、什么是激活函数
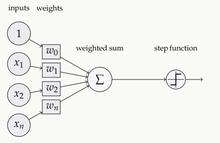
激活函数(Activation functions)对于人工神经网络 模型去学习、理解非常复杂和非线性的函数来说具有十分重要的作用。它们将非线性特性引入到我们的网络中。如下图,在神经元中,输入的 inputs 通过加权,求和后,还被作用了一个函数,这个函数就是激活函数。引入激活函数是为了增加神经网络模型的非线性。没有激活函数的每层都相当于矩阵相乘。就算你叠加了若干层之后,无非还是个矩阵相乘罢了。
2、为什么要使用激活函数?
- 激活函数对模型学习、理解非常复杂和非线性的函数具有重要作用。
- 激活函数可以引入非线性因素。如果不使用激活函数,则输出信号仅是一个简单的线性函数。线性函数一个一级多项式,线性方程的复杂度有限,从数据中学习复杂函数映射的能力很小。没有激活函数,神经网络将无法学习和模拟其他复杂类型的数据,例如图像、视频、音频、语音等。
- 激活函数可以把当前特征空间通过一定的线性映射转换到另一个空间,让数据能够更好的被分类。
3、为什么激活函数需要非线性函数?
- 假若网络中全部是线性部件,那么线性的组合还是线性,与单独一个线性分类器无异。这样就做不到用非线性来逼近任意函数。
- 使用非线性激活函数 ,以便使网络更加强大,增加它的能力,使它可以学习复杂的事物,复杂的表单数据,以及表示输入输出之间非线性的复杂的任意函数映射。使用非线性激活函数,能够从输入输出之间生成非线性映射。
4、常用的激活函数
-
sigmoid 激活函数
函数的定义为:

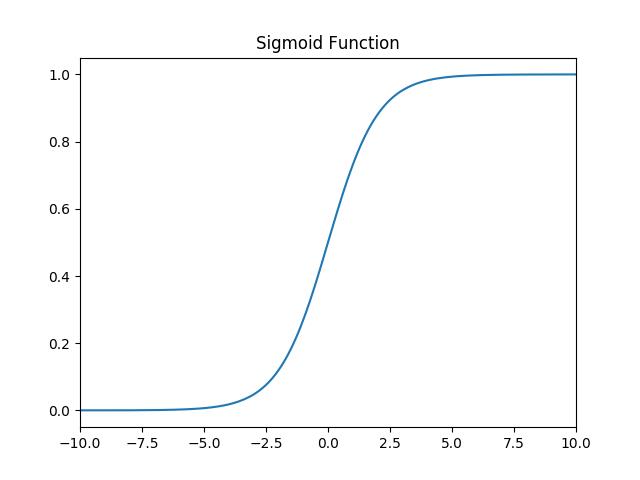
其值域为 (0,1) 。函数图像如下:
特点:
它能够把输入的连续实值变换为0和1之间的输出,特别的,如果是非常大的负数,那么输出就是0;如果是非常大的正数,输出就是1.
缺点:
sigmoid函数曾经被使用的很多,不过近年来,用它的人越来越少了。主要是因为它固有的一些 缺点。
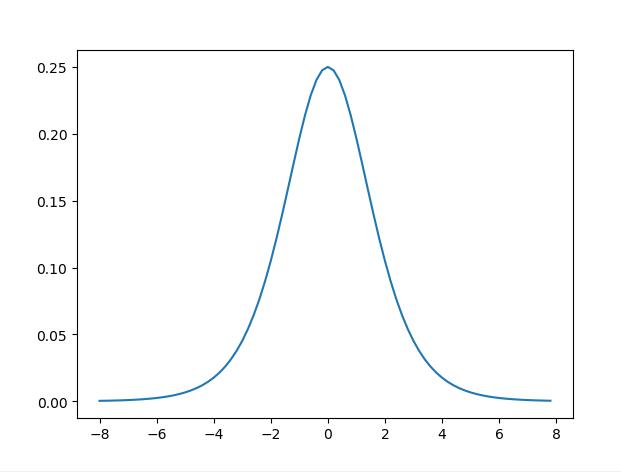
缺点1:在深度神经网络中梯度反向传递时导致梯度爆炸和梯度消失,其中梯度爆炸发生的概率非常小,而梯度消失发生的概率比较大。首先来看Sigmoid函数的导数,如下图所示:
缺点2:不是以0为对称轴(这点在tahn函数有所改善)
sigmoid函数及其导数的实现
import numpy as np
import matplotlib.pyplot as plt

#解决中文显示问题
plt.rcParams['font.sans-serif']=['SimHei']
plt.rcParams['axes.unicode_minus'] = False
def d_sigmoid(x):
    y = 1 / (1 + np.exp(-x))
    dy=y*(1-y)
    return dy

def sigmoid(x):
    y = 1 / (1 + np.exp(-x))
    return y

def plot_sigmoid():
    # param:起点,终点,间距
    x = np.arange(-8, 8, 0.2)
    plt.subplot(1, 2, 1)
    plt.title('sigmoid')  # 第一幅图片标题
    y = sigmoid(x)
    plt.plot(x, y)
    plt.subplot(1, 2, 2)
    y = d_sigmoid(x)
    plt.plot(x, y)
    plt.title('sigmoid导数')
    plt.show()


if __name__ == '__main__':
    plot_sigmoid()
-
tanh激活函数
函数的定义为:

其值域为 (-1,1) 。函数图像如下:

导数:
![]() 函数图像如下:
函数图像如下:
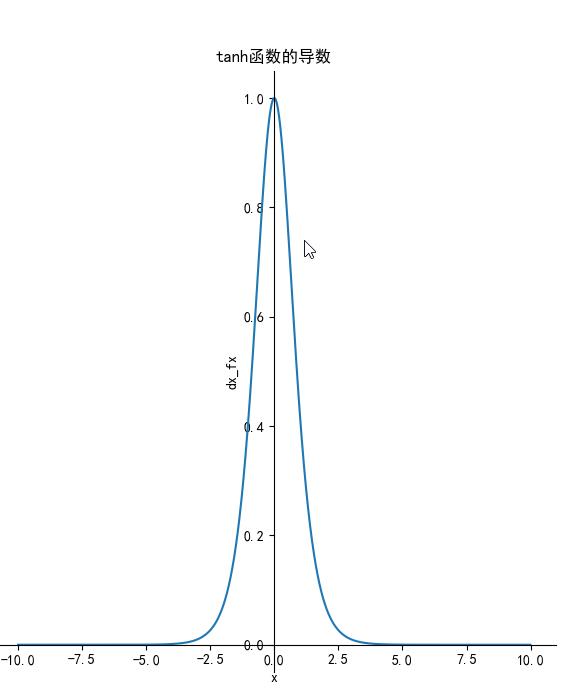
tanh读作Hyperbolic Tangent,它解决了Sigmoid函数的不是zero-centered输出问题,然而,梯度消失(gradient vanishing)的问题和幂运算的问题仍然存在。
优点和缺点
- 优点:
- 解决了Sigmoid的输出不关于零点对称的问题
- 也具有Sigmoid的优点平滑,容易求导
- 缺点:
- 激活函数运算量大(包含幂的运算
- Tanh的导数图像虽然最大之变大,使得梯度消失的问题得到一定的缓解,但是不能根本解决这个问题
tanh函数及其代码实现:
from matplotlib import pyplot as plt
import numpy as np

# 解决中文显示问题
plt.rcParams['font.sans-serif'] = ['SimHei']
plt.rcParams['axes.unicode_minus'] = False
def tanh(x):
    """tanh函数"""
    return ((np.exp(x) - np.exp(-x)) / (np.exp(x) + np.exp(-x)))

def dx_tanh(x):
    """tanh函数的导数"""
    return 1 - tanh(x) * tanh(x)


if __name__ == '__main__':
    x = np.arange(-10, 10, 0.01)
    fx = tanh(x)
    dx_fx = dx_tanh(x)
    plt.subplot(1, 2, 1)
    ax = plt.gca()  # 得到图像的Axes对象
    ax.spines['right'].set_color('none')  # 将图像右边的轴设为透明
    ax.spines['top'].set_color('none')  # 将图像上面的轴设为透明
    ax.xaxis.set_ticks_position('bottom')  # 将x轴刻度设在下面的坐标轴上
    ax.yaxis.set_ticks_position('left')  # 将y轴刻度设在左边的坐标轴上
    ax.spines['bottom'].set_position(('data', 0))  # 将两个坐标轴的位置设在数据点原点
    ax.spines['left'].set_position(('data', 0))
    plt.title('tanh 函数')
    plt.xlabel('x')
    plt.ylabel('fx')
    plt.plot(x, fx)
    plt.subplot(1, 2, 2)
    ax = plt.gca()  # 得到图像的Axes对象
    ax.spines['right'].set_color('none')  # 将图像右边的轴设为透明
    ax.spines['top'].set_color('none')  # 将图像上面的轴设为透明
    ax.xaxis.set_ticks_position('bottom')  # 将x轴刻度设在下面的坐标轴上
    ax.yaxis.set_ticks_position('left')  # 将y轴刻度设在左边的坐标轴上
    ax.spines['bottom'].set_position(('data', 0))  # 将两个坐标轴的位置设在数据点原点
    ax.spines['left'].set_position(('data', 0))
    plt.title('tanh函数的导数')
    plt.xlabel('x')
    plt.ylabel('dx_fx')
    plt.plot(x, dx_fx)
    plt.show()
-
Relu激活函数
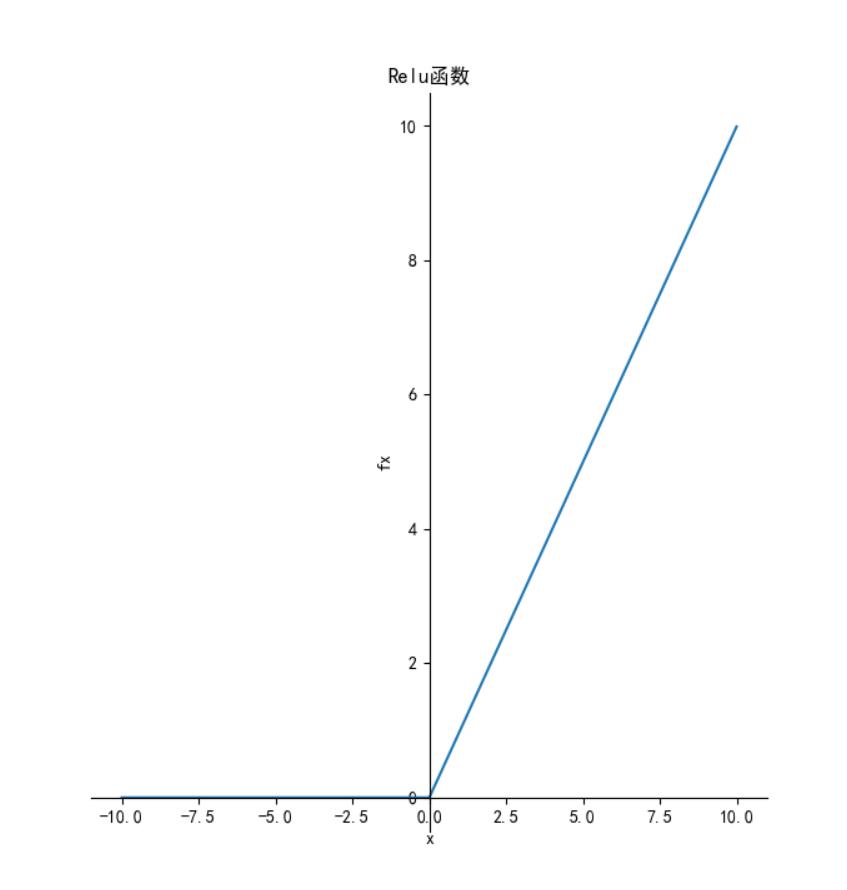
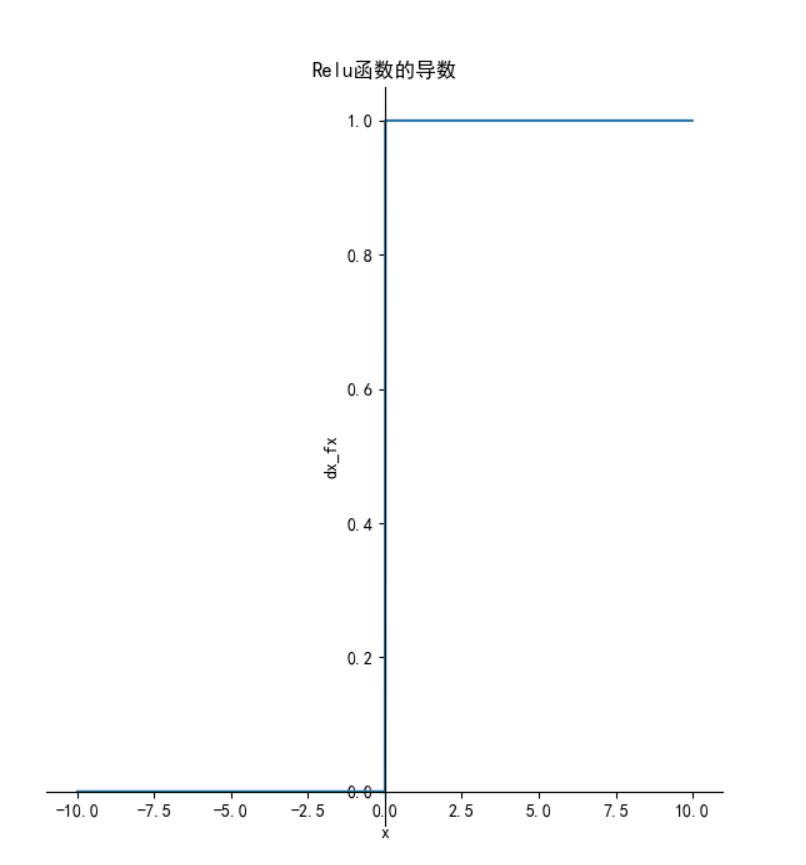
它保留了 step 函数的生物学启发(只有输入超出阈值时神经元才激活),不过当输入为正的时候,导数不为零,从而允许基于梯度的学习(尽管在 x=0 的时候,导数是未定义的)。使用这个函数能使计算变得很快,因为无论是函数还是其导数都不包含复杂的数学运算。然而,当输入为负值的时候,ReLU 的学习速度可能会变得很慢,甚至使神经元直接无效,因为此时输入小于零而梯度为零,从而其权重无法得到更新,在剩下的训练过程中会一直保持静默。函数的定义为:f(x)=max(0,x),值阈[0, ] 。函数图像如下:
导数:

函数图像如下:
优点:
1.相比起Sigmoid和tanh,ReLU在SGD中能够快速收敛,这是因为它线性(linear)、非饱和(non-saturating)的形式。
2.Sigmoid和tanh涉及了很多很expensive的操作(比如指数),ReLU可以更加简单的实现。
3.有效缓解了梯度消失的问题。
4.在没有无监督预训练的时候也能有较好的表现。
缺点:
- ReLU的输出不是zero-centered
- Dead ReLU Problem,指的是某些神经元可能永远不会被激活,导致相应的参数永远不能被更新。有两个主要原因可能导致这种情况产生: (1) 非常不幸的参数初始化,这种情况比较少见 (2) learning rate太高导致在训练过程中参数更新太大,不幸使网络进入这种状态。解决方法是可以采用Xavier初始化方法,以及避免将learning rate设置太大或使用adagrad等自动调节learning rate的算法。
尽管存在这两个问题,ReLU目前仍是最常用的activation function,在搭建人工神经网络的时候推荐优先尝试!
函数及导数代码:
from matplotlib import pyplot as plt
import numpy as np

# 解决中文显示问题
plt.rcParams['font.sans-serif'] = ['SimHei']
plt.rcParams['axes.unicode_minus'] = False
def relu(x):
    """relu函数"""
    # temp = np.zeros_like(x)
    # if_bigger_zero = (x > temp)
    # return x * if_bigger_zero
    return np.where(x<0,0,x)

def dx_relu(x):
    """relu函数的导数"""
    # temp = np.zeros_like(x)
    # if_bigger_equal_zero = (x >= temp)
    # return if_bigger_equal_zero * np.ones_like(x)
    return np.where(x < 0, 0, 1)
# ---------------------------------------------

if __name__ == '__main__':
    x = np.arange(-10, 10, 0.01)
    fx = relu(x)
    dx_fx = dx_relu(x)
    plt.subplot(1, 2, 1)
    ax = plt.gca()  # 得到图像的Axes对象
    ax.spines['right'].set_color('none')  # 将图像右边的轴设为透明
    ax.spines['top'].set_color('none')  # 将图像上面的轴设为透明
    ax.xaxis.set_ticks_position('bottom')  # 将x轴刻度设在下面的坐标轴上
    ax.yaxis.set_ticks_position('left')  # 将y轴刻度设在左边的坐标轴上
    ax.spines['bottom'].set_position(('data', 0))  # 将两个坐标轴的位置设在数据点原点
    ax.spines['left'].set_position(('data', 0))
    plt.title('Relu函数')
    plt.xlabel('x')
    plt.ylabel('fx')
    plt.plot(x, fx)
    plt.subplot(1, 2, 2)
    ax = plt.gca()  # 得到图像的Axes对象
    ax.spines['right'].set_color('none')  # 将图像右边的轴设为透明
    ax.spines['top'].set_color('none')  # 将图像上面的轴设为透明
    ax.xaxis.set_ticks_position('bottom')  # 将x轴刻度设在下面的坐标轴上
    ax.yaxis.set_ticks_position('left')  # 将y轴刻度设在左边的坐标轴上
    ax.spines['bottom'].set_position(('data', 0))  # 将两个坐标轴的位置设在数据点原点
    ax.spines['left'].set_position(('data', 0))
    plt.title('Relu函数的导数')
    plt.xlabel('x')
    plt.ylabel('dx_fx')
    plt.plot(x, dx_fx)
    plt.show()
-
Leaky ReLU函数(PReLU)
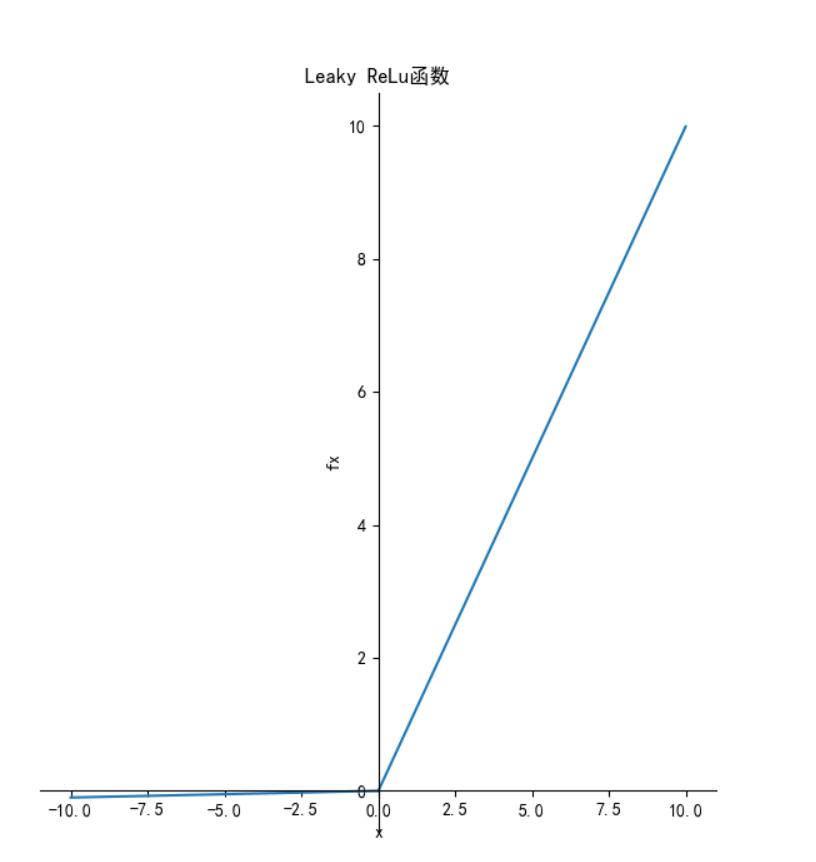
函数的定义为: 。函数图像如下:
导数:

函数图像如下:
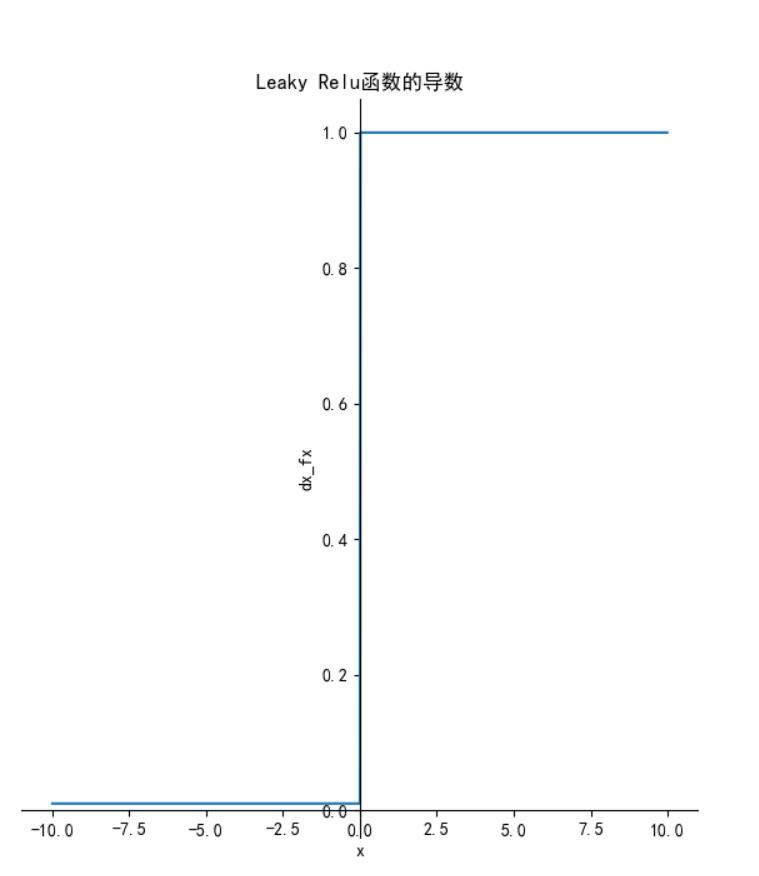
特点:与 ReLu 相比 ,leak 给所有负值赋予一个非零斜率, leak是一个很小的常数  ,这样保留了一些负轴的值,使得负轴的信息不会全部丢失。
函数及导数代码:
from matplotlib import pyplot as plt
import numpy as np

# 解决中文显示问题
plt.rcParams['font.sans-serif'] = ['SimHei']
plt.rcParams['axes.unicode_minus'] = False
def leaky_relu(x):
    """leaky relu函数"""
    return np.where(x<0,0.01*x,x)

def dx_leaky_relu(x):
    """leaky relu函数的导数"""
    return np.where(x < 0, 0.01, 1)

# ---------------------------------------------

if __name__ == '__main__':
    x = np.arange(-10, 10, 0.01)
    fx = leaky_relu(x)
    dx_fx = dx_leaky_relu(x)
    plt.subplot(1, 2, 1)
    ax = plt.gca()  # 得到图像的Axes对象
    ax.spines['right'].set_color('none')  # 将图像右边的轴设为透明
    ax.spines['top'].set_color('none')  # 将图像上面的轴设为透明
    ax.xaxis.set_ticks_position('bottom')  # 将x轴刻度设在下面的坐标轴上
    ax.yaxis.set_ticks_position('left')  # 将y轴刻度设在左边的坐标轴上
    ax.spines['bottom'].set_position(('data', 0))  # 将两个坐标轴的位置设在数据点原点
    ax.spines['left'].set_position(('data', 0))
    plt.title('Leaky ReLu函数')
    plt.xlabel('x')
    plt.ylabel('fx')
    plt.plot(x, fx)
    plt.subplot(1, 2, 2)
    ax = plt.gca()  # 得到图像的Axes对象
    ax.spines['right'].set_color('none')  # 将图像右边的轴设为透明
    ax.spines['top'].set_color('none')  # 将图像上面的轴设为透明
    ax.xaxis.set_ticks_position('bottom')  # 将x轴刻度设在下面的坐标轴上
    ax.yaxis.set_ticks_position('left')  # 将y轴刻度设在左边的坐标轴上
    ax.spines['bottom'].set_position(('data', 0))  # 将两个坐标轴的位置设在数据点原点
    ax.spines['left'].set_position(('data', 0))
    plt.title('Leaky Relu函数的导数')
    plt.xlabel('x')
    plt.ylabel('dx_fx')
    plt.plot(x, dx_fx)
    plt.show()
与Leaky ReLU相似的还有PReLU和RReLU,下图是他们的比较:

PReLU中的ai是根据数据变化的;
Leaky ReLU中的ai是固定的;
RReLU中的aji是一个在一个给定的范围内随机抽取的值,这个值在测试环节就会固定下来。
-
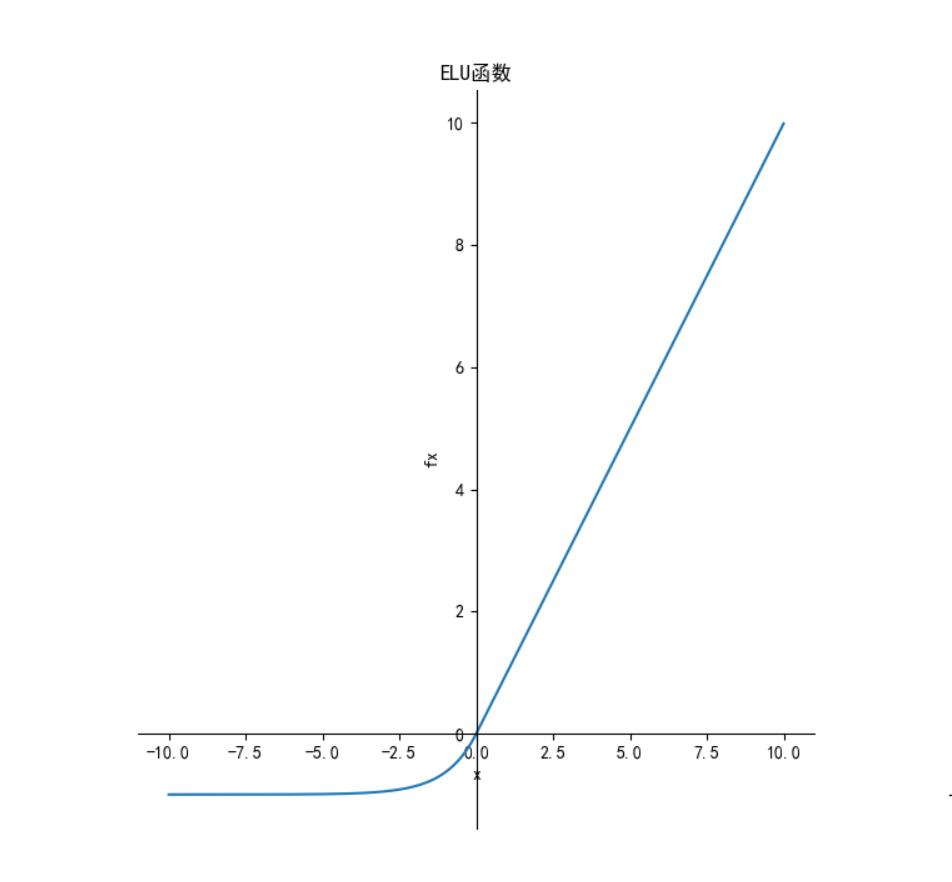
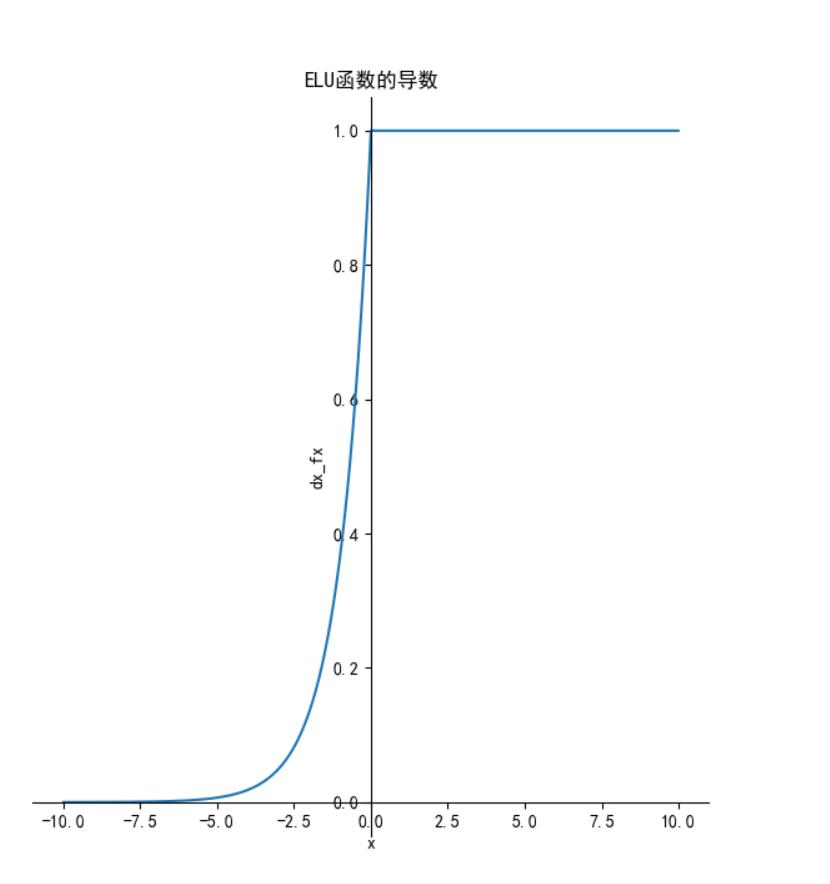
ELU激活函数
函数定义:

函数图像如下:
导数:

函数图像如下:
特点:
- 融合了sigmoid和ReLU,左侧具有软饱和性,右侧无饱和性。
- 右侧线性部分使得ELU能够缓解梯度消失,而左侧软饱能够让ELU对输入变化或噪声更鲁棒。
- ELU的输出均值接近于零,所以收敛速度更快。
- 在 ImageNet上,不加 Batch Normalization 30 层以上的 ReLU 网络会无法收敛,PReLU网络在MSRA的Fan-in (caffe )初始化下会发散,而 ELU 网络在Fan-in/Fan-out下都能收敛。
函数及导数代码:
from matplotlib import pyplot as plt
import numpy as np

# 解决中文显示问题
plt.rcParams['font.sans-serif'] = ['SimHei']
plt.rcParams['axes.unicode_minus'] = False
def ELU(x):
    """ELU函数"""
    return np.where(x<0,np.exp(x)-1,x)

def dx_ELU(x):
    """ELU函数的导数"""
    return np.where(x < 0, np.exp(x), 1)


# ---------------------------------------------

if __name__ == '__main__':
    x = np.arange(-10, 10, 0.01)
    fx = ELU(x)
    dx_fx = dx_ELU(x)
    plt.subplot(1, 2, 1)
    ax = plt.gca()  # 得到图像的Axes对象
    ax.spines['right'].set_color('none')  # 将图像右边的轴设为透明
    ax.spines['top'].set_color('none')  # 将图像上面的轴设为透明
    ax.xaxis.set_ticks_position('bottom')  # 将x轴刻度设在下面的坐标轴上
    ax.yaxis.set_ticks_position('left')  # 将y轴刻度设在左边的坐标轴上
    ax.spines['bottom'].set_position(('data', 0))  # 将两个坐标轴的位置设在数据点原点
    ax.spines['left'].set_position(('data', 0))
    plt.title('ELU函数')
    plt.xlabel('x')
    plt.ylabel('fx')
    plt.plot(x, fx)
    plt.subplot(1, 2, 2)
    ax = plt.gca()  # 得到图像的Axes对象
    ax.spines['right'].set_color('none')  # 将图像右边的轴设为透明
    ax.spines['top'].set_color('none')  # 将图像上面的轴设为透明
    ax.xaxis.set_ticks_position('bottom')  # 将x轴刻度设在下面的坐标轴上
    ax.yaxis.set_ticks_position('left')  # 将y轴刻度设在左边的坐标轴上
    ax.spines['bottom'].set_position(('data', 0))  # 将两个坐标轴的位置设在数据点原点
    ax.spines['left'].set_position(('data', 0))
    plt.title('ELU函数的导数')
    plt.xlabel('x')
    plt.ylabel('dx_fx')
    plt.plot(x, dx_fx)
    plt.show()
-
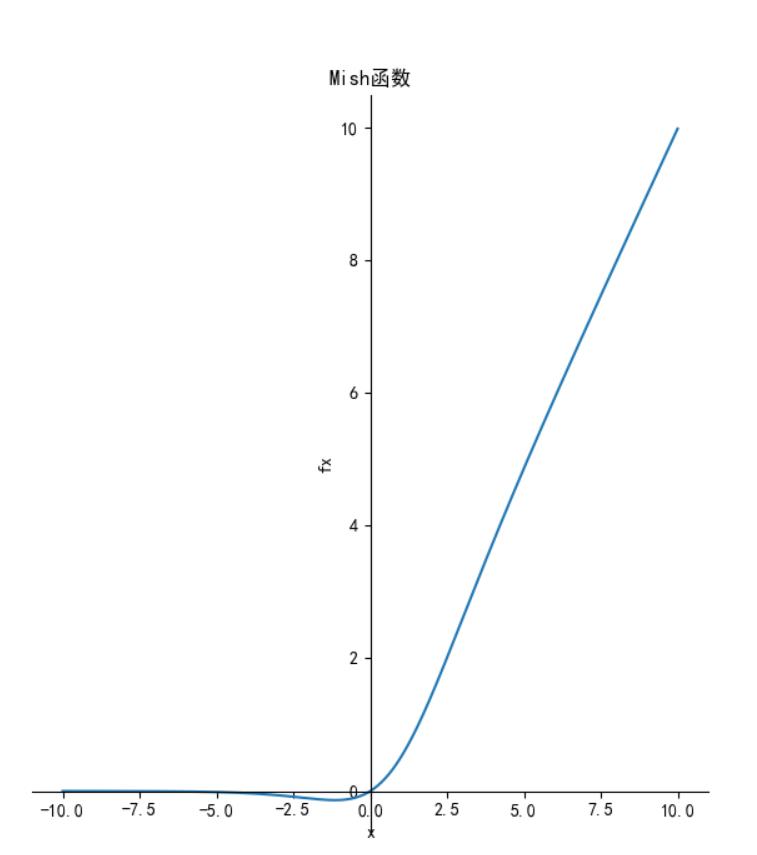
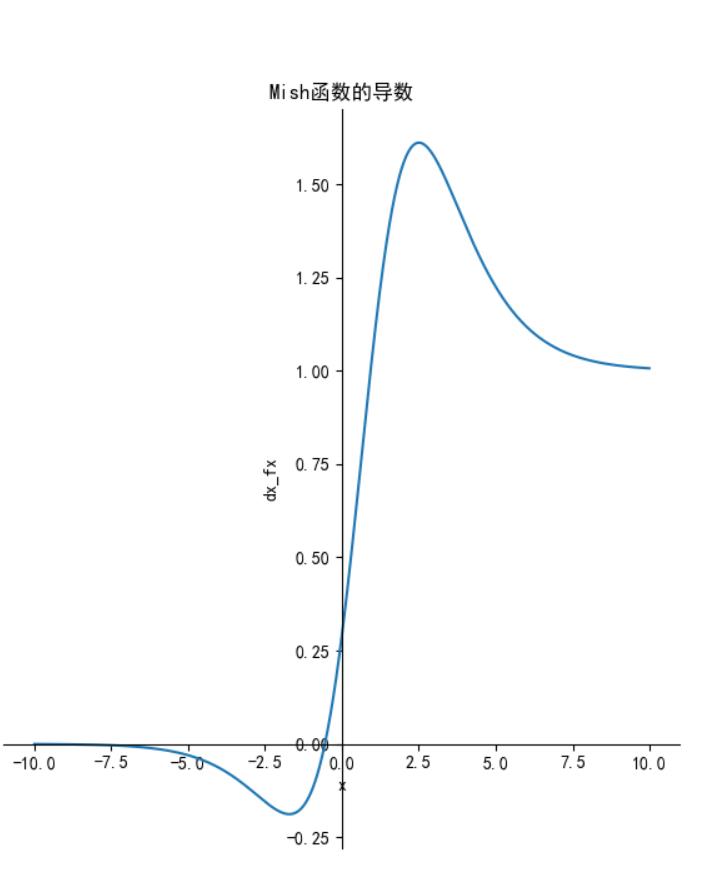
Mish激活函数
函数定义:
 ,函数图像如下:
导数:

函数图像如下:
特点:
特点:无上界(unbounded above)、有下界(bounded below)、平滑(smooth)和非单调(nonmonotonic)。
无上界:可以防止网络饱和,即梯度消失。
有下界:提升网络的正则化效果。
平滑:首先在0值点连续相比ReLU可以减少一些不可预料的问题,其次可以使网络更容易优化并且提高泛化性能。
非单调:可以使一些小的负输入也被保留为负输出,提高网络的可解释能力和梯度流
优点:平滑、非单调、上无界、有下界
缺点:引入了指数函数,增加了计算量
函数及导数代码:
from matplotlib import pyplot as plt
import numpy as np

# 解决中文显示问题
plt.rcParams['font.sans-serif'] = ['SimHei']
plt.rcParams['axes.unicode_minus'] = False
def sech(x):
    """sech函数"""
    return 2 / (np.exp(x) + np.exp(-x))

def sigmoid(x):
    """sigmoid函数"""
    return 1 / (1 + np.exp(-x))

def softplus(x):
    """softplus函数"""
    return np.log10(1+np.exp(x))

def tanh(x):
    """tanh函数"""
    return ((np.exp(x) - np.exp(-x)) / (np.exp(x) + np.exp(-x)))
if __name__ == '__main__':
    x = np.arange(-10, 10, 0.01)
    fx = x * tanh(softplus(x))
    dx_fx = sech(softplus(x))*sech(softplus(x))*x*sigmoid(x)+fx/x
    plt.subplot(1, 2, 1)
    ax = plt.gca()  # 得到图像的Axes对象
    ax.spines['right'].set_color('none')  # 将图像右边的轴设为透明
    ax.spines['top'].set_color('none')  # 将图像上面的轴设为透明
    ax.xaxis.set_ticks_position('bottom')  # 将x轴刻度设在下面的坐标轴上
    ax.yaxis.set_ticks_position('left')  # 将y轴刻度设在左边的坐标轴上
    ax.spines['bottom'].set_position(('data', 0))  # 将两个坐标轴的位置设在数据点原点
    ax.spines['left'].set_position(('data', 0))
    plt.title('Mish函数')
    plt.xlabel('x')
    plt.ylabel('fx')
    plt.plot(x, fx)
    plt.subplot(1, 2, 2)
    ax = plt.gca()  # 得到图像的Axes对象
    ax.spines['right'].set_color('none')  # 将图像右边的轴设为透明
    ax.spines['top'].set_color('none')  # 将图像上面的轴设为透明
    ax.xaxis.set_ticks_position('bottom')  # 将x轴刻度设在下面的坐标轴上
    ax.yaxis.set_ticks_position('left')  # 将y轴刻度设在左边的坐标轴上
    ax.spines['bottom'].set_position(('data', 0))  # 将两个坐标轴的位置设在数据点原点
    ax.spines['left'].set_position(('data', 0))
    plt.title('Mish函数的导数')
    plt.xlabel('x')
    plt.ylabel('dx_fx')
    plt.plot(x, dx_fx)
    plt.show()
-
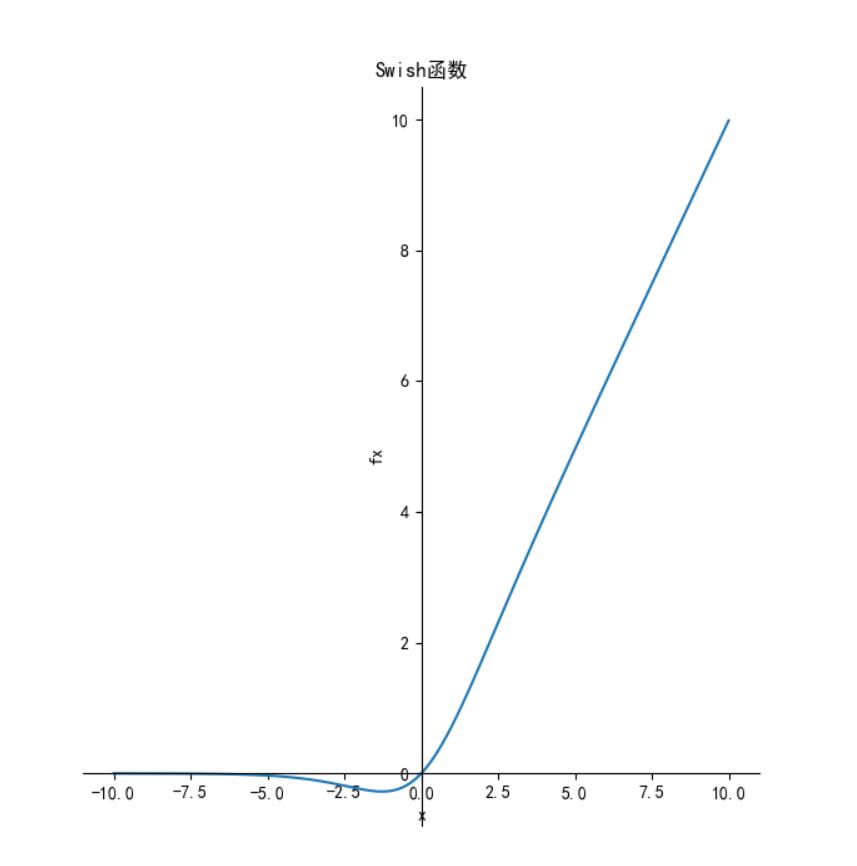
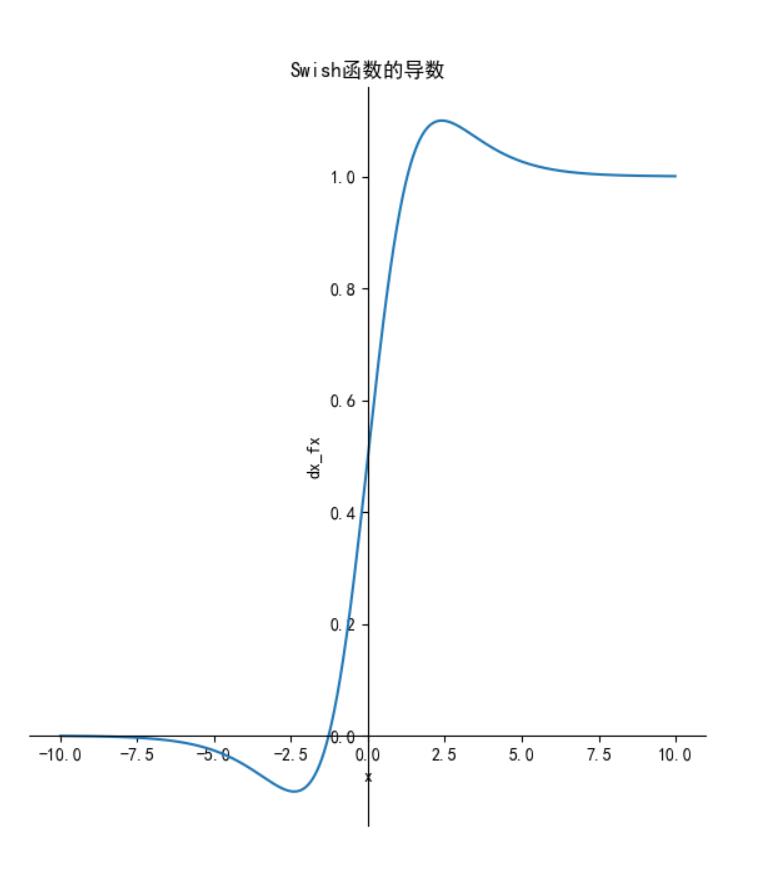
Swish 激活函数
函数定义为:
 ,其函数图像如下:
其导数:

函数图像如下:
特点:
特点:Swish 具备无上界有下界、平滑、非单调的特性。
优点:ReLU有无上界和有下界的特点,而Swish相比ReLU又增加了平滑和非单调的特点,这使得其在ImageNet上的效果更好。
缺点:引入了指数函数,增加了计算量
函数及导数代码:
from matplotlib import pyplot as plt
import numpy as np

# 解决中文显示问题
plt.rcParams['font.sans-serif'] = ['SimHei']
plt.rcParams['axes.unicode_minus'] = False
def sech(x):
    """sech函数"""
    return 2 / (np.exp(x) + np.exp(-x))

def sigmoid(x):
    """sigmoid函数"""
    return 1 / (1 + np.exp(-x))

def s(x):
    """sigmoid函数"""
    return 1 / (1 + np.exp(-b*x))

if __name__ == '__main__':
    x = np.arange(-10, 10, 0.01)
    b = 1
    fx = x / (1 + np.exp(-b * x))
    dx_fx = b * fx + s(x) * (1 - b * fx)
    plt.subplot(1, 2, 1)
    ax = plt.gca()  # 得到图像的Axes对象
    ax.spines['right'].set_color('none')  # 将图像右边的轴设为透明
    ax.spines['top'].set_color('none')  # 将图像上面的轴设为透明
    ax.xaxis.set_ticks_position('bottom')  # 将x轴刻度设在下面的坐标轴上
    ax.yaxis.set_ticks_position('left')  # 将y轴刻度设在左边的坐标轴上
    ax.spines['bottom'].set_position(('data', 0))  # 将两个坐标轴的位置设在数据点原点
    ax.spines['left'].set_position(('data', 0))
    plt.title('Swish函数')
    plt.xlabel('x')
    plt.ylabel('fx')
    plt.plot(x, fx)
    plt.subplot(1, 2, 2)
    ax = plt.gca()  # 得到图像的Axes对象
    ax.spines['right'].set_color('none')  # 将图像右边的轴设为透明
    ax.spines['top'].set_color('none')  # 将图像上面的轴设为透明
    ax.xaxis.set_ticks_position('bottom')  # 将x轴刻度设在下面的坐标轴上
    ax.yaxis.set_ticks_position('left')  # 将y轴刻度设在左边的坐标轴上
    ax.spines['bottom'].set_position(('data', 0))  # 将两个坐标轴的位置设在数据点原点
    ax.spines['left'].set_position(('data', 0))
    plt.title('Swish函数的导数')
    plt.xlabel('x')
    plt.ylabel('dx_fx')
    plt.plot(x, dx_fx)
    plt.show()
-
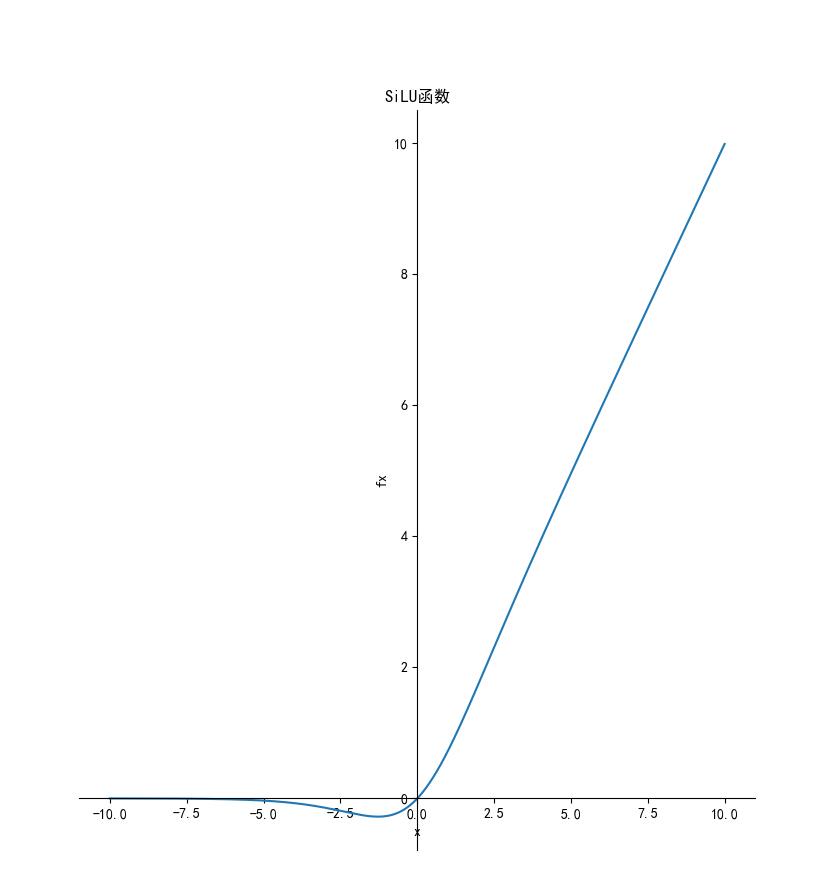
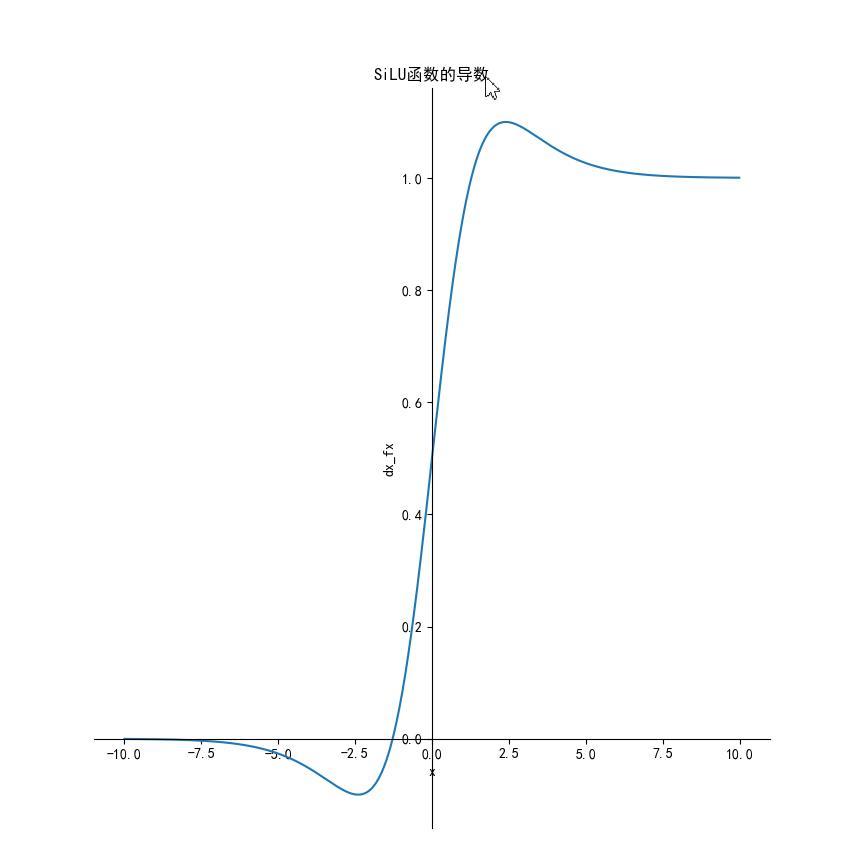
SiLU激活函数
函数定义为:
 ,其函数图形如下:
导数为:
 ,其函数图像如下:
函数及导数代码:
from matplotlib import pyplot as plt
import numpy as np

# 解决中文显示问题
plt.rcParams['font.sans-serif'] = ['SimHei']
plt.rcParams['axes.unicode_minus'] = False
def sigmoid(x):
    y = 1 / (1 + np.exp(-x))
    return y
def silu(x):
    return x*sigmoid(x)
def dx_silu(x):
    return silu(x)+sigmoid(x)*(1-silu(x))


if __name__ == '__main__':
    x = np.arange(-10, 10, 0.01)
    b = 1
    fx = silu(x)
    dx=dx_silu(x)
    plt.subplot(1, 2, 1)
    ax = plt.gca()  # 得到图像的Axes对象
    ax.spines['right'].set_color('none')  # 将图像右边的轴设为透明
    ax.spines['top'].set_color('none')  # 将图像上面的轴设为透明
    ax.xaxis.set_ticks_position('bottom')  # 将x轴刻度设在下面的坐标轴上
    ax.yaxis.set_ticks_position('left')  # 将y轴刻度设在左边的坐标轴上
    ax.spines['bottom'].set_position(('data', 0))  # 将两个坐标轴的位置设在数据点原点
    ax.spines['left'].set_position(('data', 0))
    plt.title('SiLU函数')
    plt.xlabel('x')
    plt.ylabel('fx')
    plt.plot(x, fx)
    plt.subplot(1, 2, 2)
    ax = plt.gca()  # 得到图像的Axes对象
    ax.spines['right'].set_color('none')  # 将图像右边的轴设为透明
    ax.spines['top'].set_color('none')  # 将图像上面的轴设为透明
    ax.xaxis.set_ticks_position('bottom')  # 将x轴刻度设在下面的坐标轴上
    ax.yaxis.set_ticks_position('left')  # 将y轴刻度设在左边的坐标轴上
    ax.spines['bottom'].set_position(('data', 0))  # 将两个坐标轴的位置设在数据点原点
    ax.spines['left'].set_position(('data', 0))
    plt.title('SiLU函数的导数')
    plt.xlabel('x')
    plt.ylabel('dx_fx')
    plt.plot(x, dx)
    plt.show()
以上是关于CNN基础——激活函数的主要内容,如果未能解决你的问题,请参考以下文章