Kibana可视化数据分析
Posted 云服务飞行团
tags:
篇首语:本文由小常识网(cha138.com)小编为大家整理,主要介绍了Kibana可视化数据分析相关的知识,希望对你有一定的参考价值。

Kibana可视化数据分析


Kibana 是一个开源的数据分析与可视化平台,可以配合elasticsearch一起使用,通过kibana搜索、查看存放在Elasticsearch中的数据,将数据转化为直观的图表、表格、地图等多种可视化组件,并将各种可视化组件集合成大屏,实现高级的数据分析与可视化的目的。

kibana安装配置和启动
kibana版本:https://www.elastic.co/cn/downloads/past-releases#kibana-oss
下载:wget https://artifacts.elastic.co/downloads/kibana/kibana-oss-6.5.4-linux-x86_64.tar.gz
解压:tar -zxf kibana-oss-6.5.4-linux-x86_64.tar.gz
配置配置文件:vi kibana-6.5.4-linux-x86_64/config/kibana.yml
配置文件内容:
# Specifies the address to which the Kibana server will bind. IP addresses and host names are both valid values.
# The default is 'localhost', which usually means remote machines will not be able to connect.
# To allow connections from remote users, set this parameter to a non-loopback address.
server.host: "0.0.0.0"
# Enables you to specify a path to mount Kibana at if you are running behind a proxy.
# Use the `server.rewriteBasePath` setting to tell Kibana if it should remove the basePath
# from requests it receives, and to prevent a deprecation warning at startup.
# This setting cannot end in a slash.
#server.basePath: ""
# Specifies whether Kibana should rewrite requests that are prefixed with
# `server.basePath` or require that they are rewritten by your reverse proxy.
# This setting was effectively always `false` before Kibana 6.3 and will
# default to `true` starting in Kibana 7.0.
#server.rewriteBasePath: false
# The maximum payload size in bytes for incoming server requests.
#server.maxPayloadBytes: 1048576
# The Kibana server's name. This is used for display purposes.
#server.name: "your-hostname"
# The URL of the Elasticsearch instance to use for all your queries.
elasticsearch.url: "http://es-nlb-es-7v0rfdu41h.jvessel-open-hb.jdcloud.com:9200"
# When this setting's value is true Kibana uses the hostname specified in the server.host
# setting. When the value of this setting is false, Kibana uses the hostname of the host
# that connects to this Kibana instance.
#elasticsearch.preserveHost: true
# Kibana uses an index in Elasticsearch to store saved searches, visualizations and
# dashboards. Kibana creates a new index if the index doesn't already exist.
kibana.index: ".kibana"
执行kibana:cd ../bin/ && ./kibana
访问kibana:http://ip:5601


Kibana可视化数据分析
我们通过kibana分析cdn客户的业务的质量数据入手,看看kibana是如何实现高效的数据分析功能。
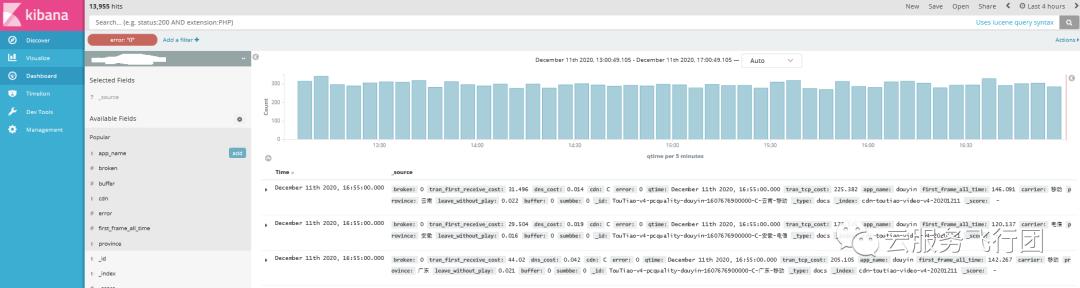
Discover:可以从Discover页面交互式的探索elasticsearch中的数据。实现查看和搜索、统计、过滤数据等功能。
下图可以看到我们可以通过筛选error不为0,过滤出存在错误的数据,有利于我们分析该客户请求中的错误原因。
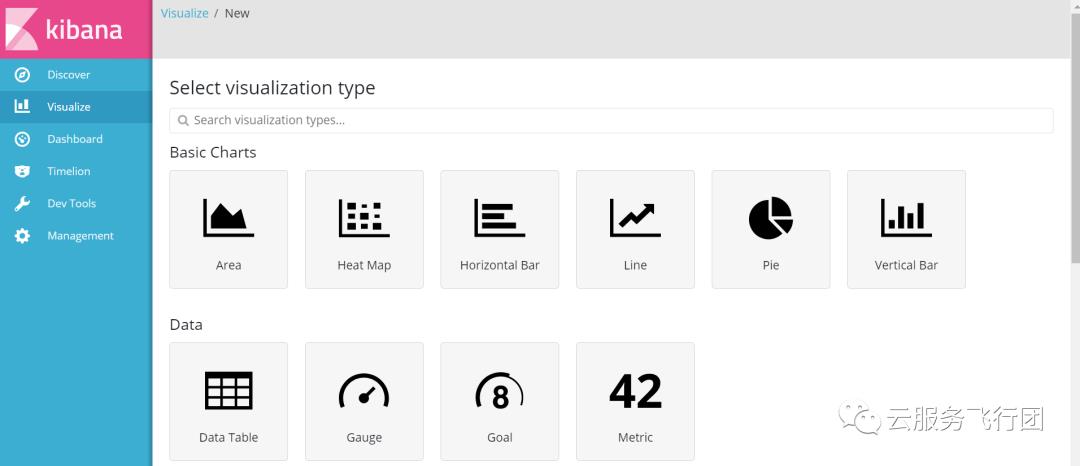
Visualize:可以利用一系列的 slasticsearch 查询聚合功能来提取和处理数据,为elasticsearch数据创建可视化控件,更直观的呈现数据的分布和趋势。
下图可以看到visualize为我们提供了多样的可视化组件:
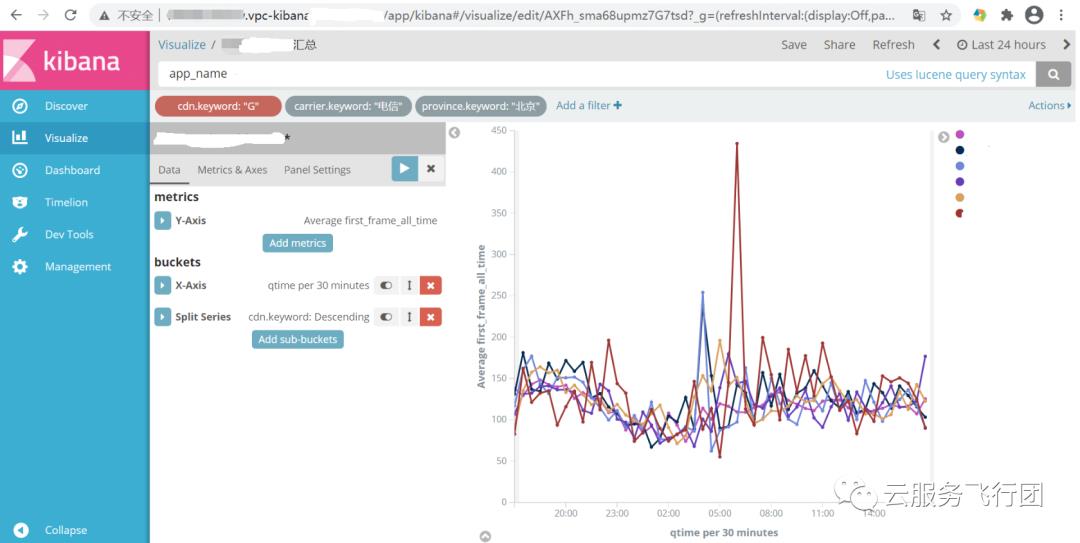
选择折线图绘制出北京电信区域的各个厂商的首帧趋势图对比图,可以清晰的看出各个厂商的质量趋势变化和排名。
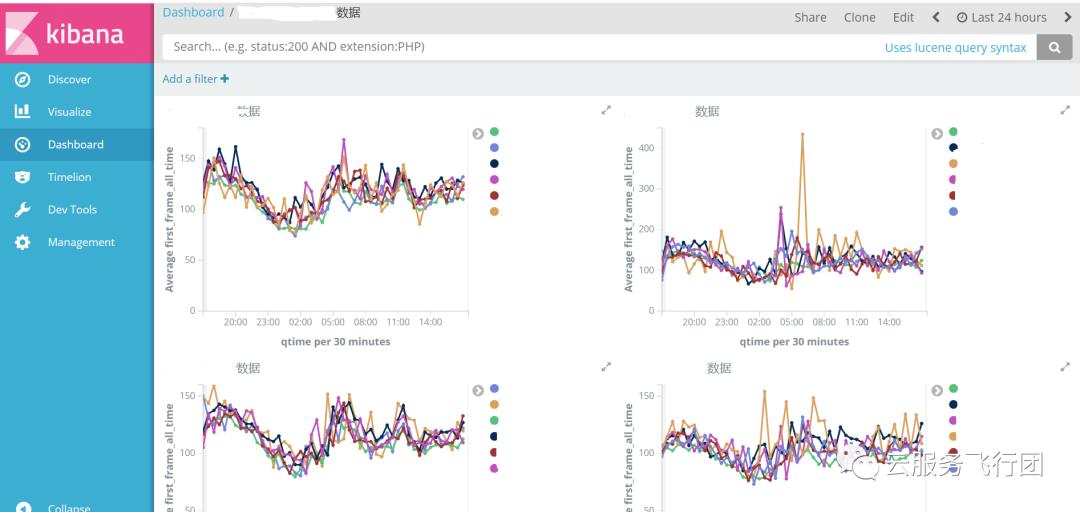
Dashboard:能够将各种可视化组件集合成大屏,实现高级的可视化数据仪表盘。
我们使用dashboard将使用visualize画出的各区域运营商的质量图组成分区域运营商的质量数据大屏,可以清晰的看出各个区域运营商的质量情况。


以上是关于Kibana可视化数据分析的主要内容,如果未能解决你的问题,请参考以下文章