[An Introduction to GCC 学习笔记] 11 core文件分析
Posted 漫小牛
tags:
篇首语:本文由小常识网(cha138.com)小编为大家整理,主要介绍了[An Introduction to GCC 学习笔记] 11 core文件分析相关的知识,希望对你有一定的参考价值。
Compiling for Debugging
- Normally, an executable file does not contain any reference to the original program source code, such as variable names or line-numbers. The executable file is simply the sequence of machine code instructions produced by the compiler. This is insufficient for debugging, since there is no easy way to find the cause of an error if the program crashes.
- GCC provides the ‘-g’ debug option to store additional debugging information in object files and executables. This debugging information in object files and executables. This debugging information allows errors to be traced back from a specific machine instruction to the corresponding line in the original source file. It also allows the execution of a program to be traced in a debugger, such as the GNU Debugger gdb.
- Using a debugger also allows the values of variables to be examined while the program is running.
- The debug option works by storing the names of functions and variables(and all the reference to them), with their corresponding source code line-numbers, in a symbol table in object files and executables.
- When a program exits abnormally the operating system can write out a core file, usually named ‘core’, which contains the in-memory stat of the program at the time it crashed.
- Combined with information from the sysbol table produced by ‘-g’, the core file can be used to find the line where the program stopped, and the values of its variables at that point.
- This is useful both during the development of software, and after deployment - it allows problems to be investigated when a program has crashed in “in the field”.
core文件实验
c文件为:
int a(int *p)
int main(void)
{
	int *p = 0;
	return a(p);
}

int a(int *p)
{
	int y = *p;
	return y;
}
编译该文件,并执行,报段错误:

说明该文件编译时正确,运行时错误。在语法上,这个程序是正确的,但访问了不该访问的内存空间,导致操作系统将这个程序kill掉,并报段错误。
下面,用core dump进行调试,首先看一下允许产生的core dump的大小:

ulimit -c为0,表示不允许产生core dump,若要想让它产生core dump,可输入如下命令:
ulimit -c unlimited
这时就可以产生core dump,可以通过man ulimit来查看这条指令的说明。
现在我们继续执行这个程序./a.out:

可以看到程序产生了core dump。ll查看一下,已经产生了core文件。这个文件是系统运行时,崩溃的那一瞬间,操作系统将所有的内存信息保存到core文件,这就是core dump。
这个程序存在core dump是很正常的,因为程序中引用了空指针,下面就需要用gdb调试一下,看看问题在什么地方。
调试的指令为:
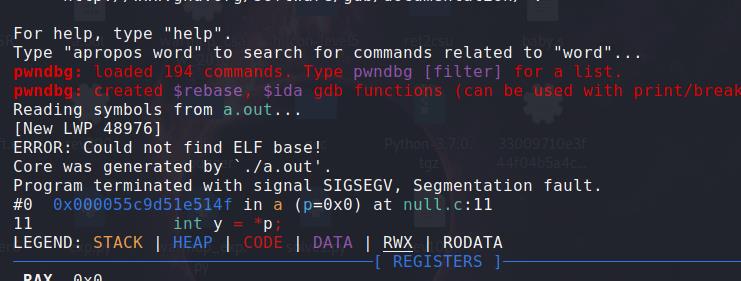
gdb a.out core

从图中,可以清楚的看到报错的位置和信息。

打印p的值,也能看出这是一个空指针。
以上是关于[An Introduction to GCC 学习笔记] 11 core文件分析的主要内容,如果未能解决你的问题,请参考以下文章