正解!实用计算两个文件夹内图像的SSIM与PSNR
Posted u25th_engineer
tags:
篇首语:本文由小常识网(cha138.com)小编为大家整理,主要介绍了正解!实用计算两个文件夹内图像的SSIM与PSNR相关的知识,希望对你有一定的参考价值。
要求:两个文件夹内的图像数量一致、文件名对应一致。 比如:文件夹A下有3张图像x1.png、x2.png、x3.png,文件夹B下也有3张图像x1.png、x2.png、x3.png。
所用命令如下:
python evaluate.py --org_img_path path_1 --pred_img_path path_2 --metric psnr
上述命令中的path_1与path_2分别是两个文件夹的绝对路径。
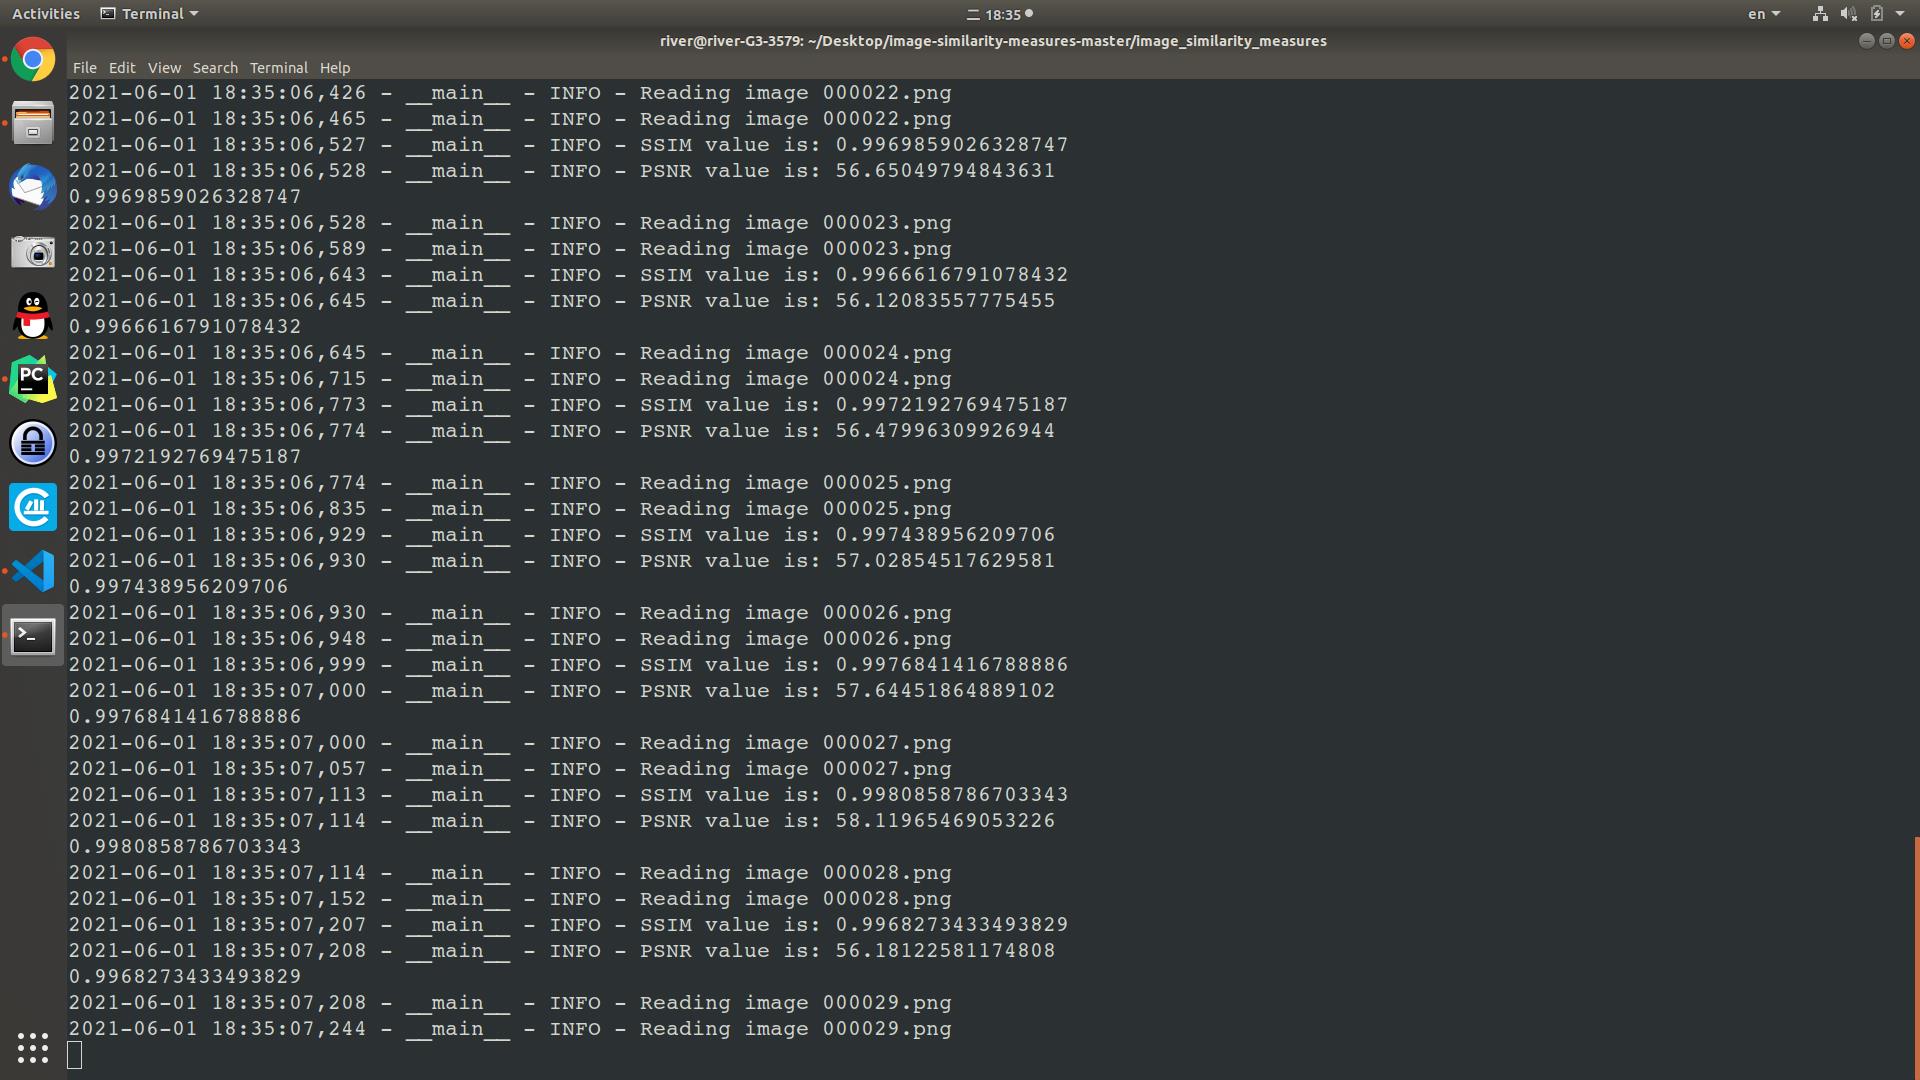
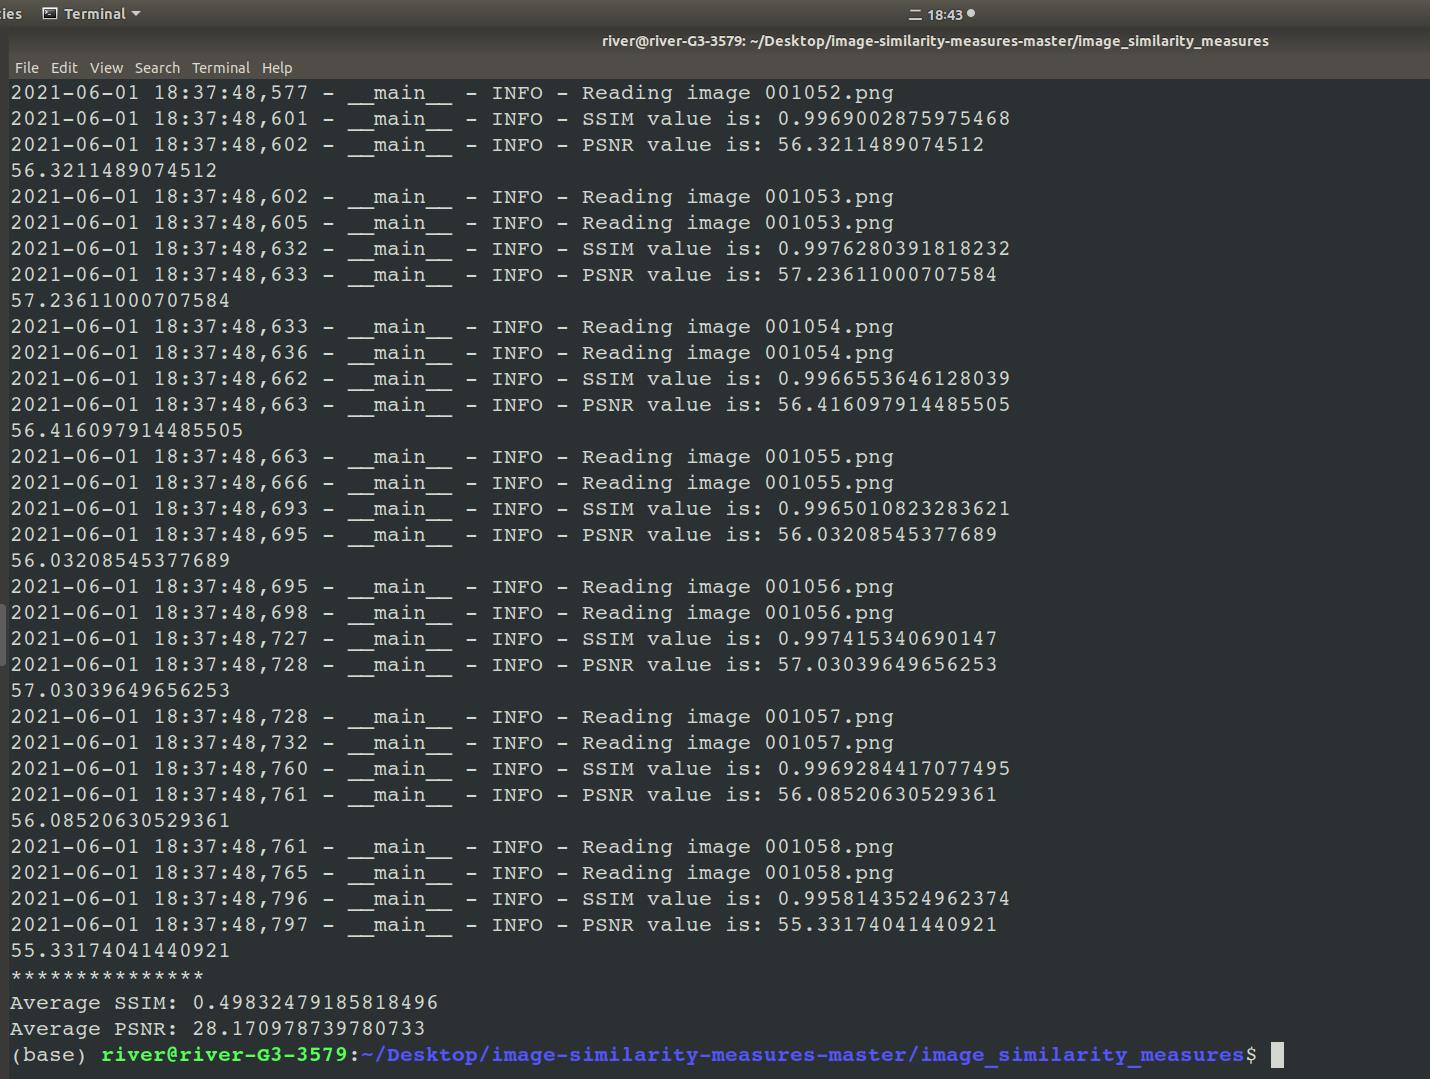
运行结果示例,如图1至图3所示。

图 1

图 2

图 3
所用代码附在末尾。其实这个代码还可以计算其它指标,具体可以参考博文末的参考资料,但博主所附代码不支持计算两个文件夹下的图像除SSIM与PSNR外的指标。
# file: __init__.py
# file: quality_metrics.py
"""
This module is a collection of metrics to assess the similarity between two images.
PSNR, SSIM, FSIM and ISSM are the current metrics that are implemented in this module.
"""
import math

import numpy as np
from skimage.metrics import structural_similarity
import phasepack.phasecong as pc
import cv2


def _assert_image_shapes_equal(org_img: np.ndarray, pred_img: np.ndarray, metric: str):
    msg = (f"Cannot calculate {metric}. Input shapes not identical. y_true shape ="
           f"{str(org_img.shape)}, y_pred shape = {str(pred_img.shape)}")

    assert org_img.shape == pred_img.shape, msg

def rmse(org_img: np.ndarray, pred_img: np.ndarray, max_p=4095) -> float:
    """
    Root Mean Squared Error

    Calculated individually for all bands, then averaged
    """
    _assert_image_shapes_equal(org_img, pred_img, "RMSE")

    org_img = org_img.astype(np.float32)

    rmse_bands = []
    for i in range(org_img.shape[2]):
        dif = np.subtract(org_img, pred_img)
        m = np.mean(np.square( dif / max_p))
        s = np.sqrt(m)
        rmse_bands.append(s)

    return np.mean(rmse_bands)


def psnr(org_img: np.ndarray, pred_img: np.ndarray, max_p=4095) -> float:
    """
    Peek Signal to Noise Ratio, implemented as mean squared error converted to dB.

    It can be calculated as
    PSNR = 20 * log10(MAXp) - 10 * log10(MSE)

    When using 12-bit imagery MaxP is 4095, for 8-bit imagery 255. For floating point imagery using values between
    0 and 1 (e.g. unscaled reflectance) the first logarithmic term can be dropped as it becomes 0
    """
    _assert_image_shapes_equal(org_img, pred_img, "PSNR")

    org_img = org_img.astype(np.float32)

    mse_bands = []
    for i in range(org_img.shape[2]):
        mse_bands.append(np.mean(np.square(org_img[:, :, i] - pred_img[:, :, i])))

    return 20 * np.log10(max_p) - 10. * np.log10(np.mean(mse_bands))


def _similarity_measure(x, y, constant):
    """
    Calculate feature similarity measurement between two images
    """
    numerator = 2 * x * y + constant
    denominator = x ** 2 + y ** 2 + constant

    return numerator / denominator


def _gradient_magnitude(img: np.ndarray, img_depth):
    """
    Calculate gradient magnitude based on Scharr operator
    """
    scharrx = cv2.Scharr(img, img_depth, 1, 0)
    scharry = cv2.Scharr(img, img_depth, 0, 1)

    return np.sqrt(scharrx ** 2 + scharry ** 2)


def fsim(org_img: np.ndarray, pred_img: np.ndarray, T1=0.85, T2=160) -> float:
    """
    Feature-based similarity index, based on phase congruency (PC) and image gradient magnitude (GM)

    There are different ways to implement PC, the authors of the original FSIM paper use the method
    defined by Kovesi (1999). The Python phasepack project fortunately provides an implementation
    of the approach.

    There are also alternatives to implement GM, the FSIM authors suggest to use the Scharr
    operation which is implemented in OpenCV.

    Note that FSIM is defined in the original papers for grayscale as well as for RGB images. Our use cases
    are mostly multi-band images e.g. RGB + NIR. To accommodate for this fact, we compute FSIM for each individual
    band and then take the average.

    Note also that T1 and T2 are constants depending on the dynamic range of PC/GM values. In theory this parameters
    would benefit from fine-tuning based on the used data, we use the values found in the original paper as defaults.

    Args:
        org_img -- numpy array containing the original image
        pred_img -- predicted image
        T1 -- constant based on the dynamic range of PC values
        T2 -- constant based on the dynamic range of GM values
    """
    _assert_image_shapes_equal(org_img, pred_img, "FSIM")

    alpha = beta = 1  # parameters used to adjust the relative importance of PC and GM features
    fsim_list = []
    for i in range(org_img.shape[2]):
        # Calculate the PC for original and predicted images
        pc1_2dim = pc(org_img[:, :, i], nscale=4, minWaveLength=6, mult=2, sigmaOnf=0.5978)
        pc2_2dim = pc(pred_img[:, :, i], nscale=4, minWaveLength=6, mult=2, sigmaOnf=0.5978)

        # pc1_2dim and pc2_2dim are tuples with the length 7, we only need the 4th element which is the PC.
        # The PC itself is a list with the size of 6 (number of orientation). Therefore, we need to
        # calculate the sum of all these 6 arrays.
        pc1_2dim_sum = np.zeros((org_img.shape[0], org_img.shape[1]), dtype=np.float64)
        pc2_2dim_sum = np.zeros((pred_img.shape[0], pred_img.shape[1]), dtype=np.float64)
        for orientation in range(6):
            pc1_2dim_sum += pc1_2dim[4][orientation]
            pc2_2dim_sum += pc2_2dim[4][orientation]

        # Calculate GM for original and predicted images based on Scharr operator
        gm1 = _gradient_magnitude(org_img[:, :, i], cv2.CV_16U)
        gm2 = _gradient_magnitude(pred_img[:, :, i], cv2.CV_16U)

        # Calculate similarity measure for PC1 and PC2
        S_pc = _similarity_measure(pc1_2dim_sum, pc2_2dim_sum, T1)
        # Calculate similarity measure for GM1 and GM2
        S_g = _similarity_measure(gm1, gm2, T2)

        S_l = (S_pc ** alpha) * (S_g ** beta)

        numerator = np.sum(S_l * np.maximum(pc1_2dim_sum, pc2_2dim_sum))
        denominator = np.sum(np.maximum(pc1_2dim_sum, pc2_2dim_sum))
        fsim_list.append(numerator / denominator)

    return np.mean(fsim_list)


def _ehs(x, y):
    """
    Entropy-Histogram Similarity measure
    """
    H = (np.histogram2d(x.flatten(), y.flatten()))[0]

    return -np.sum(np.nan_to_num(H * np.log2(H)))


def _edge_c(x, y):
    """
    Edge correlation coefficient based on Canny detector
    """
    # Use 100 and 200 as thresholds, no indication in the paper what was used
    g = cv2.Canny((x * 0.0625).astype(np.uint8), 100, 200)
    h = cv2.Canny((y * 0.0625).astype(np.uint8), 100, 200)

    g0 = np.mean(g)
    h0 = np.mean(h)

    numerator = np.sum((g - g0) * (h - h0))
    denominator = np.sqrt(np.sum(np.square(g-g0)) * np.sum(np.square(h-h0)))

    return numerator / denominator


def issm(org_img: np.ndarray, pred_img: np.ndarray) -> float:
    """
    Information theoretic-based Statistic Similarity Measure

    Note that the term e which is added to both the numerator as well as the denominator is not properly
    introduced in the paper. We assume the authers refer to the Euler number.
    """
    _assert_image_shapes_equal(org_img, pred_img, "ISSM")

    # Variable names closely follow original paper for better readability
    x = org_img
    y = pred_img
    A = 0.3
    B = 0.5
    C = 0.7

    ehs_val = _ehs(x, y)
    canny_val = _edge_c(x, y)

    numerator = canny_val * ehs_val * (A + B) + math.e
    denominator = A * canny_val * ehs_val + B * ehs_val + C * ssim(x, y) + math.e

    return np.nan_to_num(numerator / denominator)


def ssim(org_img: np.ndarray, pred_img: np.ndarray, max_p=4095) -> float:
    """
    Structural SIMularity index
    """
    _assert_image_shapes_equal(org_img, pred_img, "SSIM")

    return structural_similarity(org_img, pred_img, data_range=max_p, multichannel=True)


def sliding_window(image, stepSize, windowSize):
    # slide a window across the image
    for y in range(0, image.shape[0], stepSize):
        for x in range(0, image.shape[1], stepSize):
            # yield the current window
            yield (x, y, image[y:y + windowSize[1], x:x + windowSize[0]])


def uiq(org_img: np.ndarray, pred_img: np.ndarray, step_size=1, window_size=8):
    """
    Universal Image Quality index
    """
    # TODO: Apply optimization, right now it is very slow
    _assert_image_shapes_equal(org_img, pred_img, "UIQ")

    org_img = org_img.astype(np.float32)
    pred_img = pred_img.astype(np.float32)

    q_all = []
    for (x, y, window_org), (x, y, window_pred) in zip(sliding_window(org_img, stepSize=step_size,
                                                                      windowSize=(window_size, window_size)),
                                                       sliding_window(pred_img, stepSize=step_size,
                                                                      windowSize=(window_size, window_size))):
        # if the window does not meet our desired window size, ignore it
        if window_org.shape[0] != window_size or window_org.shape[1] != window_size:
            continue

        for i in range(org_img.shape[2]):
            org_band = window_org[:, :, i]
            pred_band = window_pred[:, :, i]
            org_band_mean = np.mean(org_band)
            pred_band_mean = np.mean(pred_band)
            org_band_variance = np.var(org_band)
            pred_band_variance = np.var(pred_band)
            org_pred_band_variance = np.mean((org_band - org_band_mean) * (pred_band - pred_band_mean))

            numerator = 4 * org_pred_band_variance * org_band_mean * pred_band_mean
            denominator = (org_band_variance + pred_band_variance) * (org_band_mean**2 + pred_band_mean**2)

            if denominator != 0.0:
                q = numerator / denominator
                q_all.append(q)

    if not np.any(q_all):
        raise ValueError(f"Window size ({window_size}) is too big for image with shape "
                         f"{org_img.shape[0:2]}, please use a smaller window size.")

    return np.mean(q_all)


def sam(org_img: np.ndarray, pred_img: np.ndarray, convert_to_degree=True):
    """
    Spectral Angle Mapper which defines the spectral similarity between two spectra
    """

    _assert_image_shapes_equal(org_img, pred_img, "SAM")

    # Spectral angles are first computed for each pair of pixels
    numerator = np.sum(np.multiply(pred_img, org_img), axis=2)
    denominator = np.linalg.norm(org_img, axis=2) * np.linalg.norm(pred_img, axis=2)
    val = np.clip(numerator / denominator, -1, 1)
    sam_angles = np.arccos(val)
    if convert_to_degree:
        sam_angles = sam_angles * 180.0 / np.pi

    # The original paper states that SAM values are expressed as radians, while e.g. Lanares
    # et al. (2018) use degrees. We therefore made this configurable, with degree the default
    return np.mean(np.nan_to_num(sam_angles))


def sre(org_img: np.ndarray, pred_img: np.ndarray):
    """
    signal to reconstruction error ratio
    """
    _assert_image_shapes_equal(org_img, pred_img, "SRE")

    org_img = org_img.astype(np.float32)

    sre_final = []
    for i in range(org_img.shape[2]):
        numerator = np.square(np.mean(org_img[:, :, i]))
        denominator = (np.linalg.norm(org_img[:, :, i] - pred_img[:, :, i])) /\\
                      (org_img.shape[0] * org_img.shape[1])
        sre_final.append(numerator/denominator)

    return 10 * np.log10(np.mean(sre_final))

metric_functions = {
    "fsim": fsim,
    "issm": issm,
    "psnr": psnr,
    "rmse": rmse,
    "sam": sam,
    "sre": sre,
    "ssim": ssim,
    "uiq": uiq,
}
#  file: evaluate.py
import argparse
import json
import logging
import os

import cv2
import numpy as np

try:
    import rasterio
except ImportError:
    rasterio = None

from image_similarity_measures.quality_metrics import metric_functions

logger = logging.getLogger(__name__)


def read_image(path):
    logger.info("Reading image %s", os.path.basename(path))
    if rasterio and (path.endswith(".tif") or path.endswith(".tiff")):
        return np.rollaxis(rasterio.open(path).read(), 0, 3)
    return cv2.imread(path)


def evaluation(org_img_path, pred_img_path, metrics):
    output_dict = {}
    org_img = read_image(org_img_path)
    pred_img = read_image(pred_img_path)

    for metric in metrics:
        metric_func = metric_functions[metric]
        out_value = float(metric_func(org_img, pred_img))
        logger.info(f"{metric.upper()} value is: {out_value}")
        output_dict[metric] = out_value
    return output_dict

def rename2PicsToSameNames(path1, path2):
    pics1 = os.listdir(path1)
    pics2 = os.listdir(path2)

    sum = 0

    for pic in pics1:
        print(pic)
        try:
            flag = pics2.index(pic.replace('_real_B', '_fake_B'))
        except IOError:
            print('There is not any image with the same name as ' + str(pic) + ' in ' + str(path2))
        p1_name = "{:0>6d}".format(sum) + pic[-4:]
        p2_name = p1_name
        src_p1 = os.path.join(path1, pic)
        dst_p1 = os.path.join(path1, p1_name)
        os.rename(src_p1<以上是关于正解!实用计算两个文件夹内图像的SSIM与PSNR的主要内容,如果未能解决你的问题,请参考以下文章