Pandas实战 足球运动员数据分析
Posted ZSYL
tags:
篇首语:本文由小常识网(cha138.com)小编为大家整理,主要介绍了Pandas实战 足球运动员数据分析相关的知识,希望对你有一定的参考价值。
足球运动员数据分析
加载数据
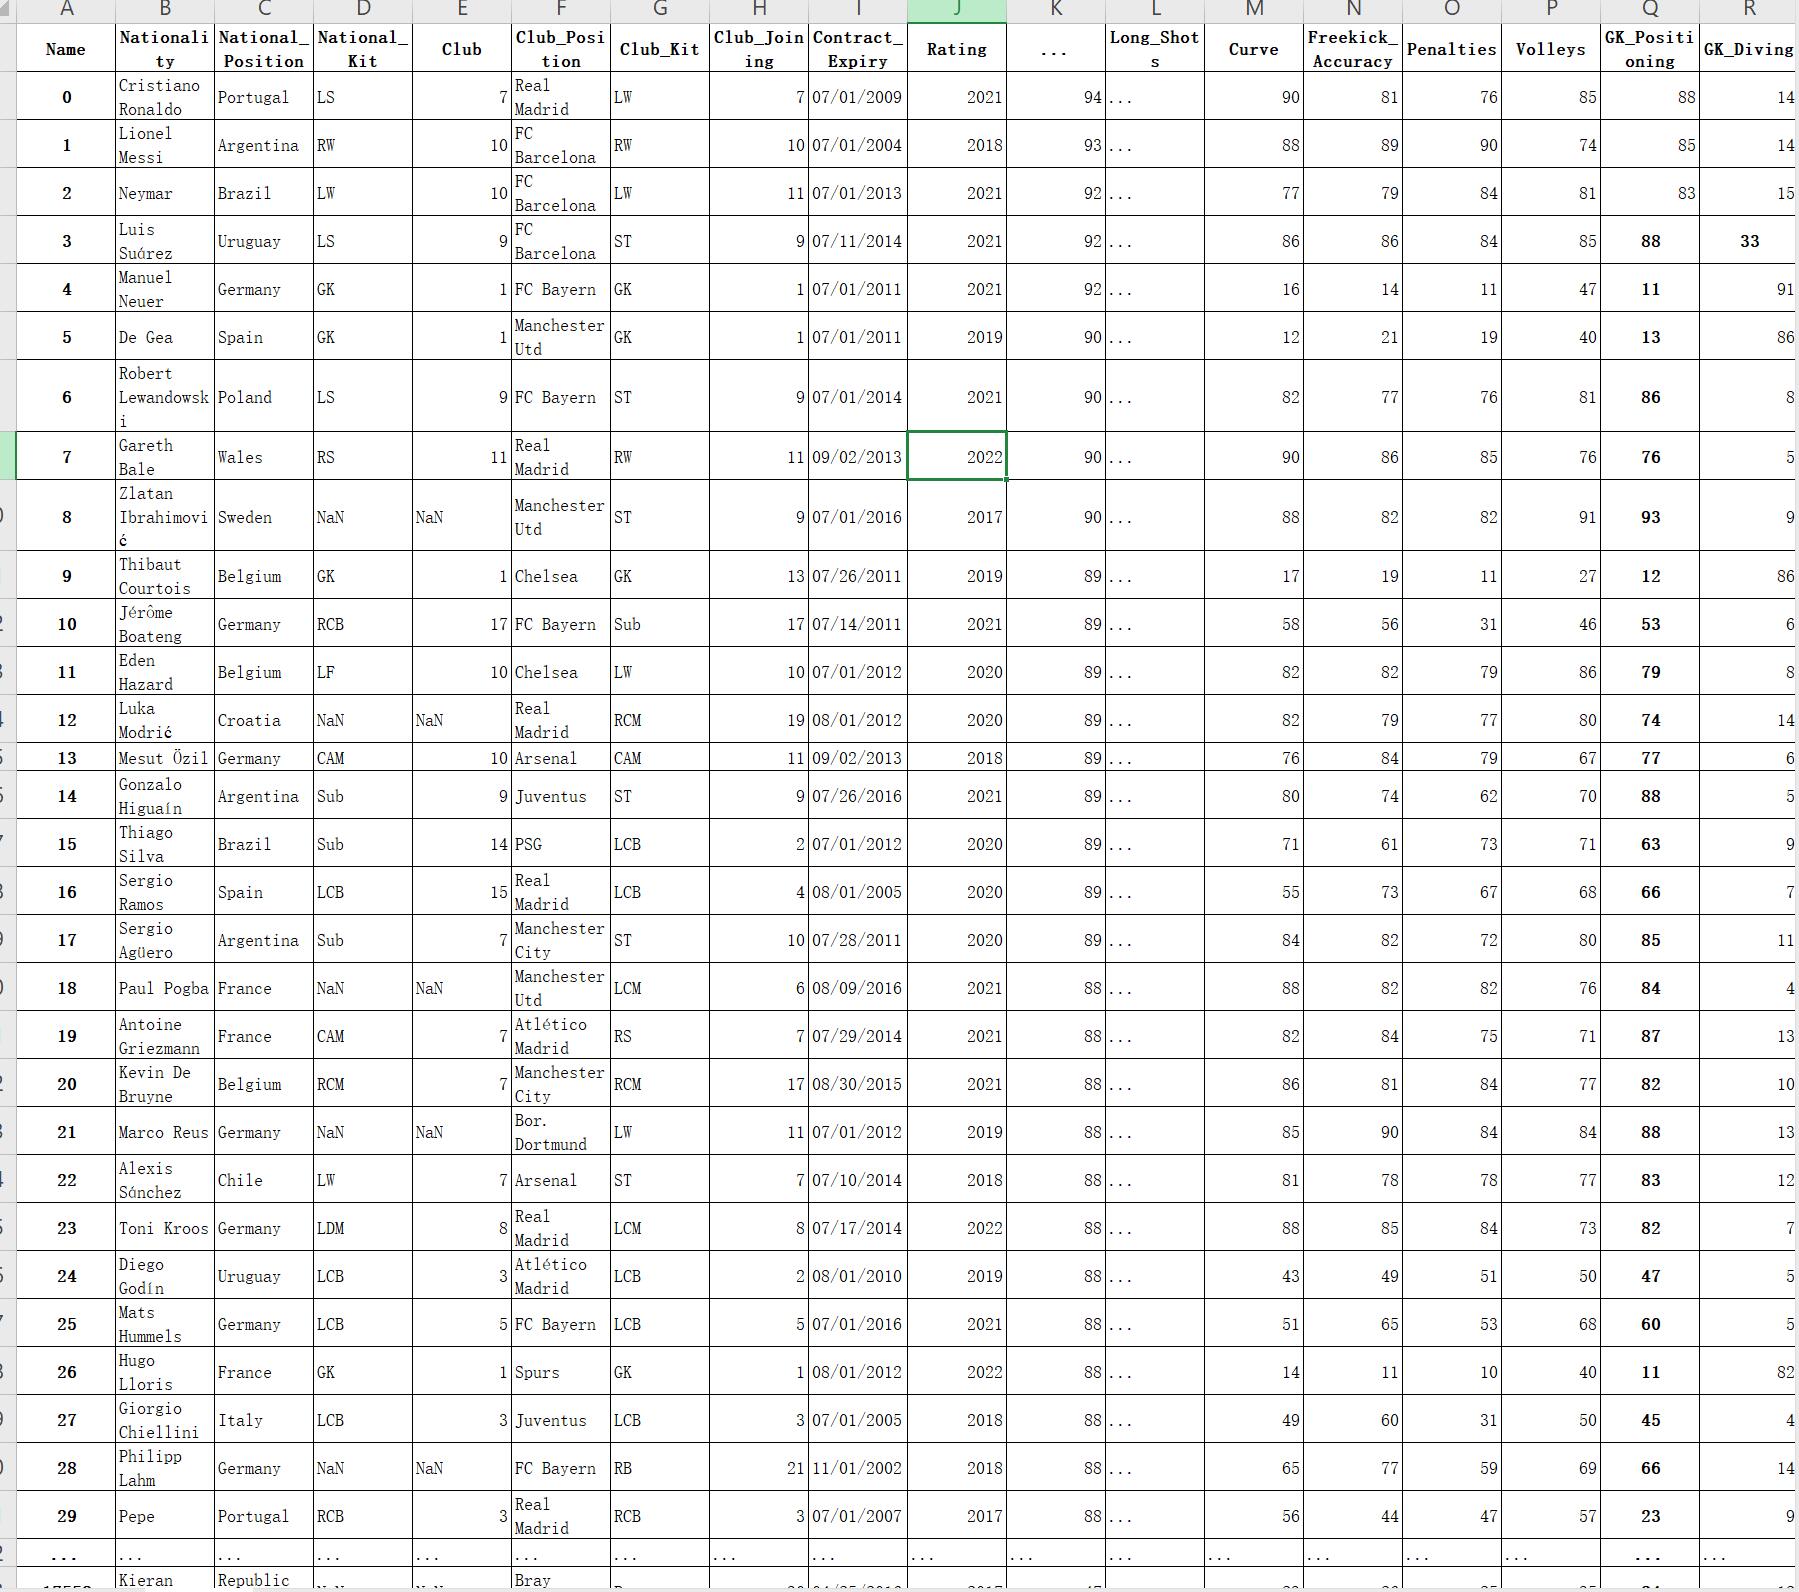
import numpy as np
import pandas as pd
import matplotlib.pyplot as plt
#支持中文
#解决中文显示问题
plt.rcParams['font.sans-serif'] = ['KaiTi']  # 指定默认字体
plt.rcParams['axes.unicode_minus'] = False  # 解决保存图像是负号'-'显示为方块的问题
player = pd.read_csv('./data/FullData.csv')
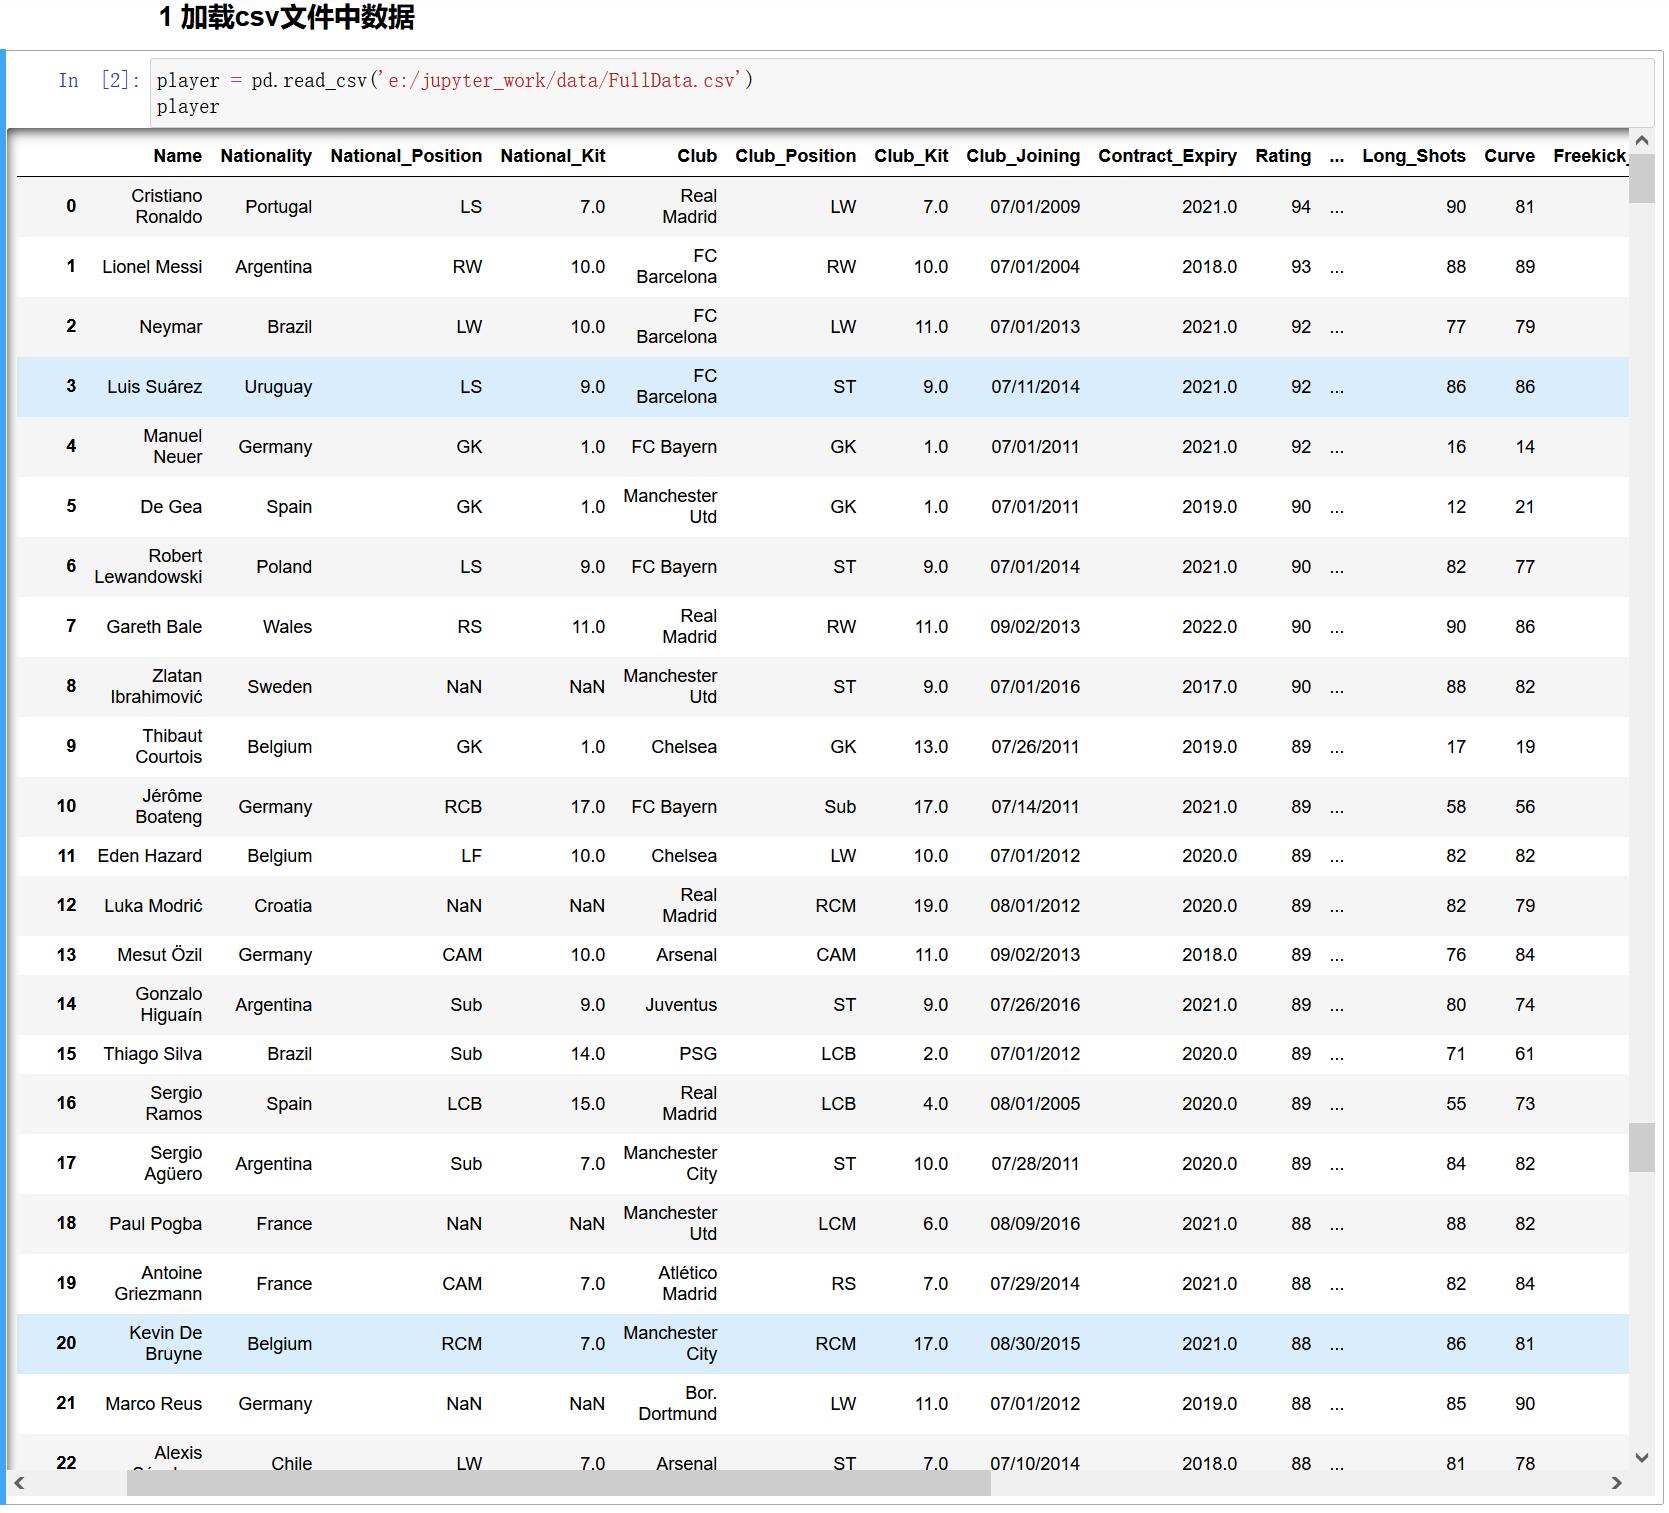
查看数据
shape
查看数据形状规模大小
player.shape

head
查看数据前 5 行
player.head()
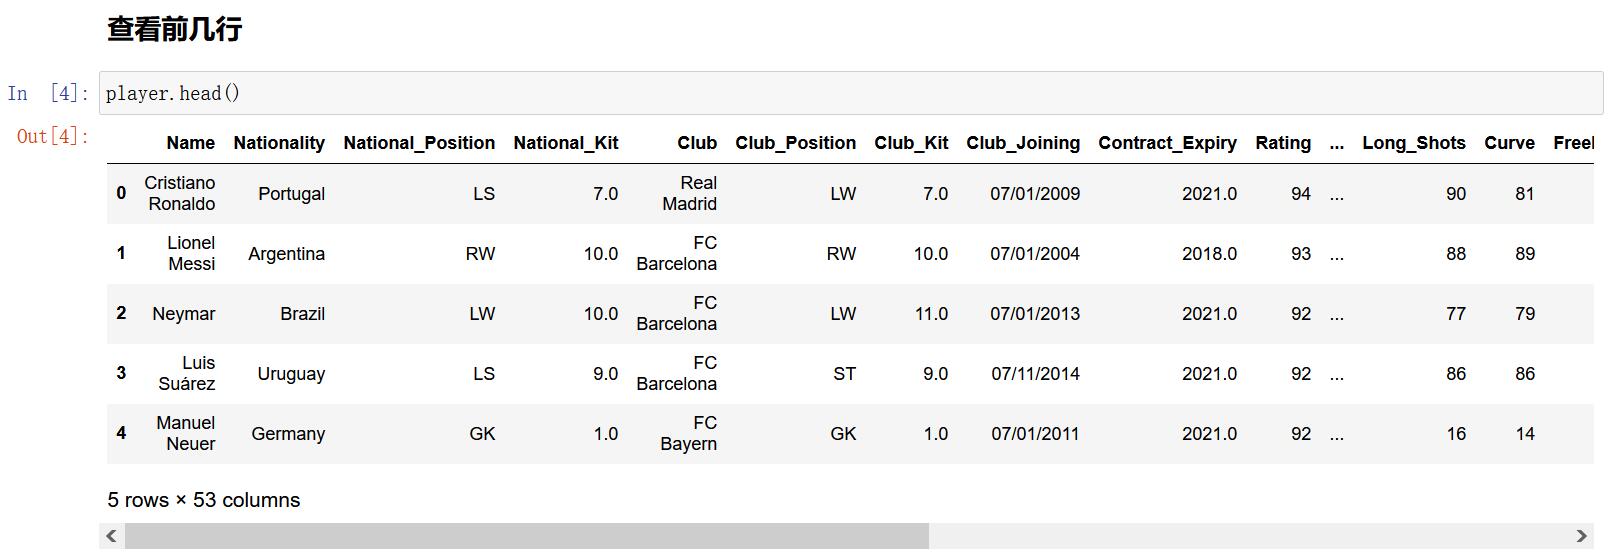
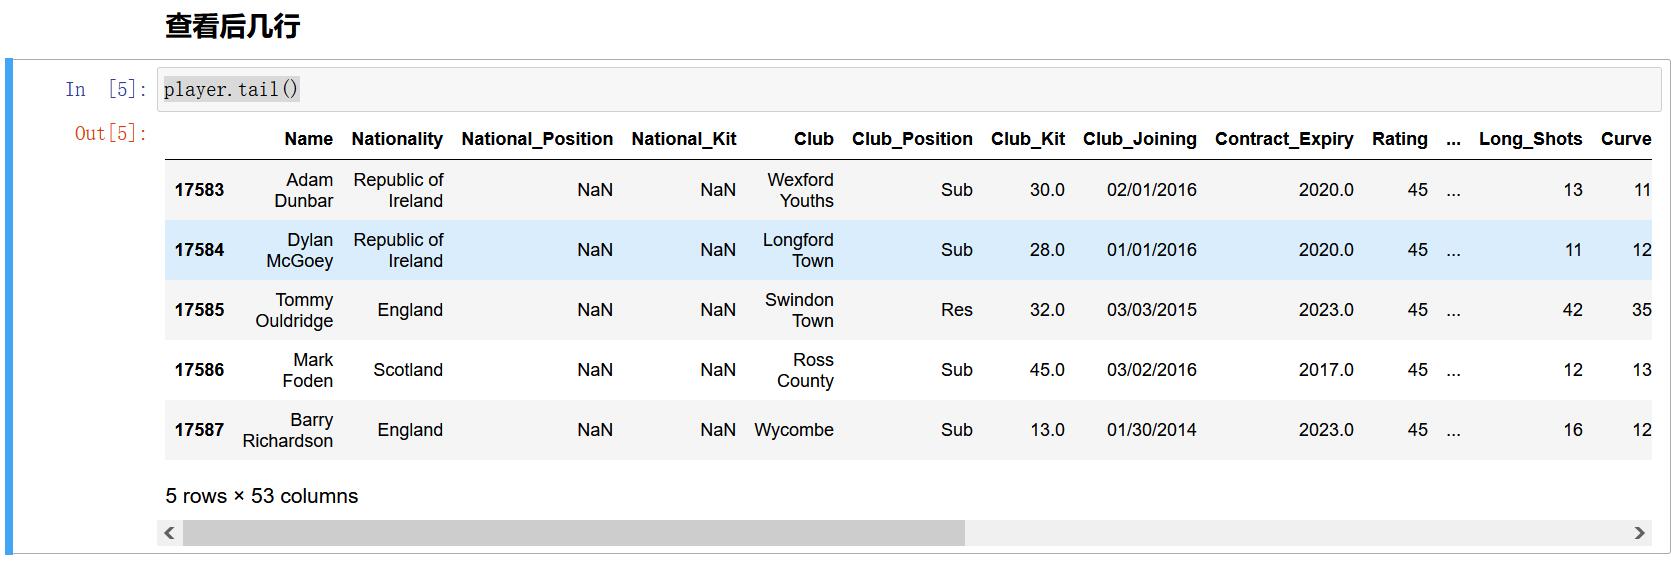
tail
查看后几行
player.tail()
info
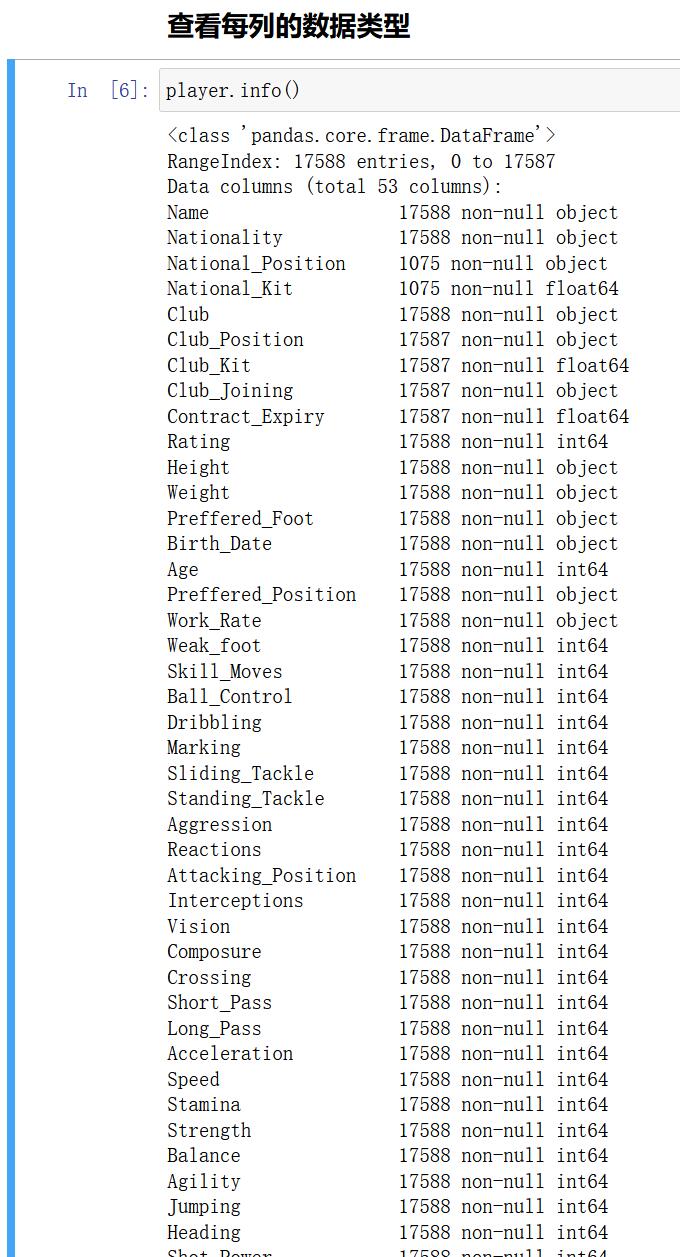
查看每列数据的数据类型
player.info()
缺值处理
从上述示例可以看到总共 17588 行,但 National_Position(国家队位置) 是 1075 行,Club_Position (俱乐部位置)17587 行。
我们知道有的足球运动员是没有进入国家队的,所以 National_Position 缺值是正常情况。但 Club_Position 缺值需要处理。
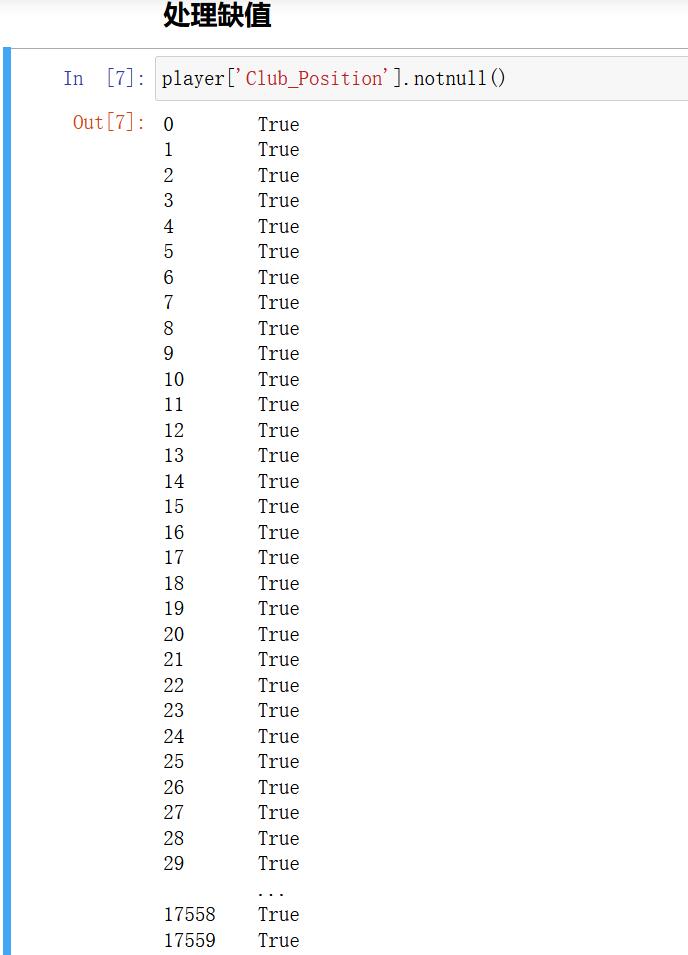
notnull
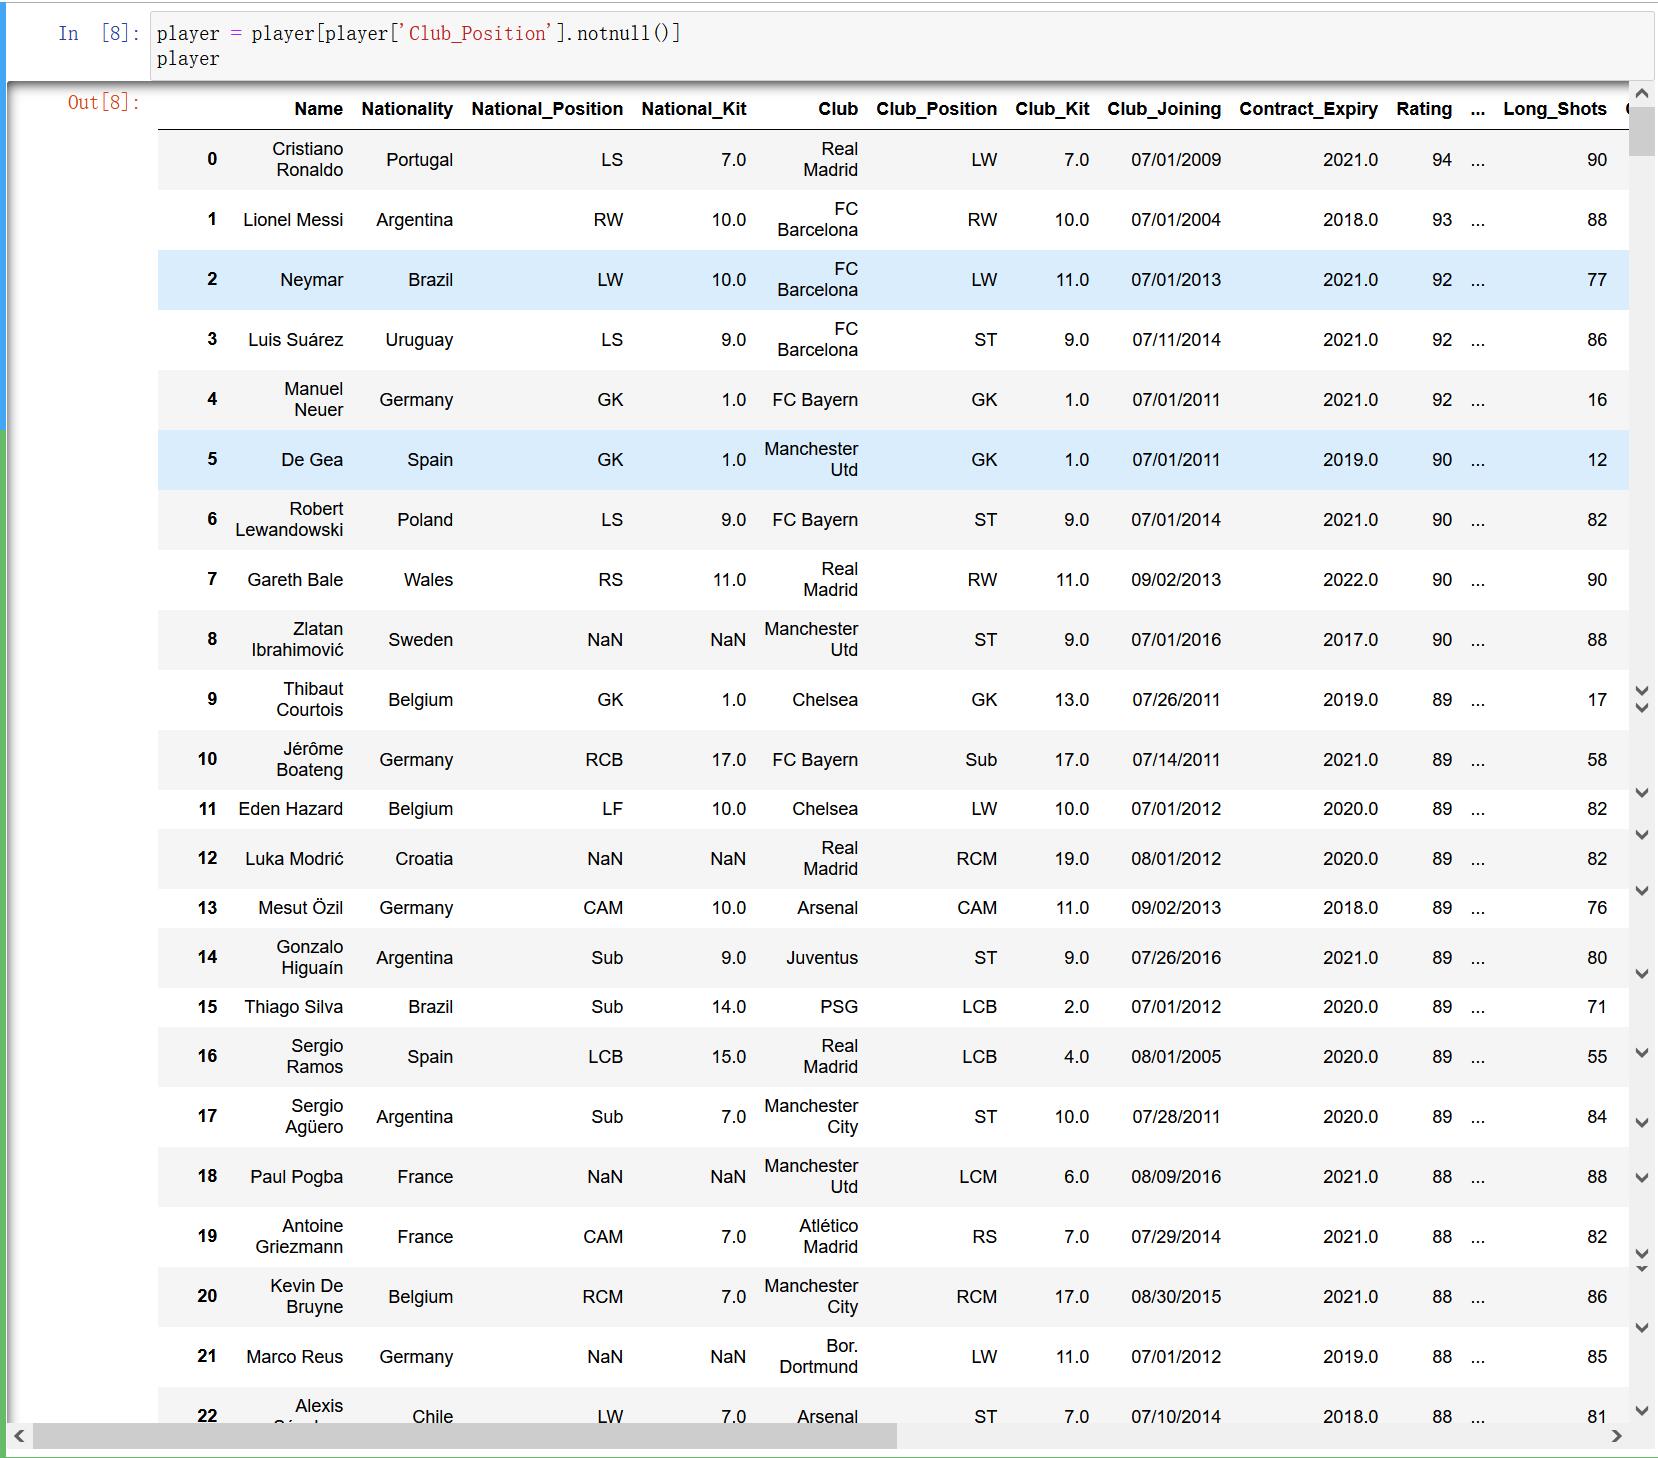
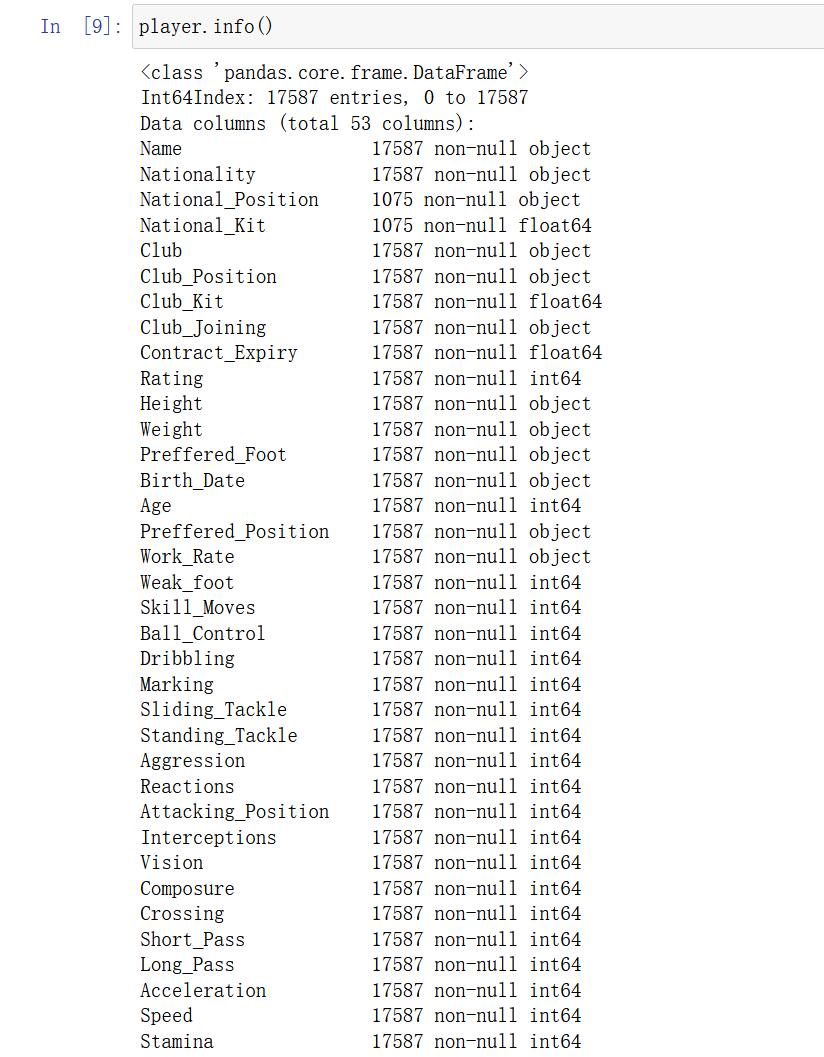
删除 Club_Position 的缺失值
player = player[player['Club_Position'].notnull()]
player.info()
duplicated
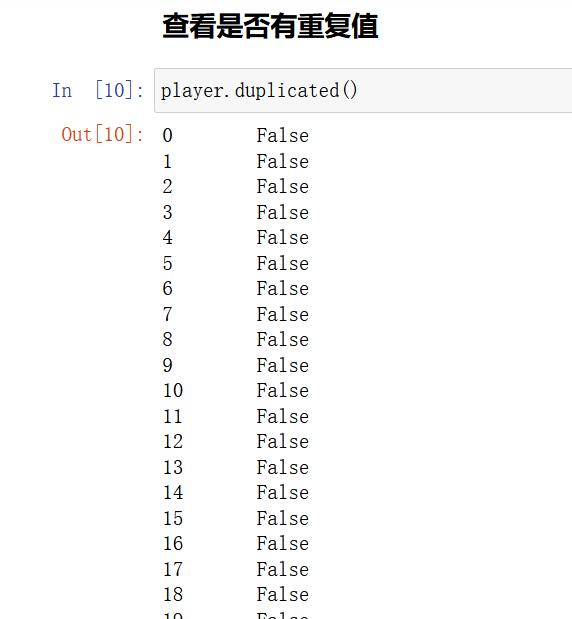
查看是否有重复数据
player.duplicated().any() #只要有重复,则返回true

运动员身高和体重分布
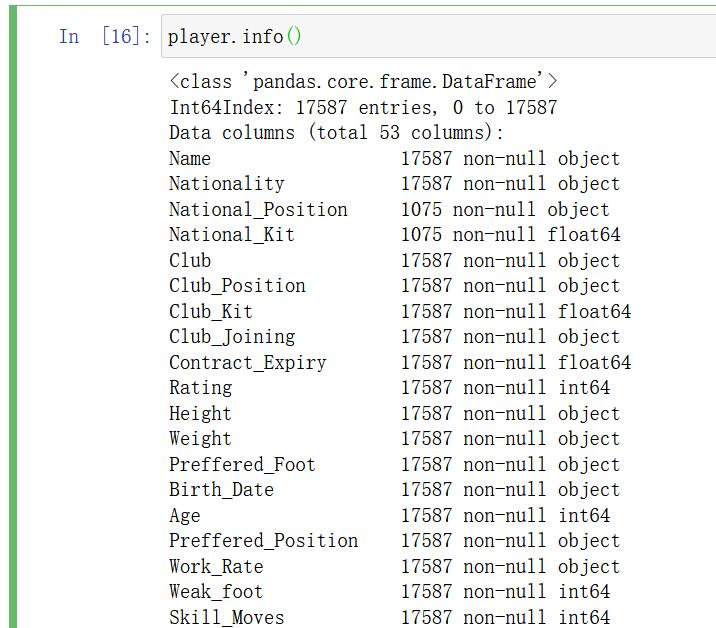
从查看数据结果可以看到运动员身高 Height、体重 Weight 的数据后都添加了相应的单位。
要分析运动员身高和体重的分布,首先需要将身高 Height 和 Weight 数据的单位去掉。
去掉 Height 和 Weight 数据的单位
player['Height'] = player['Height'].str.replace('cm','')
player['Weight'] = player['Weight'].str.replace('kg','')
player['Height'] = player['Height'].astype('int')
player['Weight'] = player['Weight'].astype('int')
display(player['Height'].head(),player['Weight'].head())
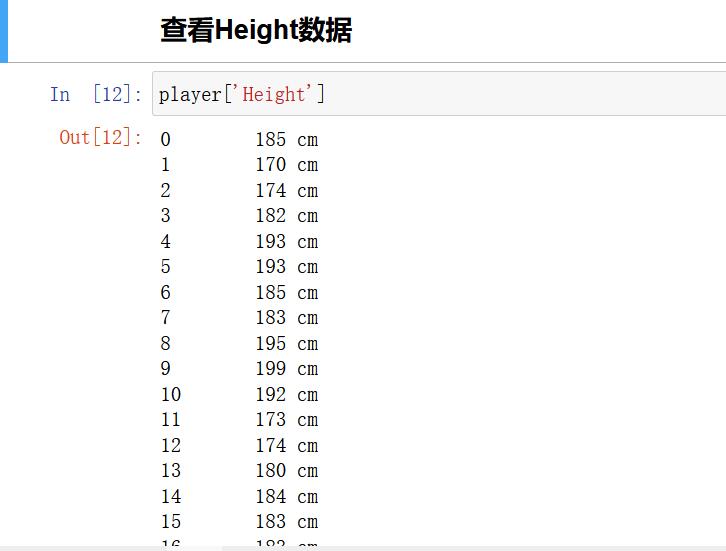
查看Height数据
player['Height']
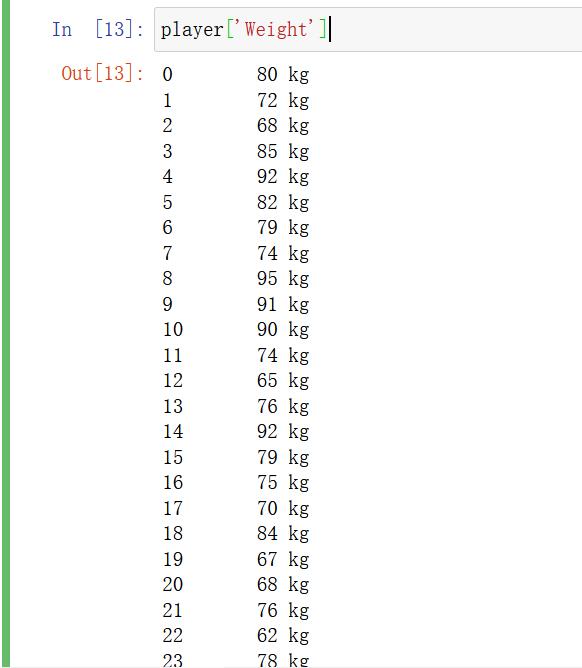
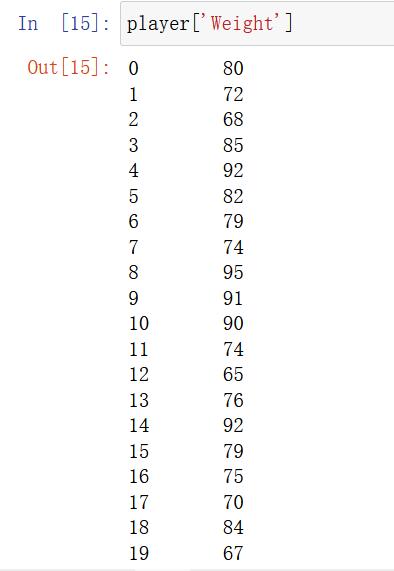
查看Weight数据
player['Weight']
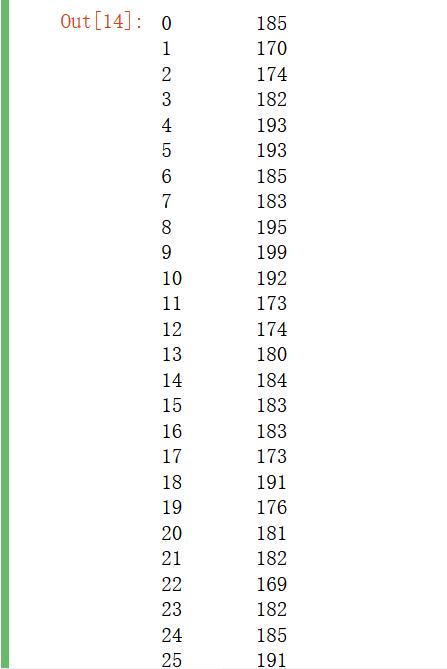
去掉身高和体重后面的单位

显示运动员数据信息
player.info()
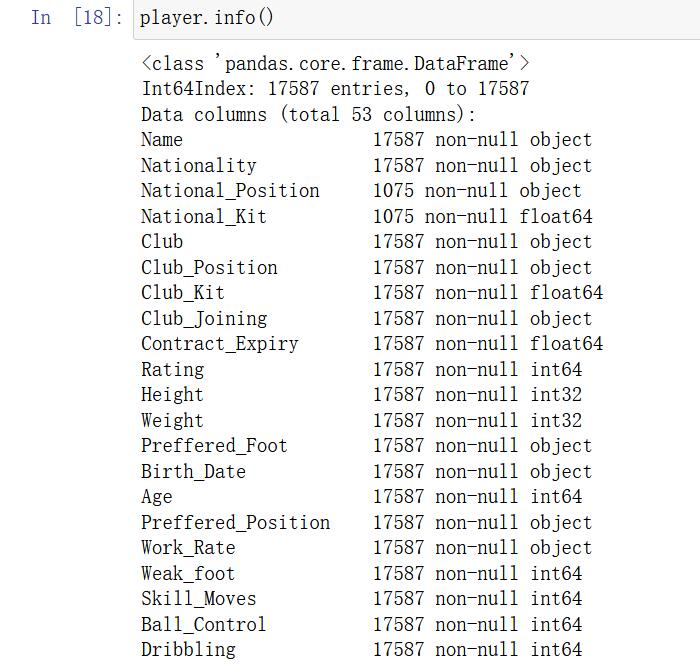
修改身高和体重的类型 object --int
player['Height'] = player['Height'].astype('int')
player['Weight'] = player['Weight'].astype('int')
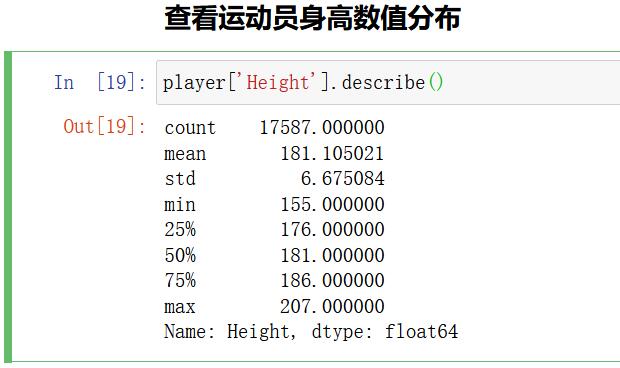
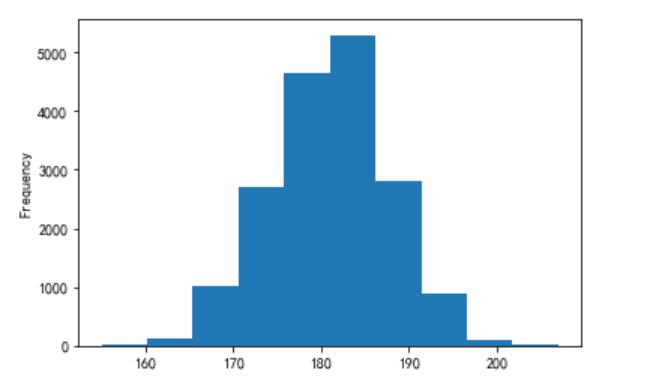
查看运动员 Height 数值分布
player['Height'].describe()
import matplotlib.pyplot as plt
#解决中文显示问题
plt.rcParams['font.sans-serif'] = ['KaiTi'] # 指定默认字体
plt.rcParams['axes.unicode_minus'] = False # 解决保存图像是负号'-'显示为方块的问题
# 使用直方图显示身高数值分布
player['Height'].plot(kind='hist')
查看运动员 Weight 数值分布
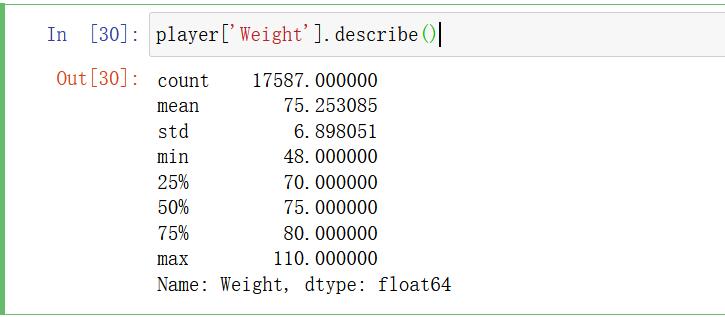
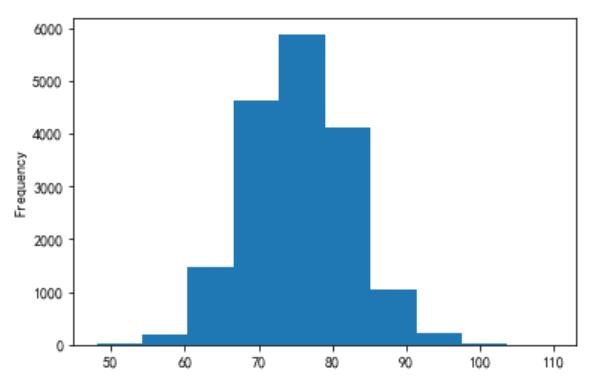
player['Weight'].describe()
player['Weight'].plot(kind='hist')
统计运动员左脚和右脚使用比例
查看足球运动员左脚右脚使用情况
player['Preffered_Foot'].head(10)
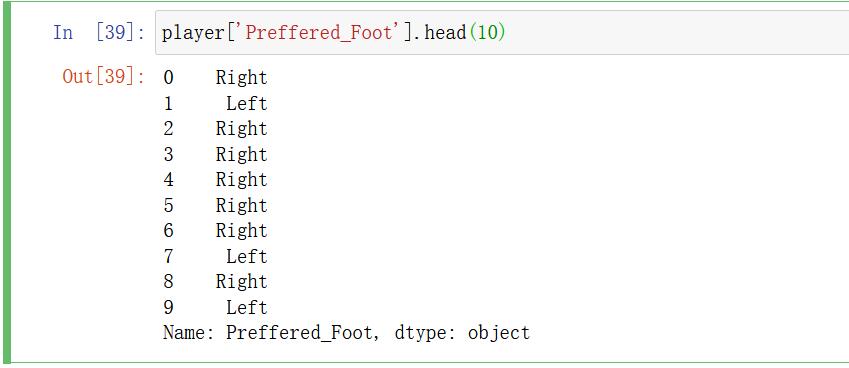
从上述示例可以看到,足球运动员踢球有使用左脚也有使用右脚。要统计使用左脚和右脚的数量,需要按 Preffered_Foot 进行分组,计算其 count() 值。我们可以使用饼状图来显示左脚右脚选手数量的差别。
使用饼状图来显示左脚右脚选手数量的差别
#按Preffered_Foot这列分组
player_g = player.groupby('Preffered_Foot')
player_c = player_g['Preffered_Foot'].count()
#使用饼状图显示
player_c.plot(kind='pie',autopct='%.2f')  # autopct显示比率
# player_c.plot(kind='pie')
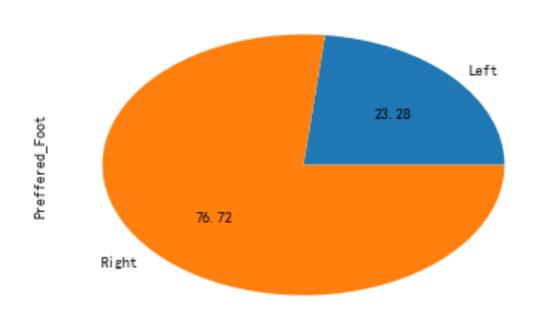
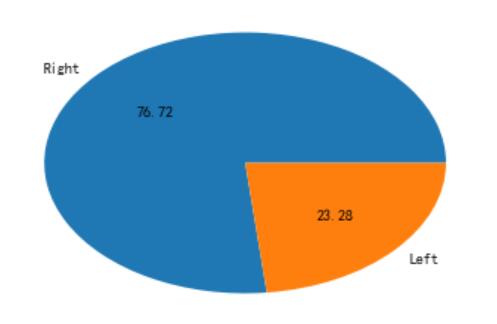
按某列分组计算 count() 值可以直接使用 value_counts() 方法,示例如下:
player_c = player['Preffered_Foot'].value_counts()
player_c.name=''
player_c.plot(kind='pie',autopct='%.2f')
相关性分析
通过散点图查看变量之间关系。
分析足球运动员的身高和体重是否相关
#分析身高和体重的相关性
player.plot(kind='scatter',x='Height',y='Weight')
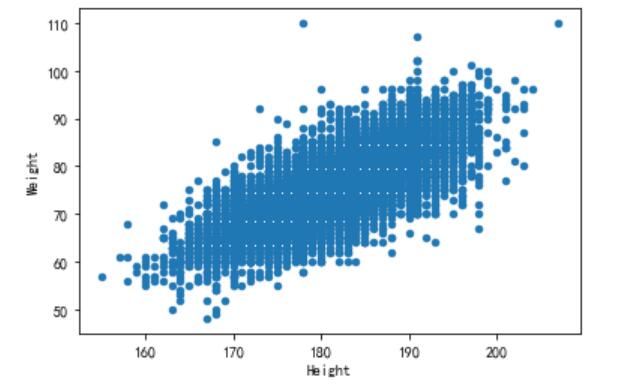
从上面示例可以看到,身高和体重有一定的相关性,身高越高体重越重。
分析足球运动员的身高和评分是否相关
player.plot(kind='scatter',x='Height',y='Rating') #分析身高和评分是否有关
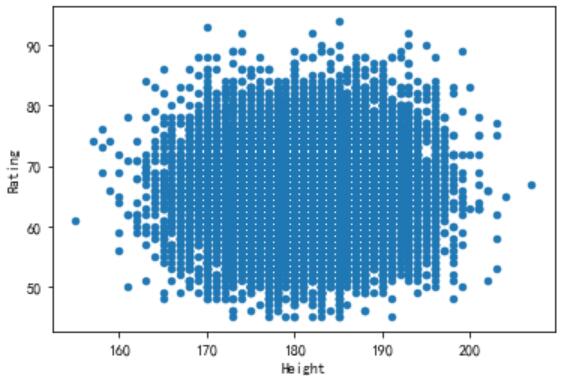
从上面示例可以看到,身高和评分并没有一定的相关性。查看两个变量是否有相关性,可以通过 corr()方法,该方法返回两个变量的相关系数值,相关系数值越大表示这两个变量相关性越强。相关系数的最大值为 1,即获变量自己和自己的相关系数就是 1。
通过相关系数查看两个变量是否相关
print('身高和身高相关系数:',player['Height'].corr(player['Height']))
print('身高和体重相关系统:',player['Height'].corr(player['Weight']))
print('身高和评分相关系统:',player['Height'].corr(player['Rating']))

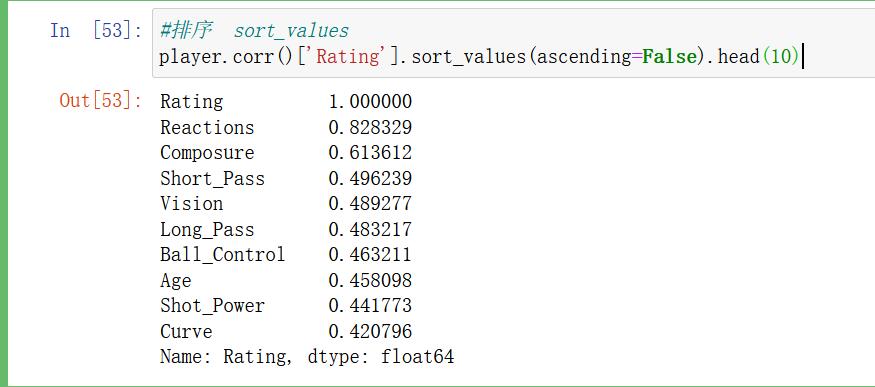
分析对评分影响前 10 的变量
player.corr()['Rating']
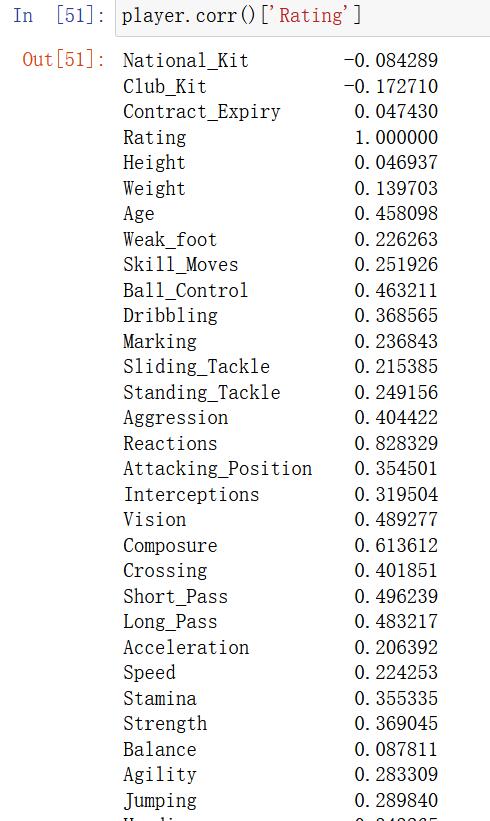
在上述示例中,首先获取影响评分的相关系数值,再对其进行排序。按照某列排序需要调用 sort_values() 方法,在 sort_values() 方法中通过 ascending 参数指定是升序还是降序。 ascending 参数默认值为 True,表示升序排序,如果想降序需要将 ascending 参数设置为 False。
#排序  sort_values
player.corr()['Rating'].sort_values(ascending=False).head(10)
感谢!努力!
加油啊!
以上是关于Pandas实战 足球运动员数据分析的主要内容,如果未能解决你的问题,请参考以下文章