吴恩达机器学习作业neural network _python实现
Posted 挂科难
tags:
篇首语:本文由小常识网(cha138.com)小编为大家整理,主要介绍了吴恩达机器学习作业neural network _python实现相关的知识,希望对你有一定的参考价值。
手写字体识别:
import matplotlib.pyplot as plt
import numpy as np
import scipy.io as scio
import matplotlib
import scipy.optimize as opt
path = 'ex3data1.mat'


def sigmoid(z):
    return 1 / (1 + np.exp(-z))


def cost(theta, X, y, learningRate):
    theta = np.mat(theta)
    X = np.mat(X)
    y = np.mat(y)
    first = np.multiply(-y, np.log(sigmoid(X * theta.T)))
    second = np.multiply((1 - y), np.log(1 - sigmoid(X * theta.T)))
    reg = (learningRate / (2 * len(X))) * np.sum(np.power(theta[:,1:theta.shape[1]], 2))
    return np.sum(first - second) / len(X) + reg


def gradient(theta, X, y, learningRate):
    theta = np.mat(theta)
    X = np.mat(X)
    y = np.mat(y)

    error = sigmoid(X * theta.T) - y

    grad = ((X.T * error) / len(X)).T + ((learningRate / len(X)) * theta)

    # intercept gradient is not regularized,截距梯度不是正则化的
    grad[0, 0] = np.sum(np.multiply(error, X[:, 0])) / len(X)

    return np.array(grad).ravel()


def plot_an_image(image):
#     """#绘图函数
#     image : (400,)
#     """
    fig, ax = plt.subplots(figsize=(1, 1))
    ax.matshow(image.reshape((20, 20)), cmap=matplotlib.cm.binary)#这是一个把矩阵或者数组绘制成图像的函数
    plt.xticks(np.array([]))  # just get rid of ticks
    plt.yticks(np.array([]))


def plot_100_image(X):
    """ sample 100 image and show them
    assume the image is square

    X : (5000, 400)
    """
    size = int(np.sqrt(X.shape[1]))#X.shape is 400
    # sample 100 image, reshape, reorg it
    sample_idx = np.random.choice(np.arange(X.shape[0]), 100)  # 100*400
    #np.arange(X.shape[0]),X.shape[0] is 5000,在产生0-4999一个列表。随机选100个
    sample_images = X[sample_idx, :]
    fig, ax_array = plt.subplots(nrows=10, ncols=10, sharey=True, sharex=True, figsize=(8, 8))
    for r in range(10):
        for c in range(10):
            ax_array[r, c].matshow(sample_images[10 * r + c].reshape((size, size)),
                                   cmap=matplotlib.cm.binary)
            plt.xticks(np.array([]))
            plt.yticks(np.array([]))
            #绘图函数,画100张图片


def one_vs_all(X, y, num_labels, learning_rate):
    row = X.shape[0]  # row 本列为5000
    column = X.shape[1]  # column 本列为 400

    all_theta = np.zeros((num_labels, column + 1))

    # 在截距项的开头插入一列1
    X = np.insert(X, 0, values=np.ones(row), axis=1)
    for i in range(1, num_labels + 1):  # i 从1到10
        theta = np.zeros(column + 1)  # 401
        y_i = np.array([1 if label == i else 0 for label in y])  # 向量化标签
        y_i = np.reshape(y_i, (row, 1))  # 5000行,1列,训练一个模型的theta,利用for循环训练了10个

        # minimize the objective function
        fmin = opt.minimize(fun=cost, x0=theta, args=(X, y_i, learning_rate), method='TNC', jac=gradient)
        all_theta[i - 1, :] = fmin.x  # 将训练好的数据模型放到all_theta中,共有10个

    return all_theta


def predict_all(X, all_theta):
    rows = X.shape[0]

    # same as before, insert ones to match the shape
    X = np.insert(X, 0, values=np.ones(rows), axis=1)

    # convert to matrices
    X = np.mat(X)
    all_theta = np.mat(all_theta)

    # compute the class probability for each class on each training instance
    h = sigmoid(X * all_theta.T)  #X 401行,all_theta.T有401列

    # create array of the index with the maximum probability
    h_argmax = np.argmax(h, axis=1)

    # because our array was zero-indexed we need to add one for the true label prediction
    h_argmax = h_argmax + 1

    return h_argmax

'''
#查看数据
X = data['X']
y = data['y']
pick_one = np.random.randint(0, 5000)#返回0~5000中任意一个整数
plot_an_image(X[pick_one, :])
plt.show()
print('this should be {}'.format(y[pick_one]))#在该标签中1~9,为数字1~9,0的标签是10

plot_100_image(X)
plt.show()
'''

data = scio.loadmat('ex3data1.mat')
row = data['X'].shape[0]  # 5000行,
column = data['X'].shape[1]  # 400列
all_theta = np.zeros((10, column + 1))
all_theta = one_vs_all(data['X'], data['y'], 10, 1)
y_pred = predict_all(data['X'], all_theta)
correct = [1 if a == b else 0 for (a, b) in zip(y_pred, data['y'])]  # 预测正确输出为1
accuracy = (sum(map(int, correct)) / float(len(correct)))
print ('accuracy = {0}%'.format(accuracy * 100))

scio.savemat('theta.mat', {'results': all_theta})  # 保存all_theta,
最终准确率达到了94.46%,本着严谨的态度,又自己写了20个数测试了一下。思路(已实现):先将上述代码中的all_theta保存,用自带画图软件写一个数字,保存本地后压缩成20*20像素,和训练集中的像素保持一致,再将图片转化为灰度图像,旋转垂直镜像后转为矩阵与保存的all_theta相乘,带入sigmoid函数,np.argmax得出结果。
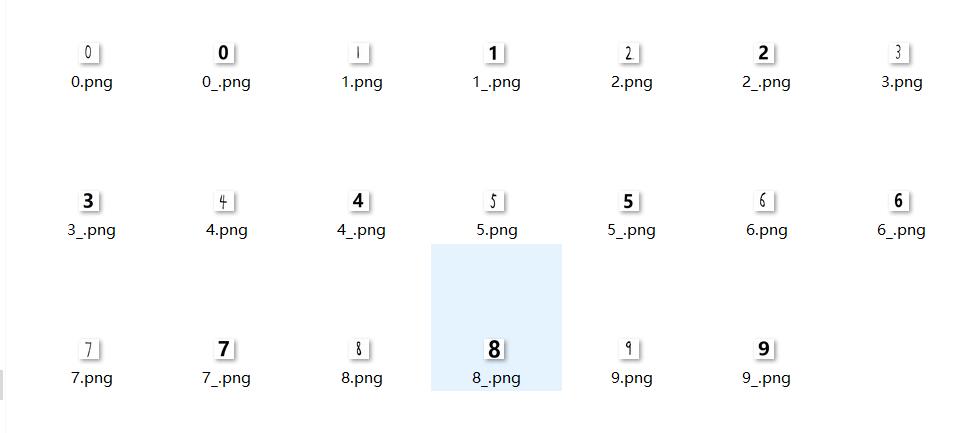
手写体用数字0 ~ 9命名,微软雅黑用0_ ~ 9_ 命名。结果只能说不是很理想。。。可能参数有点过拟合。(最多才对了6个,手写的对了四个。这结果实在不敢恭维)

测试:
from PIL import Image
import numpy as np
import scipy.io as scio
import matplotlib.pyplot as plt
import matplotlib
import cv2


def produceImage(file_in, width, height, file_out):
    image = Image.open(file_in)
    resized_image = image.resize((width, height), Image.ANTIALIAS)
    resized_image.save(file_out)


def sigmoid(z):
    return 1 / (1 + np.exp(-z))


def plot_an_image(image):
    fig, ax = plt.subplots(figsize=(1, 1))
    ax.matshow(image.reshape((20, 20)), cmap=matplotlib.cm.binary)  # 这是一个把矩阵或者数组绘制成图像的函数
    plt.xticks(np.array([]))  # just get rid of ticks
    plt.yticks(np.array([]))


for i in range(10):
    filename = 'image/'+str(i)+'.png'
    im = 255 - np.array(Image.open(filename).convert('L'))
    if im.shape != (20, 20):
        produceImage(filename, 20, 20, filename)
    im = 255 - np.array(Image.open(filename).convert('L').rotate(90))
    im = cv2.flip(im, 0, dst=None)  # 垂直镜像
    im = im.ravel()
    im = im.astype(float) / 255.0
    all_theta = scio.loadmat('theta.mat')
    all_theta = all_theta['results']
    im = np.mat(im)
    im2 = np.insert(im, 0, values=np.ones(1), axis=1)
    answer = sigmoid(im2 * all_theta.T)
    print(" i think this should be " + str(np.argmax(answer) + 1))
    plot_an_image(im)
    plt.show()
以上是关于吴恩达机器学习作业neural network _python实现的主要内容,如果未能解决你的问题,请参考以下文章