Java后端进行经纬度点抽稀聚合,HTML呈现及前端聚合实现点聚合~
Posted 程序媛一枚~
tags:
篇首语:本文由小常识网(cha138.com)小编为大家整理,主要介绍了Java后端进行经纬度点抽稀聚合,HTML呈现及前端聚合实现点聚合~相关的知识,希望对你有一定的参考价值。
Java后端进行经纬度点抽稀聚合,html呈现及前端聚合实现点聚合~
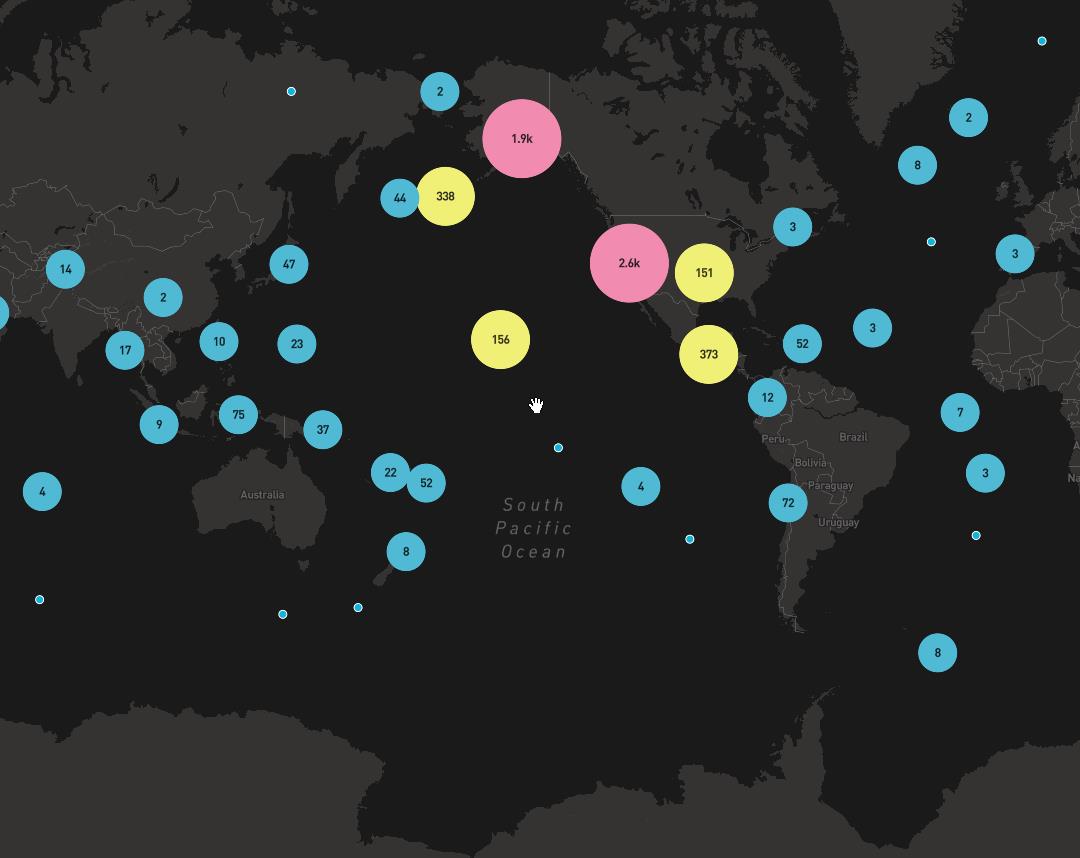
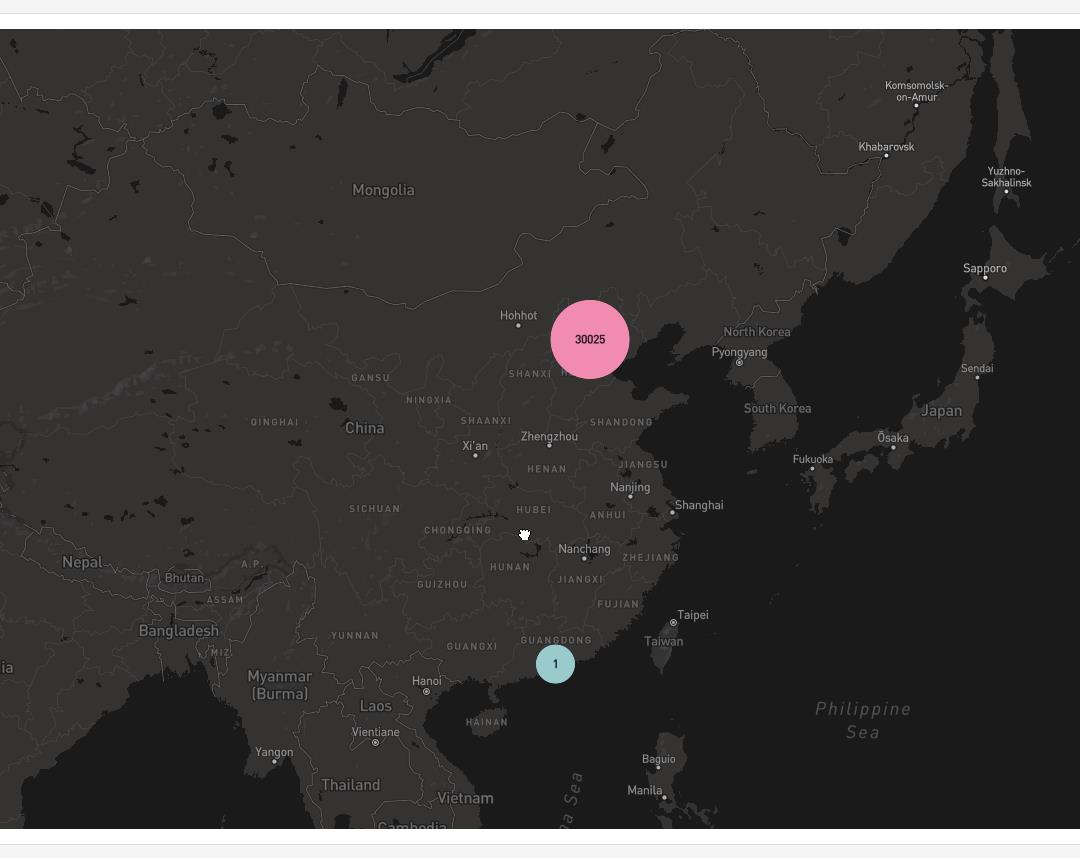
1. 效果图~
1.1 前端实现聚合及呈现

1.2 后端实现点聚合,前端渲染呈现效果图

2. 原理
- 构建测试数据
- 依赖前端传递的参数:bounds、mPXInMeters、zoom;分别是窗口的可视经纬度范围、单位像素距离、地图级别;
{“level”: 0, “resolution”: 156543.033928},
{“level”: 1, “resolution”: 78271.5169639999},
{“level”: 2, “resolution”: 39135.7584820001},
{“level”: 3, “resolution”: 19567.8792409999},
{“level”: 4, “resolution”: 9783.93962049996},
{“level”: 5, “resolution”: 4891.96981024998},
{“level”: 6, “resolution”: 2445.98490512499},
{“level”: 7, “resolution”: 1222.99245256249},
{“level”: 8, “resolution”: 611.49622628138},
{“level”: 9, “resolution”: 305.748113140558},
{“level”: 10, “resolution”: 152.874056570411},
{“level”: 11, “resolution”: 76.4370282850732},
{“level”: 12, “resolution”: 38.2185141425366},
{“level”: 13, “resolution”: 19.1092570712683},
{“level”: 14, “resolution”: 9.55462853563415},
{“level”: 15, “resolution”: 4.77731426794937},
{“level”: 16, “resolution”: 2.38865713397468},
{“level”: 17, “resolution”: 1.19432856685505},
{“level”: 18, “resolution”: 0.597164283559817}
- 后端可以设置多少个像素聚合;
3. 源码
3.1 前端JS实现点聚合及呈现源码
<!DOCTYPE html>
<html>
<head>
    <meta charset='utf-8' />
    <title>创建样式聚类</title>
    <meta name='viewport' content='initial-scale=1,maximum-scale=1,user-scalable=no' />
    <script src='https://api.tiles.mapbox.com/mapbox-gl-js/v1.1.1/mapbox-gl.js'></script>
    <link href='https://api.tiles.mapbox.com/mapbox-gl-js/v1.1.1/mapbox-gl.css' rel='stylesheet' />
    <style>
        body { margin:0; padding:0; }
        #map { position:absolute; top:0; bottom:0; width:100%; }
    </style>
</head>
<body>


<div id='map'></div>

<script>
mapboxgl.accessToken = 'pk.eyJ1IjoiemhhbmcyMDIxIiwiYSI6ImNrbGthdmFvbDM0cTMyb3M2eXFiODR5d3QifQ.ow97I1ikb9zlP3p9qmFuBQ';
var map = new mapboxgl.Map({
    container: 'map',
    style: 'mapbox://styles/mapbox/dark-v10',
    center: [-103.59179687498357, 40.66995747013945],
    zoom: 3
});

map.on('load', function() {
    // Add a new source from our GeoJSON data and set the
    // 'cluster' option to true. GL-JS will add the point_count property to your source data.
    map.addSource("earthquakes", {
        type: "geojson",
        // Point to GeoJSON data. This example visualizes all M1.0+ earthquakes
        // from 12/22/15 to 1/21/16 as logged by USGS' Earthquake hazards program.
        data: "https://docs.mapbox.com/mapbox-gl-js/assets/earthquakes.geojson",
        cluster: true,
        clusterMaxZoom: 14, // Max zoom to cluster points on
        clusterRadius: 50 // Radius of each cluster when clustering points (defaults to 50)
    });

    map.addLayer({
        id: "clusters",
        type: "circle",
        source: "earthquakes",
        filter: ["has", "point_count"],
        paint: {
            // Use step expressions (https://docs.mapbox.com/mapbox-gl-js/style-spec/#expressions-step)
            // with three steps to implement three types of circles:
            //   * Blue, 20px circles when point count is less than 100
            //   * Yellow, 30px circles when point count is between 100 and 750
            //   * Pink, 40px circles when point count is greater than or equal to 750
            "circle-color": [
                "step",
                ["get", "point_count"],
                "#51bbd6",
                100,
                "#f1f075",
                750,
                "#f28cb1"
            ],
            "circle-radius": [
                "step",
                ["get", "point_count"],
                20,
                100,
                30,
                750,
                40
            ]
        }
    });

    map.addLayer({
        id: "cluster-count",
        type: "symbol",
        source: "earthquakes",
        filter: ["has", "point_count"],
        layout: {
            "text-field": "{point_count_abbreviated}",
            "text-font": ["DIN Offc Pro Medium", "Arial Unicode MS Bold"],
            "text-size": 12
        }
    });

    map.addLayer({
        id: "unclustered-point",
        type: "circle",
        source: "earthquakes",
        filter: ["!", ["has", "point_count"]],
        paint: {
            "circle-color": "#11b4da",
            "circle-radius": 4,
            "circle-stroke-width": 1,
            "circle-stroke-color": "#fff"
        }
    });

    // inspect a cluster on click
    map.on('click', 'clusters', function (e) {
        var features = map.queryRenderedFeatures(e.point, { layers: ['clusters'] });
        var clusterId = features[0].properties.cluster_id;
        map.getSource('earthquakes').getClusterExpansionZoom(clusterId, function (err, zoom) {
            if (err)
                return;

            map.easeTo({
                center: features[0].geometry.coordinates,
                zoom: zoom
            });
        });
    });

    map.on('mouseenter', 'clusters', function () {
        map.getCanvas().style.cursor = 'pointer';
    });
    map.on('mouseleave', 'clusters', function () {
        map.getCanvas().style.cursor = '';
    });
});
</script>

</body>
</html>
3.2 后端点聚合(返回geojson)及前端自实现渲染源码
/**
 * @param visibleBounds 屏幕的范围 前端传
 * @param list          所有的点数据
 * @param mClusters     聚合后的数据集合
 * @param isLattice     是否是方格和距离的算法 , 是 方格和距离的算法   , 否 距离算法
 * @return
 */
private static void calculateOrgClusters(LatLngBounds visibleBounds, List<Map<String, Object>> list, List<Cluster> mClusters, double mClusterDistance, Integer zoom, boolean isLattice) {
    mIsCanceled = false;
    mClusters.clear();
    ClusterItem clusterItem = new RegionItem();
    LatLng mLatLng;
    for (int i = 0; i < list.size(); i++) {
        Map<String, Object> data = list.get(i);
        mLatLng = new LatLng(Double.parseDouble(data.get("lat").toString()), Double.parseDouble(data.get("lng").toString()));
        clusterItem = new RegionItem(mLatLng, data);
        if (mIsCanceled) {
            return;
        }
        LatLng latlng = clusterItem.getPosition();
        if (visibleBounds.contains(latlng)) {
            Cluster cluster = null;
            if (isLattice) {
                // 方格和距离的算法
                cluster = getClusterFangGe(latlng, mClusters);
            } else {
                // 距离算法
                cluster = getCluster(latlng, mClusters, mClusterDistance, zoom);
            }

            if (cluster != null) {
                cluster.addCount();
            } else {
                cluster = new Cluster(latlng);
                mClusters.add(cluster);
                cluster.addClusterItem(clusterItem);
                cluster.addCount();
                cluster.setMap(data);
                // 设置中心点的范围
                if (isLattice) {
                    LatLngBounds latLngBounds = AMapUtils.getAround(latlng, mClusterDistance);
                    cluster.setLatLngBounds(latLngBounds);
                }
            }
        }
    }
}
<!DOCTYPE html>
<html>
<head>
<meta charset='utf-8'/>
<meta http-equiv="X-UA-Compatible" content="IE=edge">
<meta name="viewport" content="width=device-width, initial-scale=1">
<meta name='viewport' content='initial-scale=1,maximum-scale=1,user-scalable=no'/>
<!--本地加载的js及css文件-->
<script src='https://api.tiles.mapbox.com/mapbox-gl-js/v1.1.1/mapbox-gl.js'></script>
<link href='https://api.tiles.mapbox.com/mapbox-gl-js/v1.1.1/mapbox-gl.css' rel='stylesheet'/>
<script src="https://apps.bdimg.com/libs/jquery/2.1.4/jquery.min.js"></script>
<link rel="stylesheet" href="https://cdn.jsdelivr.net/npm/bootstrap@3.3.7/dist/css/bootstrap.min.css"
integrity="sha384-BVYiiSIFeK1dGmJRAkycuHAHRg32OmUcww7on3RYdg4Va+PmSTsz/K68vbdEjh4u" crossorigin="anonymous">
<style>
#m_infobar {
position: absolute;
bottom: 100px;
left: 20px;
width: 200px;
height: 200px;
overflow: auto;
z-index: 201;
background: greenyellow;
padding-left: 10px;
}
#menu {
background: #fff;
position: absolute;
z-index: 1;
top: 70px;
right: 50px;
border-radius: 3px;
width: 120px;
border: 1px solid rgba(0, 0, 0, 0.4);
font-family: 'Open Sans', sans-serif;
}
#menu a {
font-size: 13px;
color: #404040;
display: block;
margin: 0;
padding: 0;
padding: 10px;
text-decoration: none;
border-bottom: 1px solid rgba(0, 0, 0, 0.25);
text-align: center;
}
#menu a:last-child {
border: none;
}
#menu a:hover {
background-color: #f8f8f8;
color: #404040;
}
#menu a.active {
background-color: #3887be;
color: #ffffff;
}
#menu a.active:hover {
background: #3074a4;
}
</style>
</head>
<body style="height: 100%;">
<div class="panel panel-default">
<div class="panel-heading">
<div class="row">
<div class="col-md-4"><strong>Geojson后端聚合轨迹点</strong></div>
<div class="col-md-8"><label id="i_click"></label></div>
</div>
</div>
<div class="panel-body">
<nav id="menu"></nav>
<div id="map" style="width: 100%; height: 800px;">
<div id='m_infobar'>
<div id="tooltip-name"></div>
<div id='tooltip'></div>
</div>
</div>
</div>
<div class="panel-footer" style="bottom: 0px;">
<div class="row">
<div class="col-xs-4"><label id="i_coordinate"></label></div>
<div class="col-xs-8"><label id="i_show"></label></div>
</div>
</div>
</div>
<script>
mapboxgl.accessToken = 'pk.eyJ1IjoiemhhbmcyMDIxIiwiYSI6ImNrbGthdmFvbDM0cTMyb3M2eXFiODR5d3QifQ.ow97I1ikb9zlP3p9qmFuBQ';
var map = new mapboxgl.Map({
resizeEnable: true,
container: 'map',
style: 'mapbox://styles/mapbox/dark-v10',
center: [105, 34],
zoom: 4
});
map.on('load', function () {
// Add a new source from our GeoJSON data and set the
// 'cluster' option to true. GL-JS will add the mag property to your source data.
map.addSource("earthquakes", {
type: "geojson",
// Point to GeoJSON data. This example visualizes all M1.0+ earthquakes
// from 12/22/15 to 1/21/16 as logged by USGS' Earthquake hazards program.
// data: "https://docs.mapbox.com/mapbox-gl-js/assets/earthquakes.geojson",
// 只需修改数据来源~~
data: "/geo?bounds=" + map.getBounds().toString().replaceAll('LngLat', '').replace('Bounds', '').replace('),', ';').replaceAll('(', 以上是关于Java后端进行经纬度点抽稀聚合,HTML呈现及前端聚合实现点聚合~的主要内容,如果未能解决你的问题,请参考以下文章
点云下采样/抽稀python-pcl:pcl::VoxelGrid::applyFilter
用eclipse开发前端页面html+js,并与php开发的后端进行交换,请教如何在eclipse上配置环境及服务器