python机器学习手写算法系列——RANSAC(随机抽样一致)回归
Posted 有数可据
tags:
篇首语:本文由小常识网(cha138.com)小编为大家整理,主要介绍了python机器学习手写算法系列——RANSAC(随机抽样一致)回归相关的知识,希望对你有一定的参考价值。
本文旨在通过在最简单的一元一次方程中运用RANSAC,编写代码,来学习RANSAC算法。
RANSAC算法
RANSAC[1]算法,全程是Random Sample Consensus(随机抽样一致)。它采用迭代的方式从一组包含outliers的数据中估算出回归模型。RANSAC是一个非确定性算法,因为它是“随机抽样”的。
它原来是计算机视觉的算法,后来被用来做线性回归。
RANSAC回归用最少的数据点训练模型,基本算法总结如下:
- 选取的最少的数据点,作为样本。
- 用样本和基础回归器训练模型。
- 根据 ϵ \\epsilon ϵ,选出inliers和outliers
- 如果inliers的数量达到了阈值 τ \\tau τ,用inliers和基础回归器训练模型
- 判断终止条件。达到,退出。否则,返回1。(最多 N N N次)
迭代次数
N
N
N,表示在
N
N
N次迭代以后,至少有一次迭代,任意选取的
m
m
m个点,都是inliers的概率是
p
p
p(通常为0.99)。如果inliers的比例是
u
u
u,我们就有以下公式。
1
−
p
=
(
1
−
u
m
)
N
1-p=(1-u^m)^N
1−p=(1−um)N
变换后得到:
N
=
l
o
g
(
1
−
p
)
l
o
g
(
1
−
u
m
)
N = \\frac{log(1-p)}{log(1-u^m)}
N=log(1−um)log(1−p)
其实,这里我有个疑问。就算,我选择的两个点都是inliers,也无法保证他们他们组成的直线能够穿过其他的inliers。这个就说到RANSAC的原始用途了
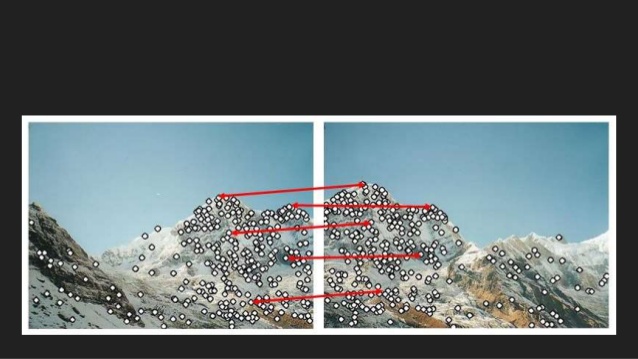
在原始的RANSAC算法里,所谓的样本,是指两张照片上面的相同点。如果找到了这样的样本,当然就可以确定他们之间的向量了。但是回归不是这么回事。如果我的inliers比例是95%,那么
N
=
l
o
g
(
1
−
0.99
)
l
o
g
(
1
−
0.9
5
2
)
=
l
o
g
(
0.01
)
l
o
g
(
1
−
0.9025
)
=
−
2
l
o
g
(
0.0975
)
=
−
2
−
1.01
=
2
N = \\frac{log(1-0.99)}{log(1-0.95^2)} = \\frac{log(0.01)}{log(1-0.9025)} = \\frac{-2}{log(0.0975)}=\\frac{-2}{-1.01}=2
N=log(1−0.952)log(1−0.99)=log(1−0.9025)log(0.01)=log(0.0975)−2=−1.01−2=2
3次就能找到模型了?这个答案,我们要去看Scikit-Learn的源代码。
Scikit-Learn中的RANSAC算法
Talk is cheap, show me the code. 为了弄明白RANSAC的具体实现,我找到了sklearn的RANSAC[2]。通过其源代码,可以了解其具体实现。
第一步,选取数据点。sklearn的默认值是X.shape[1] + 1。我们的手写代码是一元一次方程,所以,对于我们来说,这个值就是2。
第二步,用样本训练模型。这里,我们的样本数量是2,可以直接用两点决定一条直线的方法,确定这个模型。
第三步,根据
ϵ
\\epsilon
ϵ,选出inliers和outliers。这里scikit-learn把
ϵ
\\epsilon
ϵ叫做residual_threshold,其默认值是MAD (median absolute deviation,偏差的绝对值的中位数)
第四步,如果inliers的数量达到了阈值 τ \\tau τ,用inliers和基础回归器训练模型。这里,Scikit-Learn是默认是没有阈值的。(你可以传一个函数进去,这个函数的默认值是None)。我们这里就设置成50%。也就是说,至少50%的点都是inliers,才用他们训练模型。
第五步,终止条件。这里,Scikit-Learn用的是动态值,也就是说,inliers的比例 u u u,是随着找到的inliers的数量变化的。这时,即使我们找到的两个点,都是inliers,但是他们组成的直线却和真实值大相径庭,也不用担心。因为这时的 u u u很小,所以 N N N,比较大。随着我们找到越来越多的inliers, u u u变大,相应的 N N N变小。
手写RANSAC算法
通过几篇文章和scikit-learn的源代码,大致对RANSAC有所了解了。接下来就是通过自己写算法来验证自己的理解。
Scikit Learn示例
首先,我们复用scikit-learn的示例。
https://scikit-learn.org/stable/auto_examples/linear_model/plot_ransac.html
import numpy as np
from matplotlib import pyplot as plt

from sklearn import linear_model, datasets


n_samples = 1000
n_outliers = 50


X, y, coef = datasets.make_regression(n_samples=n_samples, n_features=1,
                                      n_informative=1, noise=10,
                                      coef=True, random_state=0)

# Add outlier data
np.random.seed(0)
X[:n_outliers] = 3 + 0.5 * np.random.normal(size=(n_outliers, 1))
y[:n_outliers] = -3 + 10 * np.random.normal(size=n_outliers)

# Fit line using all data
lr = linear_model.LinearRegression()
lr.fit(X, y)

# Robustly fit linear model with RANSAC algorithm
ransac = linear_model.RANSACRegressor()
ransac.fit(X, y)
inlier_mask = ransac.inlier_mask_
outlier_mask = np.logical_not(inlier_mask)

# Predict data of estimated models
line_X = np.arange(X.min(), X.max())[:, np.newaxis]
line_y = lr.predict(line_X)
line_y_ransac = ransac.predict(line_X)

# Compare estimated coefficients
print("Estimated coefficients (true, linear regression, RANSAC):")
print(coef, lr.coef_, ransac.estimator_.coef_)

lw = 2
plt.scatter(X[inlier_mask], y[inlier_mask], color='yellowgreen', marker='.',
            label='Inliers')
plt.scatter(X[outlier_mask], y[outlier_mask], color='gold', marker='.',
            label='Outliers')
plt.plot(line_X, line_y, color='navy', linewidth=lw, label='Linear regressor')
plt.plot(line_X, line_y_ransac, color='cornflowerblue', linewidth=lw,
         label='RANSAC regressor')
plt.legend(loc='lower right')
plt.xlabel("Input")
plt.ylabel("Response")
plt.show()
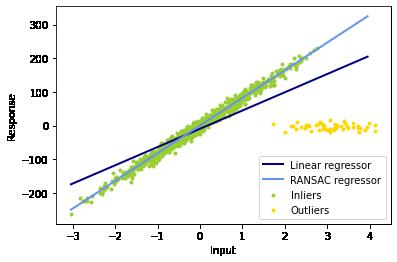
接着,我们就可以手写算法了。
探索
我们先计算阈值 ϵ \\epsilon ϵ,也就是scikit-learn里面的residual_threshold
from scipy import stats
import numba
residual_threshold = stats.median_abs_deviation(y)
print(f"Residual threshold is {residual_threshold}.")
接着,我们取两个outliers,两个inliers,以及分别取一个。
探索代码:
n_samples = len(y)

@numba.njit()
def one_run(i, j):
    # build a model with Point I and Point J
    slope = (y[i] - y[j]) / (X[i][0] - X[j][0])
    # y = ax + b
    # b = y - ax
    intercept = y[i] - slope * X[i][0]

    # Count number of inliers

    inliers = []
    for k in range(n_samples):
        y_hat = slope * X[k][0] + intercept
        if y[k] > y_hat - residual_threshold and y[k] < y_hat + residual_threshold:
            inliers.append(k)

    return slope, intercept, inliers

def plot_one_run(i, j):
    slope, intercept, inliers = one_run(i, j)
    print(f"Slope: {slope}, Intercept: {intercept}, and #Inliers: {len(inliers)}")
    y_hat = [slope * x[0] + intercept for x in X]
    y_upper = y_hat - residual_threshold
    y_lower = y_hat + residual_threshold

    plt.figure(figsize=(10, 6))
    plt.scatter(X[inlier_mask], y[inlier_mask], color='yellowgreen', marker='.',
                label='Inliers')

    plt.scatter(X[outlier_mask], y[outlier_mask], color='gold', marker='.',
                label='Outliers')

    plt.plot(X, y_hat, color='purple', label="fitted line by samples")
    plt.plot(X, y_upper, "--", color='blue', label="upper bound")
    plt.plot(X, y_lower, "--", color='blue', label="lower bound")

    if len(inliers)>500:
        X_inliers = X[inliers]
        y_inliers = y[inliers]
        base_estimator = linear_model.LinearRegression()
        base_estimator.fit(X_inliers, y_inliers)
        y_hat = base_estimator.predict(X)
        plt.plot(X, y_hat, color='black', label="fitted line by inliers")

    plt.scatter(X[[i,j]], y[[i,j]], color='red', marker='o',
                label='sample points')
    plt.legend()
    plt.show()
两个outliers
plot_one_run(1, 2)
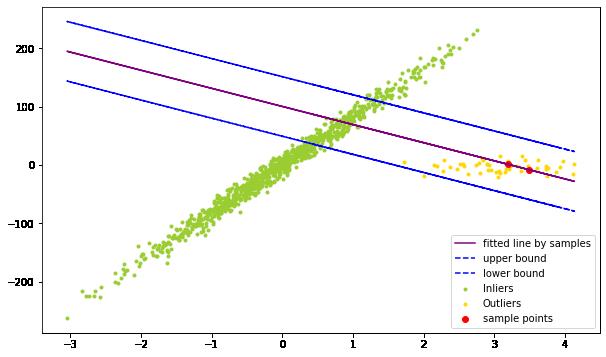
图中的两个红点为样本点。紫色的线为用样本训练的模型,蓝色为inliers的上下界。我们看到,这里找到的inliers很少,不足一半,所以我们并没用inliers训练模型。
两个inliers
plot_one_run(100, 200)
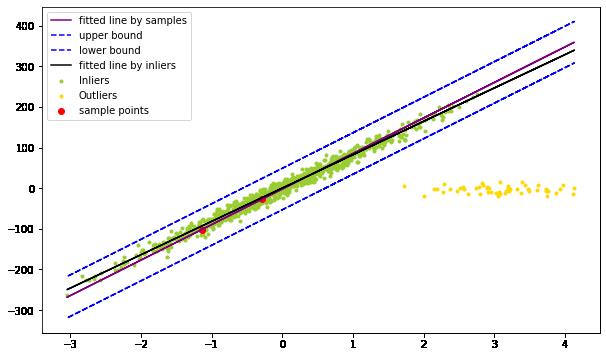
这里,我们看到,绝大多数的点被分类成为inliers,所以,我们就训练了模型(黑线)。
plot_one_run(100, 54)
当然,就算他们都是inliers,也无济于事。如下图:
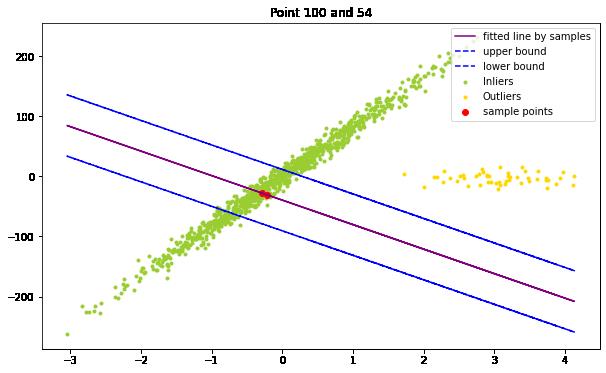
一个inlier和一个outlier
plot_one_run(1, 200)

算法
最后,我们得到了RANSAC算法:
import random

# this is copied from sklearn:
# https://github.com/scikit-learn/scikit-learn/blob/2beed5584/sklearn/linear_model/_ransac.py#L23
_EPSILON = np.spacing(1)
def dynamic_max_trials(n_inliers, n_samples, min_samples, probability):
    """Determine number trials such that at least one outlier-free subset is
    sampled for the given inlier/outlier ratio.
    Parameters
    ----------
    n_inliers : int
        Number of inliers in the data.
    n_samples : int
        Total number of samples in the data.
    min_samples : int
        Minimum number of samples chosen randomly from original data.
    probability : float
        Probability (confidence) that one outlier-free sample is generated.
    Returns
    -------
    trials : int
        Number of trials.
    """
    inlier_ratio = n_inliers / float(n_samples)
    nom = max(_EPSILON, 1 - probability)
    denom = max(_EPSILON, 1 - inlier_ratio ** min_samples)
    if nom == 1:
        return 0
    if denom == 1:
        return float('inf')
    return abs(float(np.ceil(np.log(nom) / np.log(denom))))

@numba.njit()
def get_model_inliers(i, j):
    # build a model with Point I and Point J
    slope = (y[i] - y[j]) / (X[i][0] - X[j][0])
    # y = ax + b
    # b = y - ax
    intercept = y[i] - slope * X[i][0]

    # Count number of inliers

    inliers = []
    for k in range(n_samples):
        y_hat = slope * X[k][0] + intercept
        if y[k] > y_hat - residual_threshold and y[k] < y_hat + residual_threshold:
            inliers.append(k)

    return slope, intercept, inliers

@numba.njit()
def sampling():
    i = random.randint(0, len(y))
    j = random.randint(0, len(y))
    while i == j:
        j = random.randint(0, len(y))
    if j>i:
        i, j=j, i
    return i, j

def ransac(X, y):
    n_samples = len(y)
    max_n_inliers = 0
    best_slope = 0
    best_intercept = 0
    best_inliers = []
    iterations = 0
    best_model = None
    best_score = 0
    N = 100
    while iterations < N:
        print(f"-----------------------------iterations {iterations}----------------------------")
        i, j = sampling()
        slope, intercept, inliers = get_model_inliers(i, j)
        if len(inliers) > len(best_inliers):
            best_inliers = inliers
            best_slope = slope
            best_intercept = intercept

        iterations += 1

        if len(inliers)>500:
            X_inliers = X[inliers]
            y_inliers = y[inliers]
            model = linear_model.LinearRegression()
            model.fit(X_inliers, y_inliers)
            score = model.score(X_inliers, y_inliers)
            if score > best_score:
                print(iterations, score)
                best_model = model
                best_score = score

        N = dynamic_max_trials(len(best_inliers), 1000, 2, 0.99)
        print(f"#n_liers: {len(inliers)}, #best_n_inliers: {len(best_inliers)}, best score: {best_score}")

    print(f"quit after {iterations} iterations")

    return best_model, best_inliers
运行
final_model, best_inliers = ransac(X, y)
输出
-----------------------------iterations 0----------------------------
1 0.9793338725607942
#n_liers: 842, #best_n_inliers: 842, best score: 0.9793338725607942
-----------------------------iterations 1----------------------------
#n_liers: 129, #best_n_inliers: 842, best score: 0.9793338725607942
-----------------------------iterations 2----------------------------
#n_liers: 633, #best_n_inliers: 842, best score: 0.9793338725607942
-----------------------------iterations 3----------------------------
4 0.9848858721264135
#n_liers: 950, #best_n_inliers: 950, best score: 0.9848858721264135
quit after 4 iterations
实测和scikit-learn的RANSAC算法的结果一致:
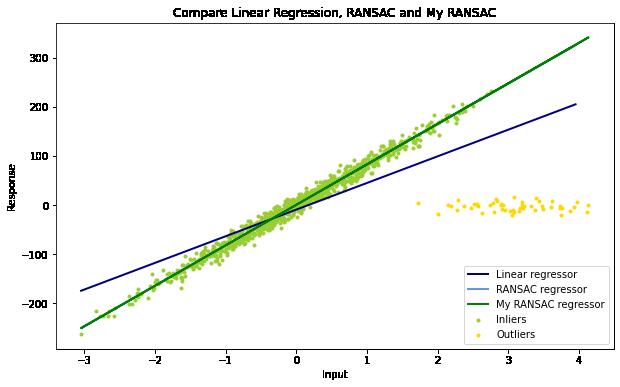
源代码地址:
https://github.com/EricWebsmith/machine_learning_from_scrach/blob/master/ransac.ipynb
或者访问:
引用
[1] M.A. Fischler and R.C. Bolles. Random sample consensus: A paradigm for model
fitting with applications to image analysis and automated cartography. Communications
of the ACM, 24(6):381–395, 1981.
[2] Sklearn 中的RACSAC
以上是关于python机器学习手写算法系列——RANSAC(随机抽样一致)回归的主要内容,如果未能解决你的问题,请参考以下文章