python(matplotlib)三维图像绘制,旋转坐标轴视角,坐标轴拉伸,缩放比例
Posted 小乖乖的臭坏坏
tags:
篇首语:本文由小常识网(cha138.com)小编为大家整理,主要介绍了python(matplotlib)三维图像绘制,旋转坐标轴视角,坐标轴拉伸,缩放比例相关的知识,希望对你有一定的参考价值。
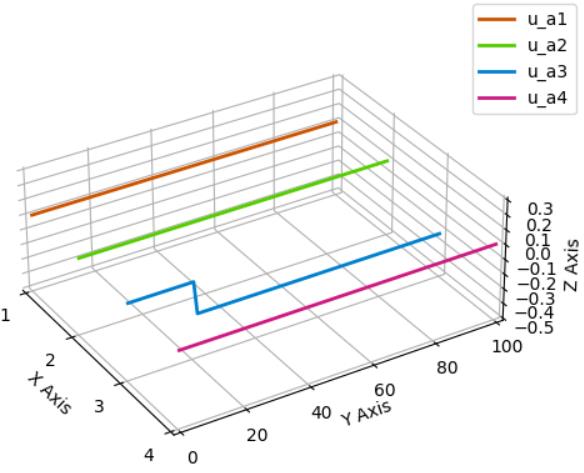
先上最终效果图:
根据最常规的代码,我们得到的初始效果应该是下图:
import numpy as np
import matplotlib.pyplot as plt

xs1 = np.ones(100)
ys1 = range(1, 101)
zs1 = np.zeros(100)

xs2 = np.ones(100) * 2
ys2 = range(1, 101)
zs2 = np.zeros(100)

xs3 = np.ones(100) * 3
ys3 = range(1, 101)
zs3 = np.zeros(100)
for i in range(21, 100):
  zs3[i] = -0.22

xs4 = np.ones(100) * 4
ys4 = range(1, 101)
zs4 = np.zeros(100)


# Plot
from mpl_toolkits.mplot3d import Axes3D
fig = plt.figure()
ax = Axes3D(fig)
ax.plot(xs1, ys1, zs1, lw=2, color=[0.8, 0.33, 0])
ax.plot(xs2, ys2, zs2, lw=2, color=[0.33, 0.8, 0])
ax.plot(xs3, ys3, zs3, lw=2, color=[0, 0.5, 0.8])
ax.plot(xs4, ys4, zs4, lw=2, color=[0.8, 0.1, 0.5])
ax.set_xlabel("X Axis")
ax.set_ylabel("Y Axis")
ax.set_zlabel("Z Axis")
ax.set_title("Addective fault simulation")
plt.show()
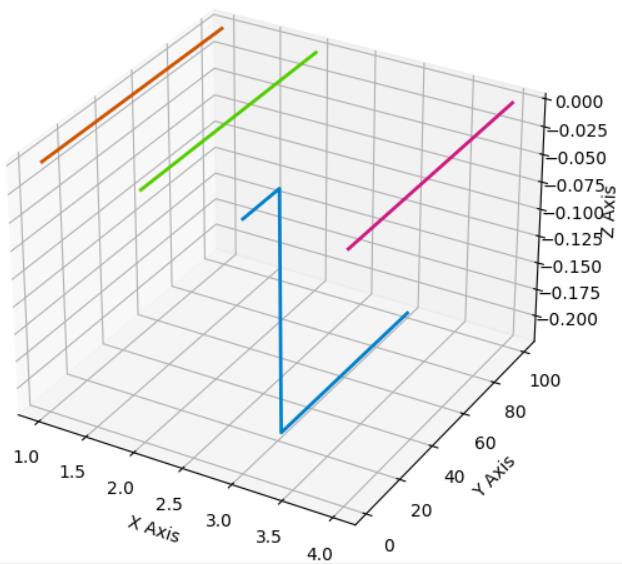
————————————————————————————
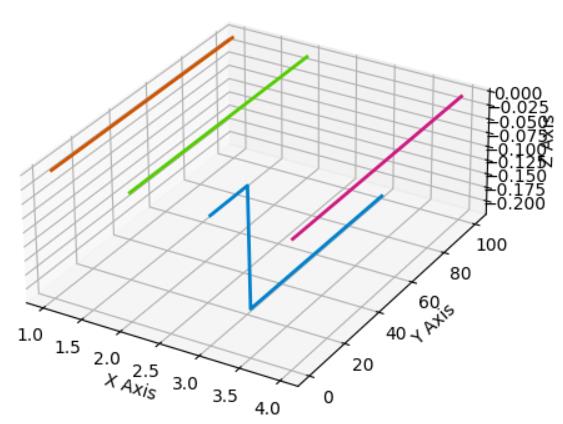
首先,这个坐标轴看着很不美观,想要把坐标轴拉伸一下。让z轴变扁一点,y轴变长一点。
解决方案:
#前3个参数用来调整各坐标轴的缩放比例
ax.get_proj = lambda: np.dot(Axes3D.get_proj(ax), np.diag([0.8, 1, 0.5, 1]))
效果:
——————————————————————————————
接着,发现灰色的底想把它换成白色的。
代码:
ax.w_xaxis.set_pane_color((1.0, 1.0, 1.0, 1.0))
ax.w_yaxis.set_pane_color((1.0, 1.0, 1.0, 1.0))
ax.w_zaxis.set_pane_color((1.0, 1.0, 1.0, 1.0))
效果:
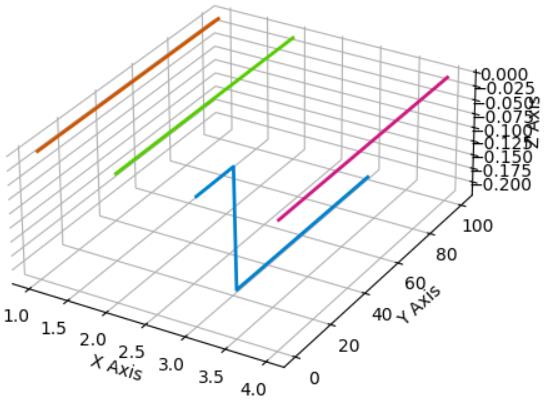
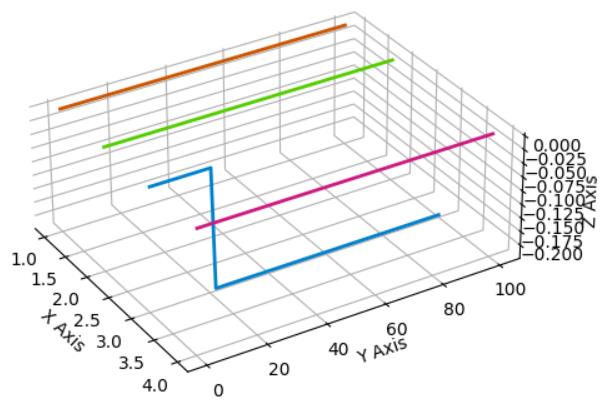
然后,觉得这个三维图的角度不太好,想要旋转一下坐标轴!
代码:
#分别上下旋转和左右旋转,可以自己设置成一个比较好的参数
ax.view_init(32, -32)
效果:
————————————————————————————
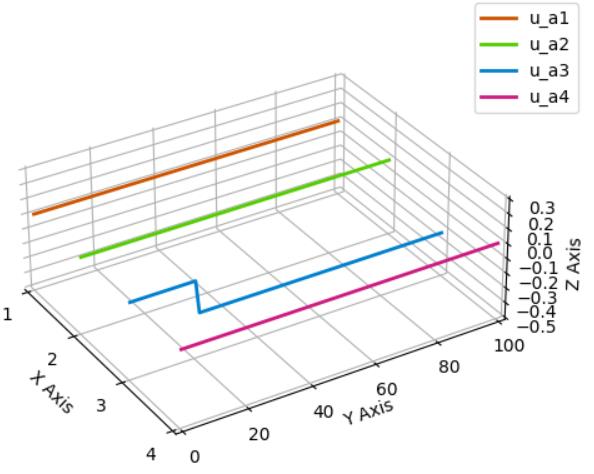
最后,修改一下xlim,xtick,然后添加以下label,就可以得到最上面的效果图了
完整代码如下:
import numpy as np
import matplotlib.pyplot as plt

xs1 = np.ones(100)
ys1 = range(1, 101)
zs1 = np.zeros(100)

xs2 = np.ones(100) * 2
ys2 = range(1, 101)
zs2 = np.zeros(100)

xs3 = np.ones(100) * 3
ys3 = range(1, 101)
zs3 = np.zeros(100)
for i in range(21, 100):
  zs3[i] = -0.22

xs4 = np.ones(100) * 4
ys4 = range(1, 101)
zs4 = np.zeros(100)


# Plot
# ax = plt.figure().add_subplot(projection='3d')

from mpl_toolkits.mplot3d import Axes3D
fig = plt.figure()
ax = Axes3D(fig)

ax.get_proj = lambda: np.dot(Axes3D.get_proj(ax), np.diag([0.8, 1, 0.5, 1]))

ax.w_xaxis.set_pane_color((1.0, 1.0, 1.0, 1.0))
ax.w_yaxis.set_pane_color((1.0, 1.0, 1.0, 1.0))
ax.w_zaxis.set_pane_color((1.0, 1.0, 1.0, 1.0))
ax.plot(xs1, ys1, zs1, lw=2, color=[0.8, 0.33, 0])
ax.plot(xs2, ys2, zs2, lw=2, color=[0.33, 0.8, 0])
ax.plot(xs3, ys3, zs3, lw=2, color=[0, 0.5, 0.8])
ax.plot(xs4, ys4, zs4, lw=2, color=[0.8, 0.1, 0.5])
ax.set_xlabel("X Axis")
ax.set_ylabel("Y Axis")
ax.set_zlabel("Z Axis")
ax.set_title("Addective fault simulation")
ax.set(xlim=[1, 4], ylim=[0, 100], zlim=[-0.5, 0.3])
ax.view_init(32, -32)
plt.legend(labels=['u_a1','u_a2','u_a3','u_a4'], loc='best')
plt.xticks([1,2,3,4])
plt.show()
效果:
作于:
2021-6-7
12:20
以上是关于python(matplotlib)三维图像绘制,旋转坐标轴视角,坐标轴拉伸,缩放比例的主要内容,如果未能解决你的问题,请参考以下文章