实用的才是最好的,教你如何以MATLAB的方式实现高等应用数学问题
Posted 文宇肃然
tags:
篇首语:本文由小常识网(cha138.com)小编为大家整理,主要介绍了实用的才是最好的,教你如何以MATLAB的方式实现高等应用数学问题相关的知识,希望对你有一定的参考价值。
前言
关于MATLAB系列的精品专栏大家可参见
喜欢的小伙伴可自行订阅,你的支持就是我不断更新的动力哟!
高等应用数学问题(001)
问题:
已知Fibonacci数列由式

可以生成,其中初值为:

试编写出生成某项Fibonacci数值的MATLAB函数,要求
①函数格式为y=fib(k),给出k即能求出第k项ak并赋给y向量;
②编写适当语句,对输入输出变量进行检验,确保函数能正确调用;
③利用递归调用的方式编写此函数。
解答:
function y=fib(n)

if round(n)==n & n>=1

     if n>=3

        y=fib(n-1)+fib(n-2);

    else, y=1;

    end

else

    error(’n must be positive integer.’)

end
例如,n = 10 可以求出相应的项为
>> fib(10)
ans =
55
现在需要比较一下递归实现的速度和循环实现的速度
>> tic, fib(20), toc
ans =
832040
elapsed_time = 62.0490
>>tic, a=[1 1]; for i=3:30, a(i)=a(i-1)+a(i-2); end, a(30), toc
ans =
832040
elapsed_time =
0.0100
应该指出,递归的调用方式速度较慢,比循环语句慢很多,所以不是特别需要,解这样问题 没有必要用递归调用的方式。
拓展:
递归函数的代码生成
-
为了生成 MATLAB® 递归函数的代码,代码生成器使用编译时递归或运行时递归。
https://ww2.mathworks.cn/help/simulink/ug/code-generation-for-recursive-functions.html#bvetxnb-1
https://ww2.mathworks.cn/help/simulink/ug/code-generation-for-recursive-functions.html#bvetxp4-1
-
您可以通过修改您的 MATLAB 代码来影响代码生成器是使用编译时递归还是运行时递归。
请参阅Force Code Generator to Use Run-Time Recursion。
https://ww2.mathworks.cn/help/simulink/ug/recursive-function-generates-too-many-function-copies.html
-
您可以通过修改配置参数来禁止递归或禁用运行时递归。
https://ww2.mathworks.cn/help/simulink/ug/code-generation-for-recursive-functions.html#bvet1zr-1
-
https://ww2.mathworks.cn/help/simulink/ug/code-generation-for-recursive-functions.html#bvetxp4-1
-
当您在用于代码生成的 MATLAB 代码中使用递归函数时,必须遵守某些限制。
请参阅用于代码生成的递归函数限制。
https://ww2.mathworks.cn/help/simulink/ug/code-generation-for-recursive-functions.html#bvetxr2-1
编译时递归
-
使用编译时递归,代码生成器会在生成的代码中创建递归函数的多个版本。
-
每个版本的输入都具有针对该版本自定义的值或大小。
-
这些版本称为函数特化。
-
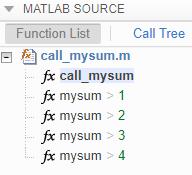
通过查看 MATLAB Function 报告或生成的 C 代码,您可以知道代码生成器使用了编译时递归。
-
以下是报告中显示的编译时递归的示例。
运行时递归
-
使用运行时递归,代码生成器会在生成的代码中生成递归函数。
-
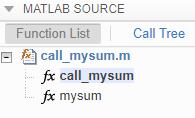
通过查看 MATLAB Function 报告或生成的 C 代码,您可以知道代码生成器使用了运行时递归。
-
以下是报告中显示的运行时递归的示例。
禁止递归
在模型配置参数中,将 Compile-time recursion limit for MATLAB functions 设置为 0。
禁用运行时递归
-
有些编码标准(例如 MISRA®)不允许递归。要提高生成符合 MISRA C® 的代码的可能性,请禁用运行时递归。
-
在模型配置参数中,清除 Enable run-time recursion for MATLAB functions 复选框。
-
如果您的代码需要运行时递归但运行时递归被禁用,则必须重写代码,以便它能够使用编译时递归或不使用递归。
用于代码生成的递归函数限制
在用于代码生成的 MATLAB 代码中使用递归时,请遵循以下限制:
-
MATLAB Function 模块中的顶层函数不能是递归函数,但它可以调用递归函数。
-
在运行时递归函数中进行第一次递归调用之前,为该函数的所有输出赋值。
-
为运行时递归函数的元胞数组输出的所有元素赋值。
-
运行时递归函数的输入和输出不能是类。
-
对于运行时递归,Maximum stack size 参数将被忽略。
高等应用数学问题(002)
问题:
由矩阵理论可知,如果一个矩阵 M 可以写成 M = A + BCBT , 并且其中 A, B, C 为相应 阶数的矩阵,则 M 矩阵的逆矩阵可以由下面的算法求出

试根据上面的算法用 MATLAB 语句编写一个函数对矩阵 M 进行求逆,并通过一个小例子来 检验该程序,并和直接求逆方法进行精度上的比较。
解答:
编写这个函数
function Minv=part_inv(A,B,C)

Minv=inv(A)-inv(A)*B*inv(inv(C)+B’*inv(A)*B)*B’*inv(A);
假设矩阵为

且已知该矩阵可以分解成

对这个例子。
可以
>> M=[51 50 36 16; 50 77 60 32; 36 60 87 48; 16 32 48 68];
iM=inv(M); % 数值逆,直接解法
iM =
0.0553 -0.0389 0.0017 0.0041
-0.0389 0.0555 -0.0210 -0.0021
0.0017 -0.0210 0.0328 -0.0137
0.0041 -0.0021 -0.0137 0.0244
>> A=diag([1 2 3 4]); B=hankel([1 2 3 4]); C=diag([4 3 2 1]);
iM1=part_inv(A,B,C) % 分块矩阵的求解方法
iM1 =
0.0553 -0.0389 0.0017 0.0041
-0.0389 0.0555 -0.0210 -0.0021
0.0017 -0.0210 0.0328 -0.0137
0.0041 -0.0021 -0.0137 0.0244
乍看结果,似乎二者完全一致,实际上数值算法是有区别的。
我们这里用解析方法得出矩阵 的逆,然后用下面的语句比较两个结果的精度
>> M1=sym(M); iM0=inv(M1)
iM0 =

>> norm(double(iM0)-iM) % 直接求解的误差范数
ans =
2.7990e-017
>> norm(double(iM0)-iM1) % 间接求解的误差范数
ans =
3.6583e-016
可见,用间接方法得出的逆矩阵误差更大,因为在这里新编写的函数中 inv() 函数使用了多次,由此产生很大的传递误差。
由此可以得出结论:
如果某问题存在直接解,则尽量别使用间接方法,以加大传递误差。
高等应用数学问题(003)
问题:
下面给出了一个迭代模型

写出求解该模型的 M-函数,如果取迭代初值为 x0 = 0,y0 = 0,那么请进行 30000 次迭代求出 一组 x 和 y 向量,然后在所有的 xk 和 yk 坐标处点亮一个点 (注意不要连线),最后绘制出所 需的图形。
提示:
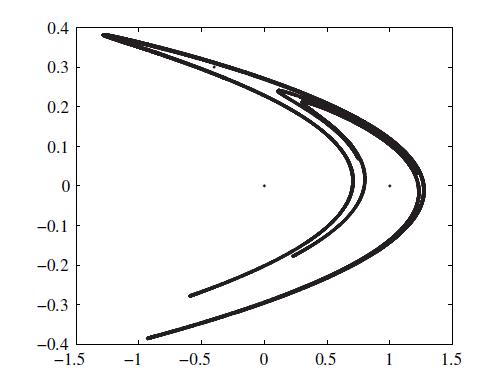
这样绘制出的图形又称为 Henon 引力线图,它将迭代出来的随机点吸引到一 起,最后得出貌似连贯的引力线图。
解答:
用循环形式解决此问题,可以得出如图所示的 Henon 引力线图。
x=0; y=0;

for i=1:29999

     x(i+1)=1+y(i)-1.4*x(i)^2;

     y(i+1)=0.3*x(i);

end

plot(x,y,’.’)
上述的算法由于动态定义 x 和 y,所以每循环一步需要重新定维,这样做是很消耗时间 的,所以为加快速度,可以考虑预先定义这两个变量,如给出 x=zeros(1,30000)。
拓展:
关于Henon映射:
厄农映射(Hénon map)是一种可以产生混沌现象的离散动态系统,迭代表达式为:

在经典厄农映射中,参数值分别取为a=1.4及b=0.3,此时,系统表现出混沌现象。
而当a与b取其他不同值时,系统可表现为混沌现象、阵发性现象,或收敛至周期点。
通过轨道图可以看出不同参数下系统的行为特征。
厄农映射是由法国数学家米歇尔·厄农提出的,以此作为洛伦茨模型的庞加莱截面的简化模型。
对经典厄农映射而言,任意初始点或趋向厄农奇异吸引子,或发散至无穷大。
厄农吸引子具有分形结构,其在一个方向上连续,另一个方向上则为一个康托尔集。
数值计算表明经典厄农吸引子的关联维数为1.25±0.02,豪斯多夫维数为1.261±0.003。
高等应用数学问题(004)
问题:
用 MATLAB 语言的基本语句显然可以立即绘制一个正三角形,试结合循环结构,编写一个小程序,在同一个坐标系下绘制出该正三角形绕其中心旋转后得出的一系列三角形,还可以调整旋转步距观察效果。
解答:
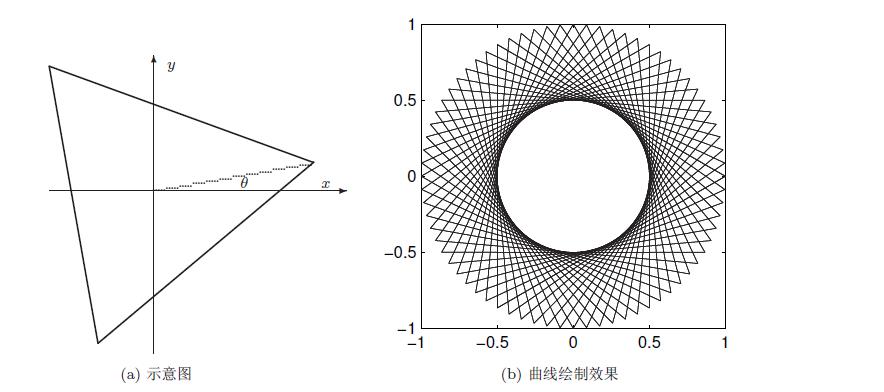
假设正三角形逆时针旋转 θ 度,则可以得出如图(a)所示的示意图,三角形的三个 顶点为 (cos θ, sin θ), (cos(θ + 120◦), sin(θ + 120◦)), (cos(θ + 240◦), sin(θ + 240◦)),可以绘制出 其曲线,如图(b)所示,试减小步距,如选择 ∆θ = 2, 1, 0.1,观察效果。
 t=[0,120,240,0]*pi/180;% 变换成弧度

xxx=[]; yyy=[];


for i=0:5:360

     tt=i*pi/180;

    xxx=[xxx; cos(tt+t)];

    yyy=[yyy; sin(tt+t)];

end


plot(xxx’,yyy’,’r’),

axis(’square’)
拓展:
1、在matlab中,计算角度的相关三角函数是sind、cosd、tand等,
在matlab中,计算弧度的相关三角函数是sin、cos、tan等。
2、可以看一下帮助中sind函数介绍,在命令行窗口中输入“help sind”。
>> help sin
sin Sine of argument in radians.
sin(X) is the sine of the elements of X.
>> help sind
sind Sine of argument in degrees.
sind(X) is the sine of the elements of X, expressed in degrees.
For integers n, sind(n*180) is exactly zero, whereas sin(n*pi) reflects the accuracy of the floating point value of pi.
3、如果用sind函数表示角度的话,输入 sind(30),其中30是角度。
4、如果用sin函数表示角度的话,输入sin(30/180*pi)。
5、也可以使用deg2rad将角度转换为弧度,输入 sin(deg2rad(30))得到的是相同的结果。
高等应用数学问题(005)
问题:
选择合适的步距绘制出下面的图形:

其中 t ∈ (−1, 1)。
解答:
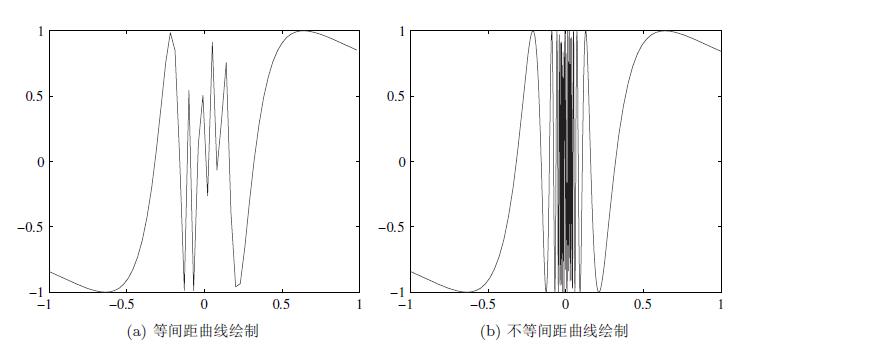
用普通的绘图形式,选择等间距,得出如图a所示的曲线,其中 x = 0 左右显得粗糙。
>> t=-1:0.03:1; y=sin(1./t); plot(t,y)
选择不等间距方法,可以得出如图b所示的曲线。
>> t=[-1:0.03: -0.25, -0.248:0.001:0.248, 0.25:0.03:1];
y=sin(1./t);
plot(t,y)
拓展:
这里的等距和不等距策略值得借鉴,大家仔细体会一下!
>> help plot
plot Linear plot.
plot(X,Y)绘制向量Y与向量X。如果X或Y是一个矩阵,那么向量将与矩阵的行或列(以哪一行为准)相对绘制。如果X是标量,Y是矢量,则会创建断开连接的线对象,并在X处垂直绘制为离散点。plot(Y)绘制Y的列与它们的索引。如果Y是复的,plot(Y)等同于plot(real(Y),imag(Y))。在所有其他用法中,虚部都被忽略。可以通过plot(X,Y,S)获得各种线型、绘图符号和颜色,其中S是从以下任何列或所有列中的一个元素构成的字符串:
b blue
. point
- solid
g green
o circle
: dotted
r red
x x-mark
-. dashdot
c cyan
+ plus
-- dashed
m magenta
* star
(none) no line
y yellow
s square
k black
d diamond
w white
v triangle (down)
^ triangle (up)
< triangle (left)
> triangle (right)
p pentagram
h hexagram
For example,
plot(X,Y,'c+:')
plots a cyan dotted line with a plus at each data point;
plot(X,Y,'bd')
plots blue diamond at each data point but does not draw any line.
plot(X1,Y1,S1,X2,Y2,S2,X3,Y3,S3,...)
combines the plots defined by the (X,Y,S) triples, where the X's and Y's are vectors or matrices and the S's are strings.
For example, plot(X,Y,'y-',X,Y,'go') plots the data twice, with a solid yellow line interpolating green circles at the data points.
The plot command, if no color is specified, makes automatic use of the colors specified by the axes ColorOrder property.
By default, plot cycles through the colors in the ColorOrder property.
For monochrome systems, plot cycles over the axes LineStyleOrder property.
Note that RGB colors in the ColorOrder property may differ from similarly-named colors in the (X,Y,S) triples.
For example, the second axes ColorOrder property is medium green with RGB [0 .5 0], while plot(X,Y,'g') plots a green line with RGB [0 1 0].
If you do not specify a marker type, plot uses no marker.
If you do not specify a line style, plot uses a solid line.
plot(AX,...) plots into the axes with handle AX.
plot returns a column vector of handles to lineseries objects, one handle per plotted line.
The X,Y pairs, or X,Y,S triples, can be followed by parameter/value pairs to specify additional properties of the lines.
For example, plot(X,Y,'LineWidth',2,'Color',[.6 0 0]) will create a plot with a dark red line width of 2 points.
Example
x = -pi:pi/10:pi;
y = tan(sin(x)) - sin(tan(x));
plot(x,y,'--rs','LineWidth',2,...
'MarkerEdgeColor','k',...
'MarkerFaceColor','g',...
'MarkerSize',10)
See also plottools, semilogx, semilogy, loglog, plotyy, plot3, grid, title, xlabel, ylabel, axis, axes, hold, legend, subplot, scatter.
高等应用数学问题(006)
问题:
对合适的 θ 范围选取分别绘制出下列极坐标图形:

解答:
绘制极坐标曲线的方法很简单,用 polar(θ,ρ) 即可以绘制出极坐标图,如图 2-4 所 示。注意绘制图形时的点运算:
 t=0:0.01:2*pi;

subplot(221), polar(t,1.0013*t.^2),% (a)

subplot(222), t1=0:0.01:4*pi; polar(t1,cos(7*t1/2))% (b)

subplot(223), polar(t,sin(t)./t)% (c)

subplot(224), polar(t,1-(cos(7*t)).^3)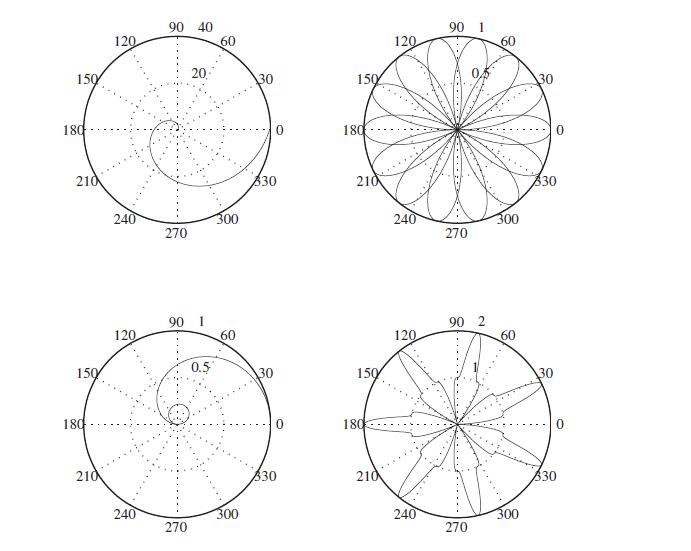
拓展:
>> help polar
polar Polar coordinate plot.
polar(THETA, RHO) makes a plot using polar coordinates of the angle THETA, in radians, versus the radius RHO.
polar(THETA, RHO, S) uses the linestyle specified in string S.
See PLOT for a description of legal linestyles.
polar(AX, ...) plots into AX instead of GCA.
H = polar(...) returns a handle to the plotted object in H.
Example:
t = 0 : .01 : 2*pi;
polar(t, sin(2*t) .* cos(2*t), '--r');
See also polarplot, plot, loglog, semilogx, semilogy.
高等应用数学问题(007)
问题:
用图解的方式找到下面两个方程构成的联立方程的近似解。

解答:
这两个方程应该用隐式方程绘制函数 ezplot() 来绘制,交点即方程的解,如图a所示。
ezplot(’x^2+y^2-*x*y^2’);

hold on

ezplot(’x^3-x^2=y^2-y’)
可用局部放大的方法求出更精确的值,如图b所示。
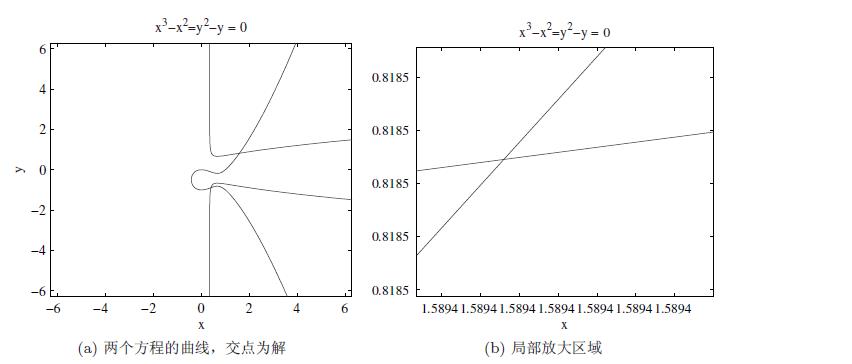
从图上可以精确读出两个交点,(0.4012, −0.8916),(1.5894,0.8185)。
试将这两个点分别代入原始方程进行验证。
拓展:
>> help ezplot
ezplot (NOT RECOMMENDED) Easy to use function plotter
ezplot is not recommended. Use FPLOT or FIMPLICIT instead.
ezplot(FUN) plots the function FUN(X) over the default domain -2*PI < X < 2*PI, where FUN(X) is an explicitly defined function of X.
ezplot(FUN2) plots the implicitly defined function FUN2(X,Y) = 0 over the default domain -2*PI < X < 2*PI and -2*PI < Y < 2*PI.
ezplot(FUN,[A,B]) plots FUN(X) over A < X < B.
ezplot(FUN2,[A,B]) plots FUN2(X,Y) = 0 over A < X < B and A < Y < B.
ezplot(FUN2,[XMIN,XMAX,YMIN,YMAX]) plots FUN2(X,Y) = 0 over XMIN < X < XMAX and YMIN < Y < YMAX.
ezplot(FUNX,FUNY) plots the parametrically defined planar curve FUNX(T) and FUNY(T) over the default domain 0 < T < 2*PI.
ezplot(FUNX,FUNY,[TMIN,TMAX]) plots FUNX(T) and FUNY(T) over TMIN < T < TMAX.
ezplot(FUN,[A,B],FIG), ezplot(FUN2,[XMIN,XMAX,YMIN,YMAX],FIG), or ezplot(FUNX,FUNY,[TMIN,TMAX],FIG) plots the function over the specified domain in the figure window FIG.
ezplot(AX,...) plots into AX instead of GCA or FIG.
H = ezplot(...) returns handles to the plotted objects in H.
Examples:
The easiest way to express a function is via a string:
ezplot('x^2 - 2*x + 1')
One programming technique is to vectorize the string expression using the array operators .* (TIMES), ./ (RDIVIDE), .\\ (LDIVIDE), .^ (POWER).
This makes the algorithm more efficient since it can perform multiple function evaluations at once.
ezplot('x.*y + x.^2 - y.^2 - 1')
You may also use a function handle to an existing function.
Function handles are more powerful and efficient than string expressions.
ezplot(@humps)
ezplot(@cos,@sin)
ezplot plots the variables in string expressions alphabetically.
subplot(1,2,1), ezplot('1./z - log(z) + log(-1+z) + t - 1')
To avoid this ambiguity, specify the order with an anonymous function:
subplot(1,2,2), ezplot(@(z,t)1./z - log(z) + log(-1+z) + t - 1)
If your function has additional parameters, for example k in myfun:
%-----------------------%
function z = myfun(x,y,k)
z = x.^k - y.^k - 1;
%-----------------------%
then you may use an anonymous function to specify that parameter:
ezplot(@(x,y)myfun(x,y,2))
See also
ezcontour, ezcontourf, ezmesh, ezmeshc, ezplot3, ezpolar, ezsurf, ezsurfc, plot, vectorize, function_handle.
高等应用数学问题(008)
问题:
请分别绘制出 xy 和 sin(xy) 的三维图和等高线。
解答:
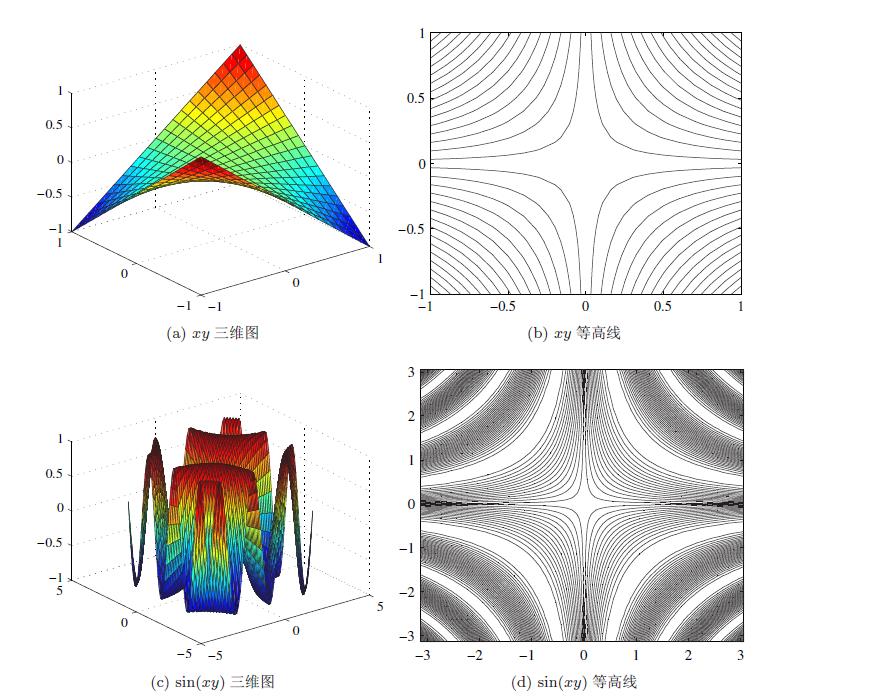
(a) 给出下面命令即可,得出的图形如图 a、b 所示。
 [x,y]=meshgrid(-1:.1:1);

surf(x,y,x.*y),

figure;

contour(x,y,x.*y,30)
(b) 给出下面命令即可,得出的图形如图 c、d 所示。
[x,y]=meshgrid(-pi:.1:pi);

surf(x,y,sin(x.*y)),

figure;

contour(x,y,sin(x.*y),30)
拓展:
>> help meshgrid
meshgrid Cartesian grid in 2-D/3-D space
[X,Y] = meshgrid(xgv,ygv) replicates the grid vectors xgv and ygv to produce the coordinates of a rectangular grid (X, Y).
The grid vector xgv is replicated numel(ygv) times to form the columns of X. The grid vector ygv is replicated numel(xgv) times to form the rows of Y.
[X,Y,Z] = meshgrid(xgv,ygv,zgv) replicates the grid vectors xgv, ygv, zgv to produce the coordinates of a 3D rectangular grid (X, Y, Z). The grid vectors xgv,ygv,zgv form the columns of X, rows of Y, and pages of Z respectively.
(X,Y,Z) are of size numel(ygv)-by-numel(xgv)-by(numel(zgv).
[X,Y] = meshgrid(gv) is equivalent to [X,Y] = meshgrid(gv,gv).
[X,Y,Z] = meshgrid(gv) is equivalent to [X,Y,Z] = meshgrid(gv,gv,gv).
The coordinate arrays are typically used for the evaluation of functions of two or three variables and for surface and volumetric plots.
meshgrid and NDGRID are similar, though meshgrid is restricted to 2-D and 3-D while NDGRID supports 1-D to N-D. In 2-D and 3-D the coordinates output by each function are the same, the difference is the shape of the output arrays. For grid vectors xgv, ygv and zgv of length M, N and P respectively, NDGRID(xgv, ygv) will output arrays of size M-by-N while meshgrid(xgv, ygv) outputs arrays of size N-by-M.
Similarly, NDGRID(xgv, ygv, zgv) will output arrays of size M-by-N-by-P while meshgrid(xgv, ygv, zgv) outputs arrays of size N-by-M-by-P.
Example:
Evaluate the function x*exp(-x^2-y^2) over the range -2 < x < 2, -4 < y < 4,
[X,Y] = meshgrid(-2:.2:2, -4:.4:4);
Z = X .* exp(-X.^2 - Y.^2);
surf(X,Y,Z)
Class support for inputs xgv,ygv,zgv:
float: double, single
integer: uint8, int8, uint16, int16, uint32, int32, uint64, int64
See also surf, slice, ndgrid.
>> help surf
surf 3-D colored surface.
surf(X,Y,Z,C) plots the colored parametric surface defined by four matrix arguments. The view point is specified by VIEW. The axis labels are determined by the range of X, Y and Z, or by the current setting of AXIS. The color scaling is determined by the range of C, or by the current setting of CAXIS. The scaled color values are used as indices into the current COLORMAP. The shading model is set by SHADING.
surf(X,Y,Z) uses C = Z, so color is proportional to surface height.
surf(x,y,Z) and surf(x,y,Z,C), with two vector arguments replacing the first two matrix arguments, must have length(x) = n and length(y) = m where [m,n] = size(Z). In this case, the vertices of the surface patches are the triples (x(j), y(i), Z(i,j)).
Note that x corresponds to the columns of Z and y corresponds to the rows.
surf(Z) and surf(Z,C) use x = 1:n and y = 1:m.
In this case, the height, Z, is a single-valued function, defined over a geometrically rectangular grid.
surf(...,'PropertyName',PropertyValue,...) sets the value of the specified surface property. Multiple property values can be set with a single statement.
surf(AX,...) plots into AX instead of GCA.
surf returns a handle to a surface plot object.
AXIS, CAXIS, COLORMAP, HOLD, SHADING and VIEW set figure, axes, and surface properties which affect the display of the surface.
See also surfc, surfl, mesh, shading.
>> help contour
contour Contour plot.
contour(Z) draws a contour plot of matrix Z in the x-y plane, with the x-coordinates of the vertices corresponding to column indices of Z and the y-coordinates corresponding to row indices of Z. The contour levels are chosen automatically.
contour(X,Y,Z) draws a contour plot of Z using vertices from the mesh defined by X and Y. X and Y can be vectors or matrices.
contour(Z,N) and contour(X,Y,Z,N) draw N contour lines, choosing the levels automatically.
contour(Z,V) and contour(X,Y,Z,V) draw a contour line for each level specified in vector V. Use contour(Z,[v v]) or contour(X,Y,Z,[v v]) to draw contours for the single level v.
contour(AX, ...) plots into the axes AX.
[C,H] = contour(...) returns contour matrix C and a handle, H, to a contour object. These can be used as inputs to CLABEL. The structure of a contour matrix is described in the help for CONTOURC.
contour(..., LineSpec) draws the contours using the line type and color specified by LineSpec (ignoring marker symbols).
To specify additional contour properties, you can follow the arguments in any of the syntaxes described above with name-value pairs.
Example:
[c,h] = contour(peaks);
clabel(c,h)
See also contour3, contourf, clabel.
以上是关于实用的才是最好的,教你如何以MATLAB的方式实现高等应用数学问题的主要内容,如果未能解决你的问题,请参考以下文章